Study VanDeVijver-ER-neg
Study informations
122 subnetworks in total page | file
1481 genes associated page | file
Enriched GO terms page
General informations
General Index page
Study Index page
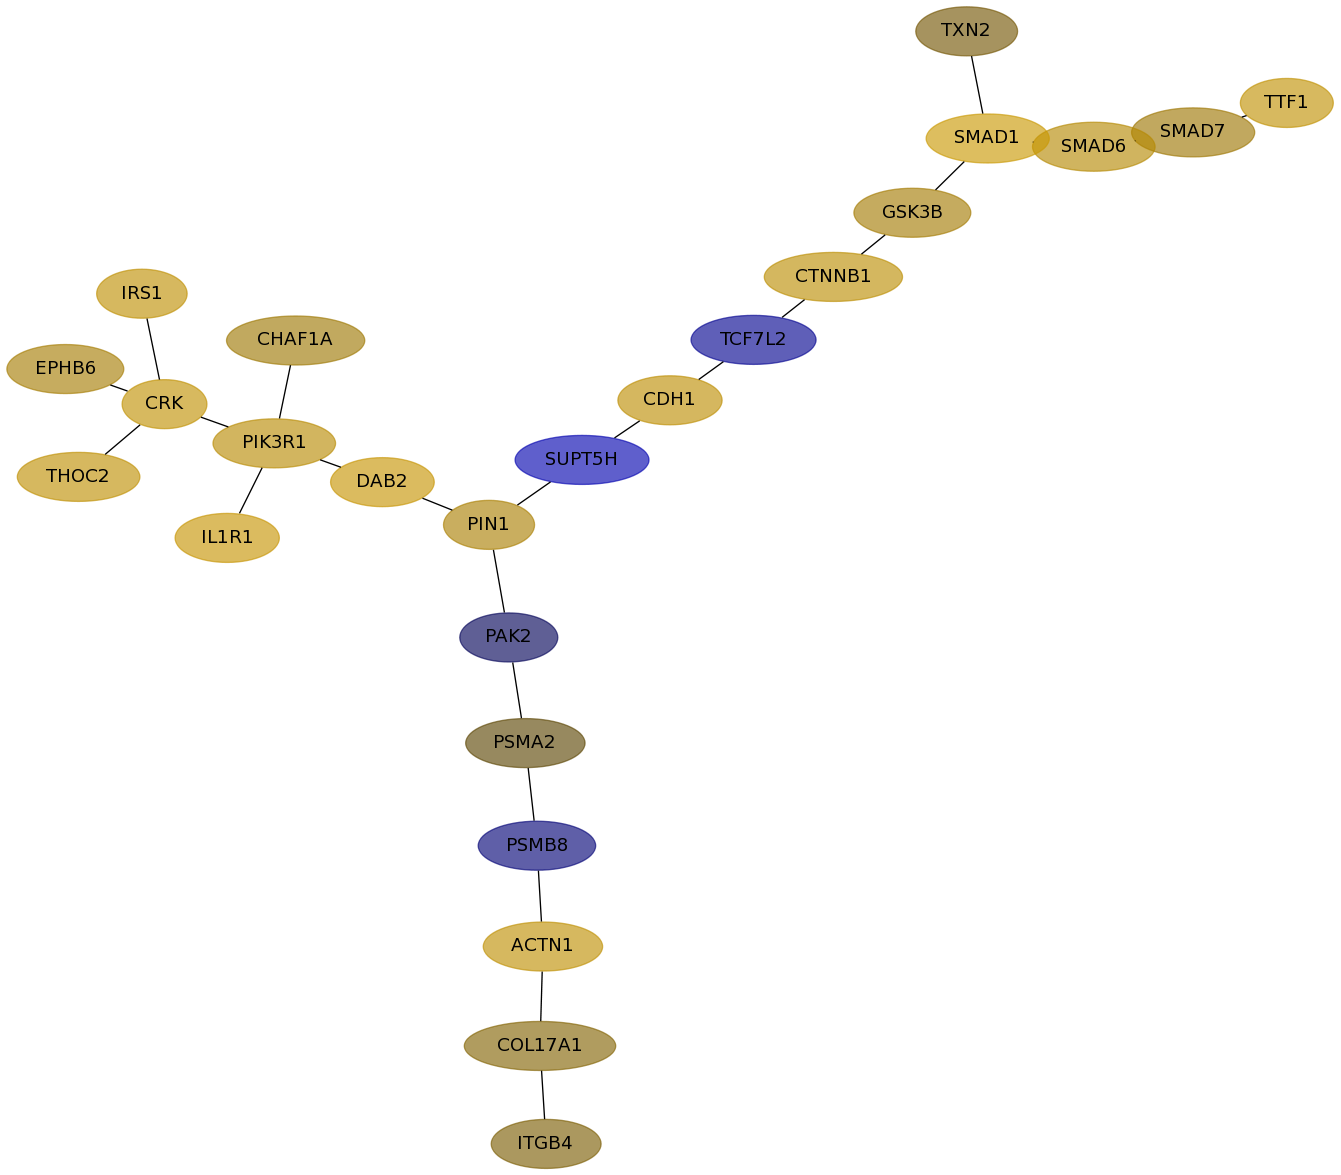
Subnetwork 1234
score
| Dataset | Score | P-val 1 | P-val 2 | P-val 3 | Fisher Score |
|---|
| Desmedt | 0.3335 | 1.493e-03 | 2.600e-05 | 1.617e-01 | 6.276e-09 |
|---|
| IPC | 0.3330 | 3.616e-01 | 1.898e-01 | 9.383e-01 | 6.440e-02 |
|---|
| Loi | 0.4856 | 3.600e-05 | 0.000e+00 | 4.892e-02 | 0.000e+00 |
|---|
| Schmidt | 0.6001 | 1.000e-06 | 0.000e+00 | 1.126e-01 | 0.000e+00 |
|---|
| Wang | 0.2562 | 7.994e-03 | 6.820e-02 | 2.347e-01 | 1.280e-04 |
|---|
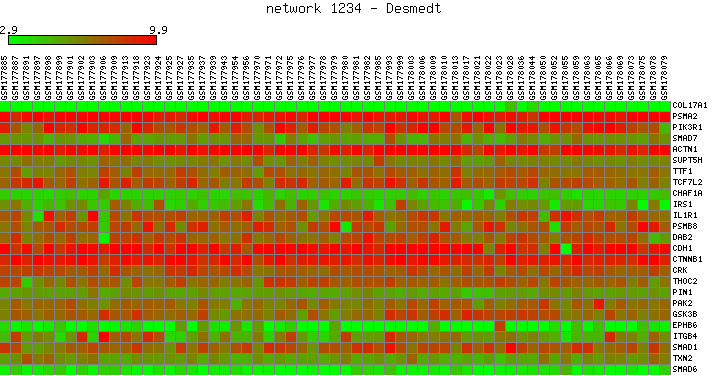
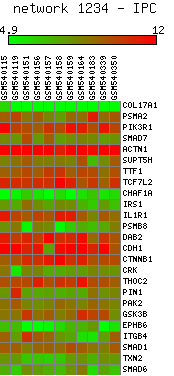
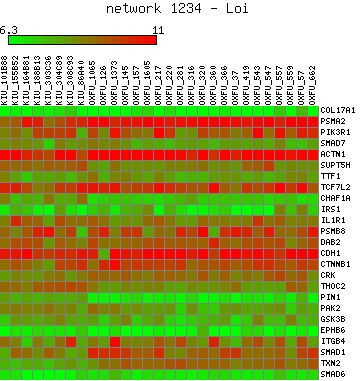
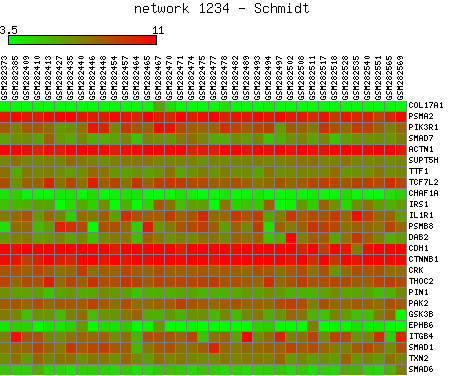
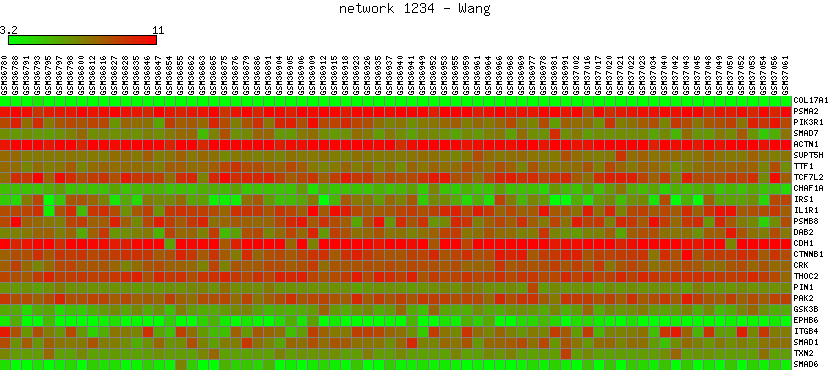
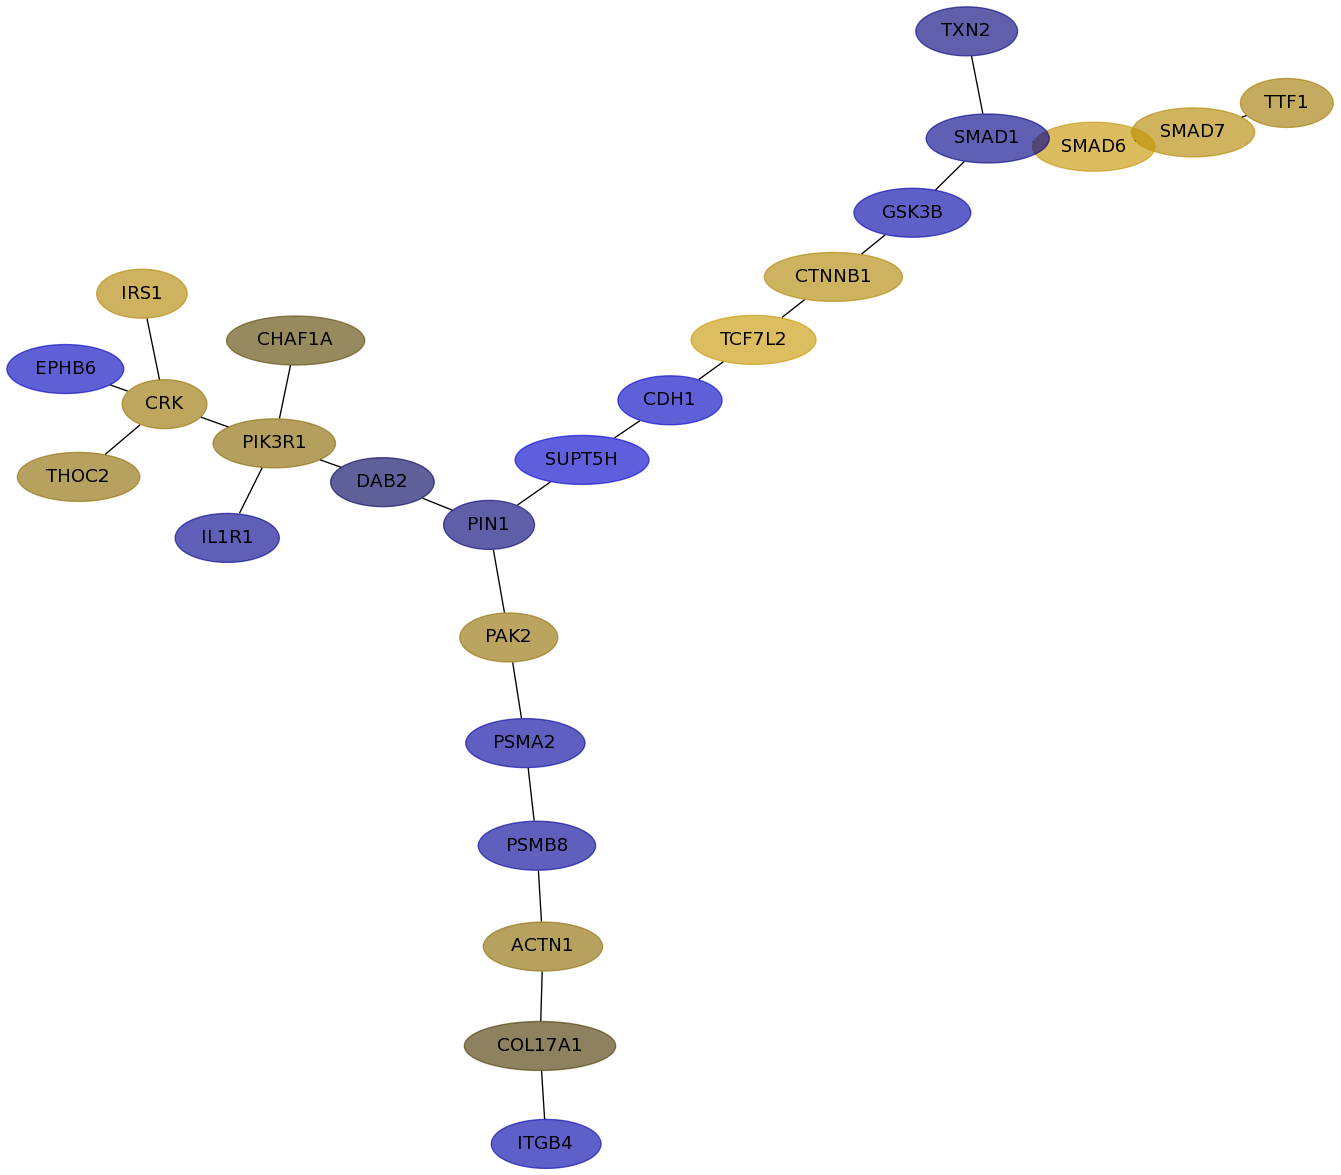
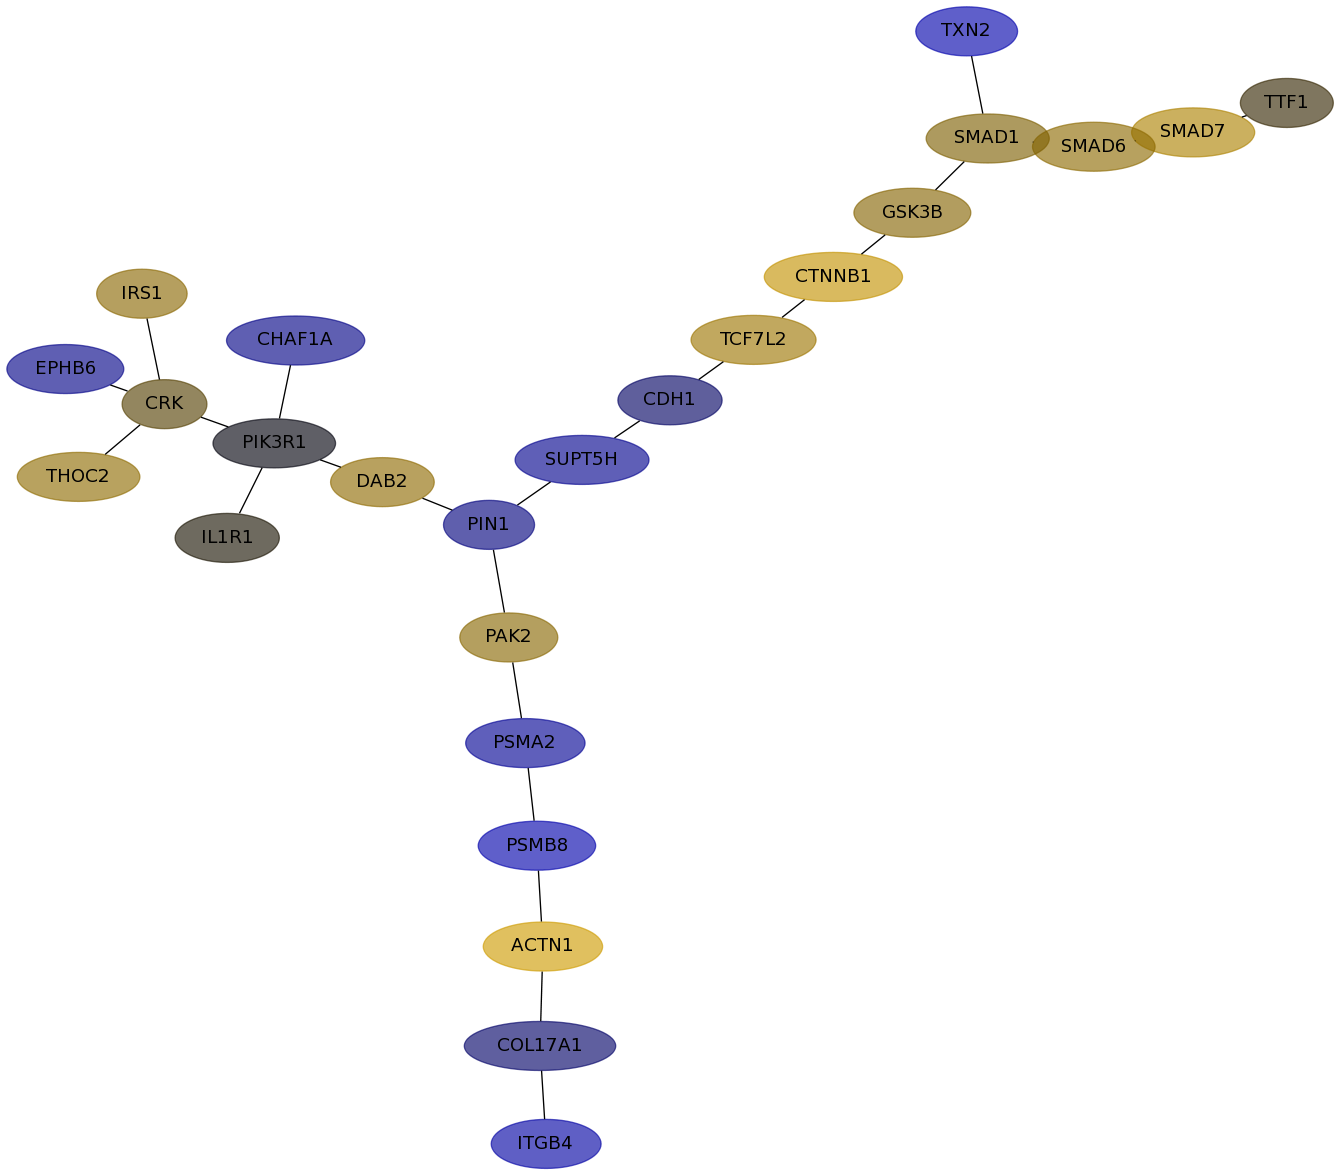
Expression data for subnetwork 1234 in each dataset
Desmedt |
IPC |
Loi |
Schmidt |
Wang |
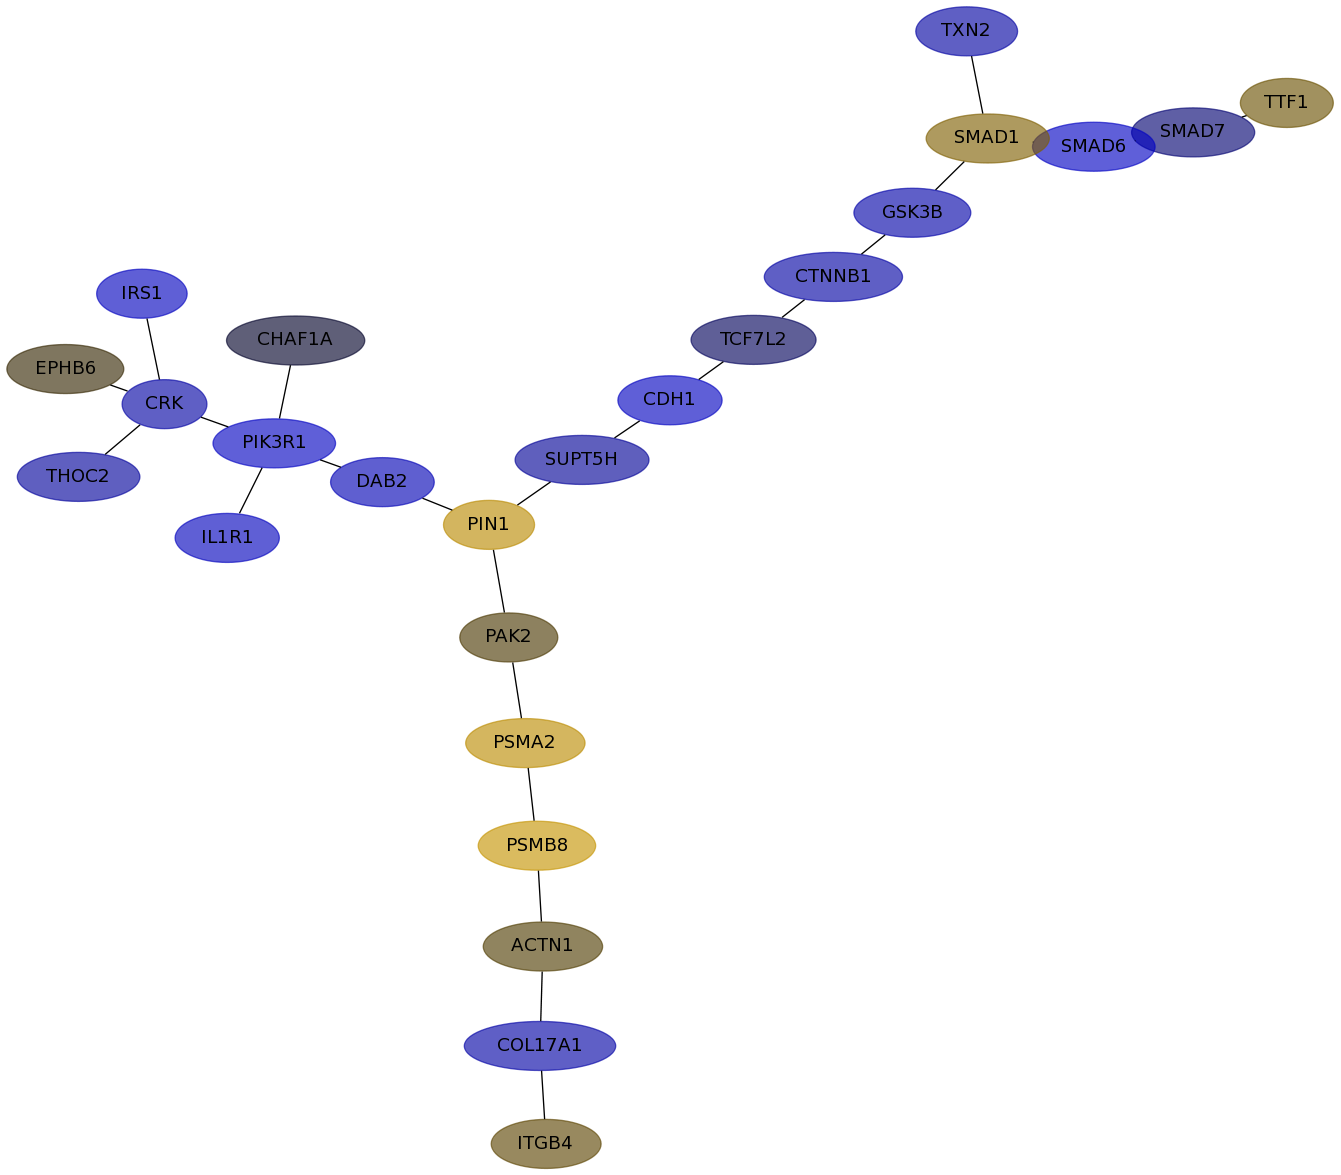
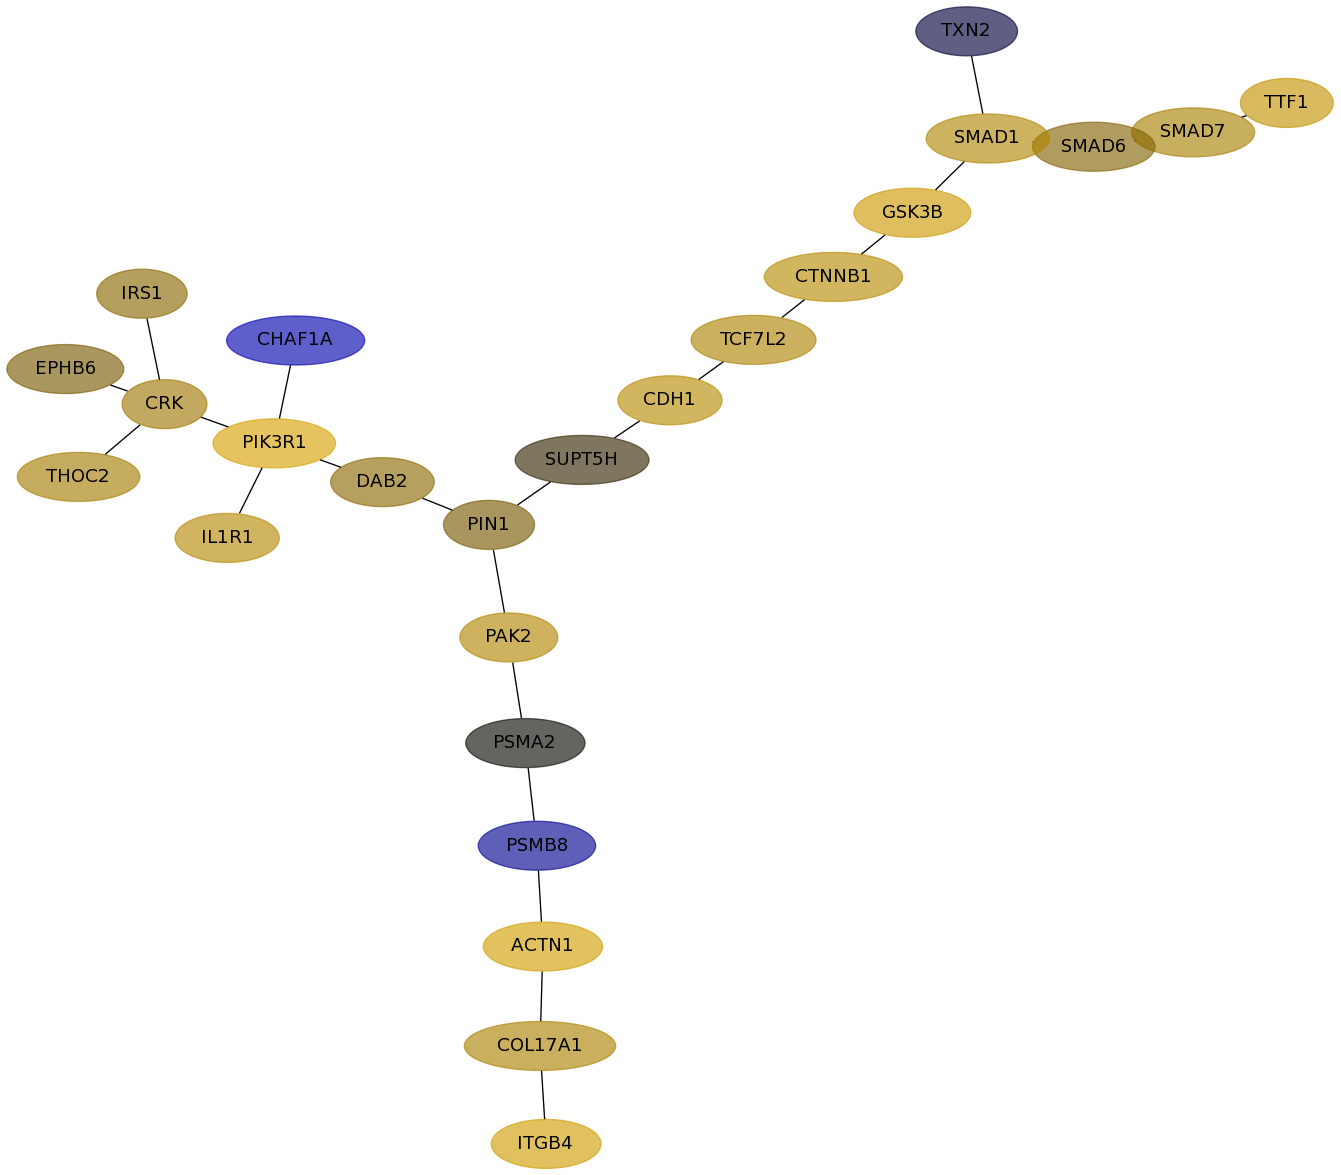
Subnetwork structure for each dataset
- Desmedt
Score for each gene in subnetwork 1234 in each dataset
| Gene Symbol | Links | Frequency | Frequency Rank | Subnetwork score rank | Global rank |
Desmedt | IPC | Loi | Schmidt | Wang |
|---|
| COL17A1 |   | 1 | 652 | 710 | 728 | 0.053 | -0.119 | 0.141 | 0.014 | -0.028 |
|---|
| PSMA2 | | 1 | 652 | 710 | 728 | 0.021 | 0.199 | 0.001 | -0.102 | -0.080 |
|---|
| PIK3R1 | | 91 | 1 | 1 | 1 | 0.189 | -0.237 | 0.381 | 0.065 | -0.002 |
|---|
| SMAD7 | | 3 | 265 | 665 | 651 | 0.099 | -0.035 | 0.131 | 0.169 | 0.147 |
|---|
| ACTN1 | | 4 | 198 | 657 | 635 | 0.217 | 0.016 | 0.347 | 0.068 | 0.314 |
|---|
| SUPT5H | | 9 | 77 | 1 | 18 | -0.150 | -0.085 | 0.007 | -0.298 | -0.068 |
|---|
| TTF1 | | 1 | 652 | 710 | 728 | 0.225 | 0.031 | 0.244 | 0.114 | 0.008 |
|---|
| TCF7L2 | | 17 | 30 | 271 | 264 | -0.071 | -0.021 | 0.143 | 0.280 | 0.101 |
|---|
| CHAF1A | | 2 | 391 | 710 | 709 | 0.102 | -0.006 | -0.147 | 0.022 | -0.057 |
|---|
| IRS1 | | 14 | 42 | 1 | 14 | 0.217 | -0.219 | 0.065 | 0.165 | 0.064 |
|---|
| IL1R1 | | 8 | 84 | 536 | 515 | 0.257 | -0.211 | 0.178 | -0.071 | 0.003 |
|---|
| PSMB8 | | 4 | 198 | 710 | 696 | -0.039 | 0.254 | -0.071 | -0.088 | -0.139 |
|---|
| DAB2 | | 13 | 47 | 1 | 15 | 0.258 | -0.175 | 0.067 | -0.022 | 0.071 |
|---|
| CDH1 | | 54 | 5 | 1 | 4 | 0.211 | -0.227 | 0.187 | -0.236 | -0.024 |
|---|
| CTNNB1 | | 33 | 14 | 33 | 29 | 0.202 | -0.113 | 0.187 | 0.159 | 0.239 |
|---|
| CRK | | 27 | 17 | 206 | 193 | 0.232 | -0.116 | 0.106 | 0.090 | 0.017 |
|---|
| THOC2 | | 11 | 59 | 419 | 406 | 0.217 | -0.094 | 0.119 | 0.068 | 0.072 |
|---|
| PIN1 | | 17 | 30 | 1 | 13 | 0.135 | 0.194 | 0.040 | -0.040 | -0.048 |
|---|
| PAK2 | | 20 | 24 | 1 | 11 | -0.019 | 0.014 | 0.161 | 0.081 | 0.062 |
|---|
| GSK3B | | 47 | 7 | 33 | 28 | 0.117 | -0.130 | 0.292 | -0.129 | 0.057 |
|---|
| EPHB6 | | 7 | 100 | 419 | 407 | 0.122 | 0.008 | 0.042 | -0.219 | -0.059 |
|---|
| ITGB4 | | 6 | 120 | 364 | 355 | 0.044 | 0.021 | 0.313 | -0.134 | -0.114 |
|---|
| SMAD1 | | 24 | 21 | 33 | 30 | 0.287 | 0.049 | 0.159 | -0.062 | 0.048 |
|---|
| TXN2 | | 4 | 198 | 33 | 41 | 0.035 | -0.112 | -0.009 | -0.044 | -0.139 |
|---|
| SMAD6 | | 4 | 198 | 665 | 650 | 0.173 | -0.241 | 0.053 | 0.266 | 0.070 |
|---|
GO Enrichment output for subnetwork 1234 in each dataset
| Name | Accession Number | Link | P-val | Corrected P-val |
|---|
| Wnt receptor signaling pathway through beta-catenin | GO:0060070 |  | 2.914E-09 | 6.701E-06 |
|---|
| BMP signaling pathway | GO:0030509 | | 8.201E-07 | 9.431E-04 |
|---|
| insulin-like growth factor receptor signaling pathway | GO:0048009 | | 9.46E-07 | 7.253E-04 |
|---|
| phosphoinositide 3-kinase cascade | GO:0014065 | | 9.46E-07 | 5.44E-04 |
|---|
| transforming growth factor beta receptor signaling pathway | GO:0007179 | | 2.9E-06 | 1.334E-03 |
|---|
| positive regulation of nucleocytoplasmic transport | GO:0046824 | | 1.13E-05 | 4.331E-03 |
|---|
| positive regulation of intracellular transport | GO:0032388 | | 1.604E-05 | 5.271E-03 |
|---|
| negative regulation of ubiquitin-protein ligase activity during mitotic cell cycle | GO:0051436 | | 1.837E-05 | 5.28E-03 |
|---|
| cell-matrix adhesion | GO:0007160 | | 1.962E-05 | 5.013E-03 |
|---|
| negative regulation of ligase activity | GO:0051352 | | 1.962E-05 | 4.512E-03 |
|---|
| anaphase-promoting complex-dependent proteasomal ubiquitin-dependent protein catabolic process | GO:0031145 | | 1.962E-05 | 4.102E-03 |
|---|
| Name | Accession Number | Link | P-val | Corrected P-val |
|---|
| Wnt receptor signaling pathway through beta-catenin | GO:0060070 | | 1.353E-14 | 3.306E-11 |
|---|
| myoblast cell fate commitment | GO:0048625 | | 1.163E-07 | 1.42E-04 |
|---|
| positive regulation of insulin secretion | GO:0032024 | | 3.247E-07 | 2.644E-04 |
|---|
| phosphoinositide 3-kinase cascade | GO:0014065 | | 3.247E-07 | 1.983E-04 |
|---|
| BMP signaling pathway | GO:0030509 | | 3.523E-07 | 1.721E-04 |
|---|
| insulin-like growth factor receptor signaling pathway | GO:0048009 | | 4.865E-07 | 1.981E-04 |
|---|
| positive regulation of peptide secretion | GO:0002793 | | 9.53E-07 | 3.326E-04 |
|---|
| transforming growth factor beta receptor signaling pathway | GO:0007179 | | 1.191E-06 | 3.637E-04 |
|---|
| regulation of hormone metabolic process | GO:0032350 | | 1.269E-06 | 3.445E-04 |
|---|
| epithelial to mesenchymal transition | GO:0001837 | | 2.614E-06 | 6.387E-04 |
|---|
| myoblast differentiation | GO:0045445 | | 3.897E-06 | 8.655E-04 |
|---|
| Name | Accession Number | Link | P-val | Corrected P-val |
|---|
| Wnt receptor signaling pathway through beta-catenin | GO:0060070 | | 1.368E-14 | 3.293E-11 |
|---|
| myoblast cell fate commitment | GO:0048625 | | 1.737E-07 | 2.089E-04 |
|---|
| positive regulation of insulin secretion | GO:0032024 | | 4.849E-07 | 3.889E-04 |
|---|
| phosphoinositide 3-kinase cascade | GO:0014065 | | 4.849E-07 | 2.916E-04 |
|---|
| BMP signaling pathway | GO:0030509 | | 5.981E-07 | 2.878E-04 |
|---|
| insulin-like growth factor receptor signaling pathway | GO:0048009 | | 7.262E-07 | 2.912E-04 |
|---|
| positive regulation of peptide secretion | GO:0002793 | | 1.422E-06 | 4.888E-04 |
|---|
| regulation of hormone metabolic process | GO:0032350 | | 1.893E-06 | 5.694E-04 |
|---|
| transforming growth factor beta receptor signaling pathway | GO:0007179 | | 2.018E-06 | 5.394E-04 |
|---|
| epithelial to mesenchymal transition | GO:0001837 | | 3.898E-06 | 9.38E-04 |
|---|
| myoblast differentiation | GO:0045445 | | 5.809E-06 | 1.271E-03 |
|---|
| Name | Accession Number | Link | P-val | Corrected P-val |
|---|
| Wnt receptor signaling pathway through beta-catenin | GO:0060070 | | 2.914E-09 | 6.701E-06 |
|---|
| BMP signaling pathway | GO:0030509 | | 8.201E-07 | 9.431E-04 |
|---|
| insulin-like growth factor receptor signaling pathway | GO:0048009 | | 9.46E-07 | 7.253E-04 |
|---|
| phosphoinositide 3-kinase cascade | GO:0014065 | | 9.46E-07 | 5.44E-04 |
|---|
| transforming growth factor beta receptor signaling pathway | GO:0007179 | | 2.9E-06 | 1.334E-03 |
|---|
| positive regulation of nucleocytoplasmic transport | GO:0046824 | | 1.13E-05 | 4.331E-03 |
|---|
| positive regulation of intracellular transport | GO:0032388 | | 1.604E-05 | 5.271E-03 |
|---|
| negative regulation of ubiquitin-protein ligase activity during mitotic cell cycle | GO:0051436 | | 1.837E-05 | 5.28E-03 |
|---|
| cell-matrix adhesion | GO:0007160 | | 1.962E-05 | 5.013E-03 |
|---|
| negative regulation of ligase activity | GO:0051352 | | 1.962E-05 | 4.512E-03 |
|---|
| anaphase-promoting complex-dependent proteasomal ubiquitin-dependent protein catabolic process | GO:0031145 | | 1.962E-05 | 4.102E-03 |
|---|
| Name | Accession Number | Link | P-val | Corrected P-val |
|---|
| Wnt receptor signaling pathway through beta-catenin | GO:0060070 | | 2.914E-09 | 6.701E-06 |
|---|
| BMP signaling pathway | GO:0030509 | | 8.201E-07 | 9.431E-04 |
|---|
| insulin-like growth factor receptor signaling pathway | GO:0048009 | | 9.46E-07 | 7.253E-04 |
|---|
| phosphoinositide 3-kinase cascade | GO:0014065 | | 9.46E-07 | 5.44E-04 |
|---|
| transforming growth factor beta receptor signaling pathway | GO:0007179 | | 2.9E-06 | 1.334E-03 |
|---|
| positive regulation of nucleocytoplasmic transport | GO:0046824 | | 1.13E-05 | 4.331E-03 |
|---|
| positive regulation of intracellular transport | GO:0032388 | | 1.604E-05 | 5.271E-03 |
|---|
| negative regulation of ubiquitin-protein ligase activity during mitotic cell cycle | GO:0051436 | | 1.837E-05 | 5.28E-03 |
|---|
| cell-matrix adhesion | GO:0007160 | | 1.962E-05 | 5.013E-03 |
|---|
| negative regulation of ligase activity | GO:0051352 | | 1.962E-05 | 4.512E-03 |
|---|
| anaphase-promoting complex-dependent proteasomal ubiquitin-dependent protein catabolic process | GO:0031145 | | 1.962E-05 | 4.102E-03 |
|---|

