Study Desmedt-ER-neg
Study informations
165 subnetworks in total page | file
2310 genes associated page | file
Enriched GO terms page
General informations
General Index page
Study Index page
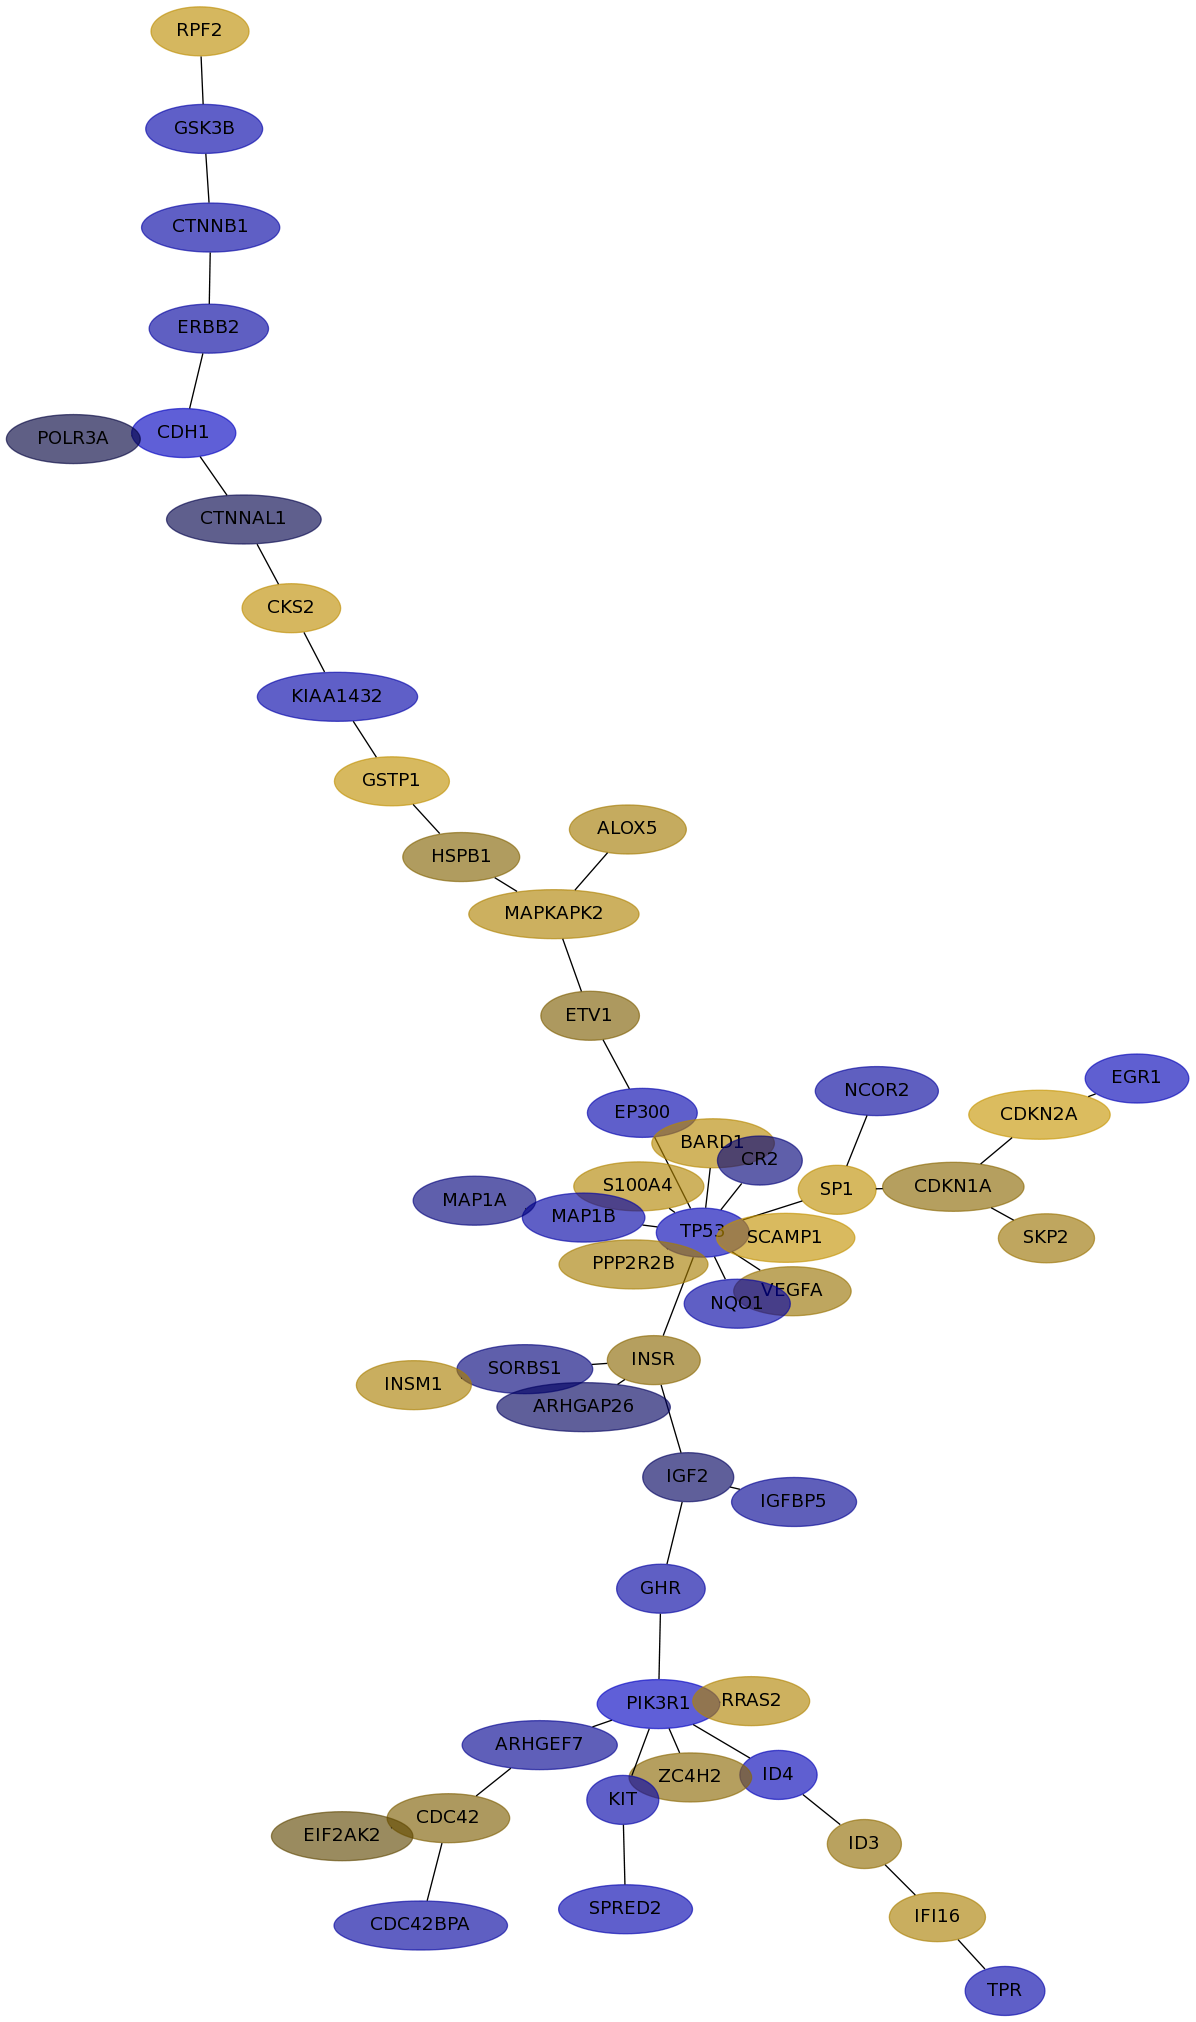
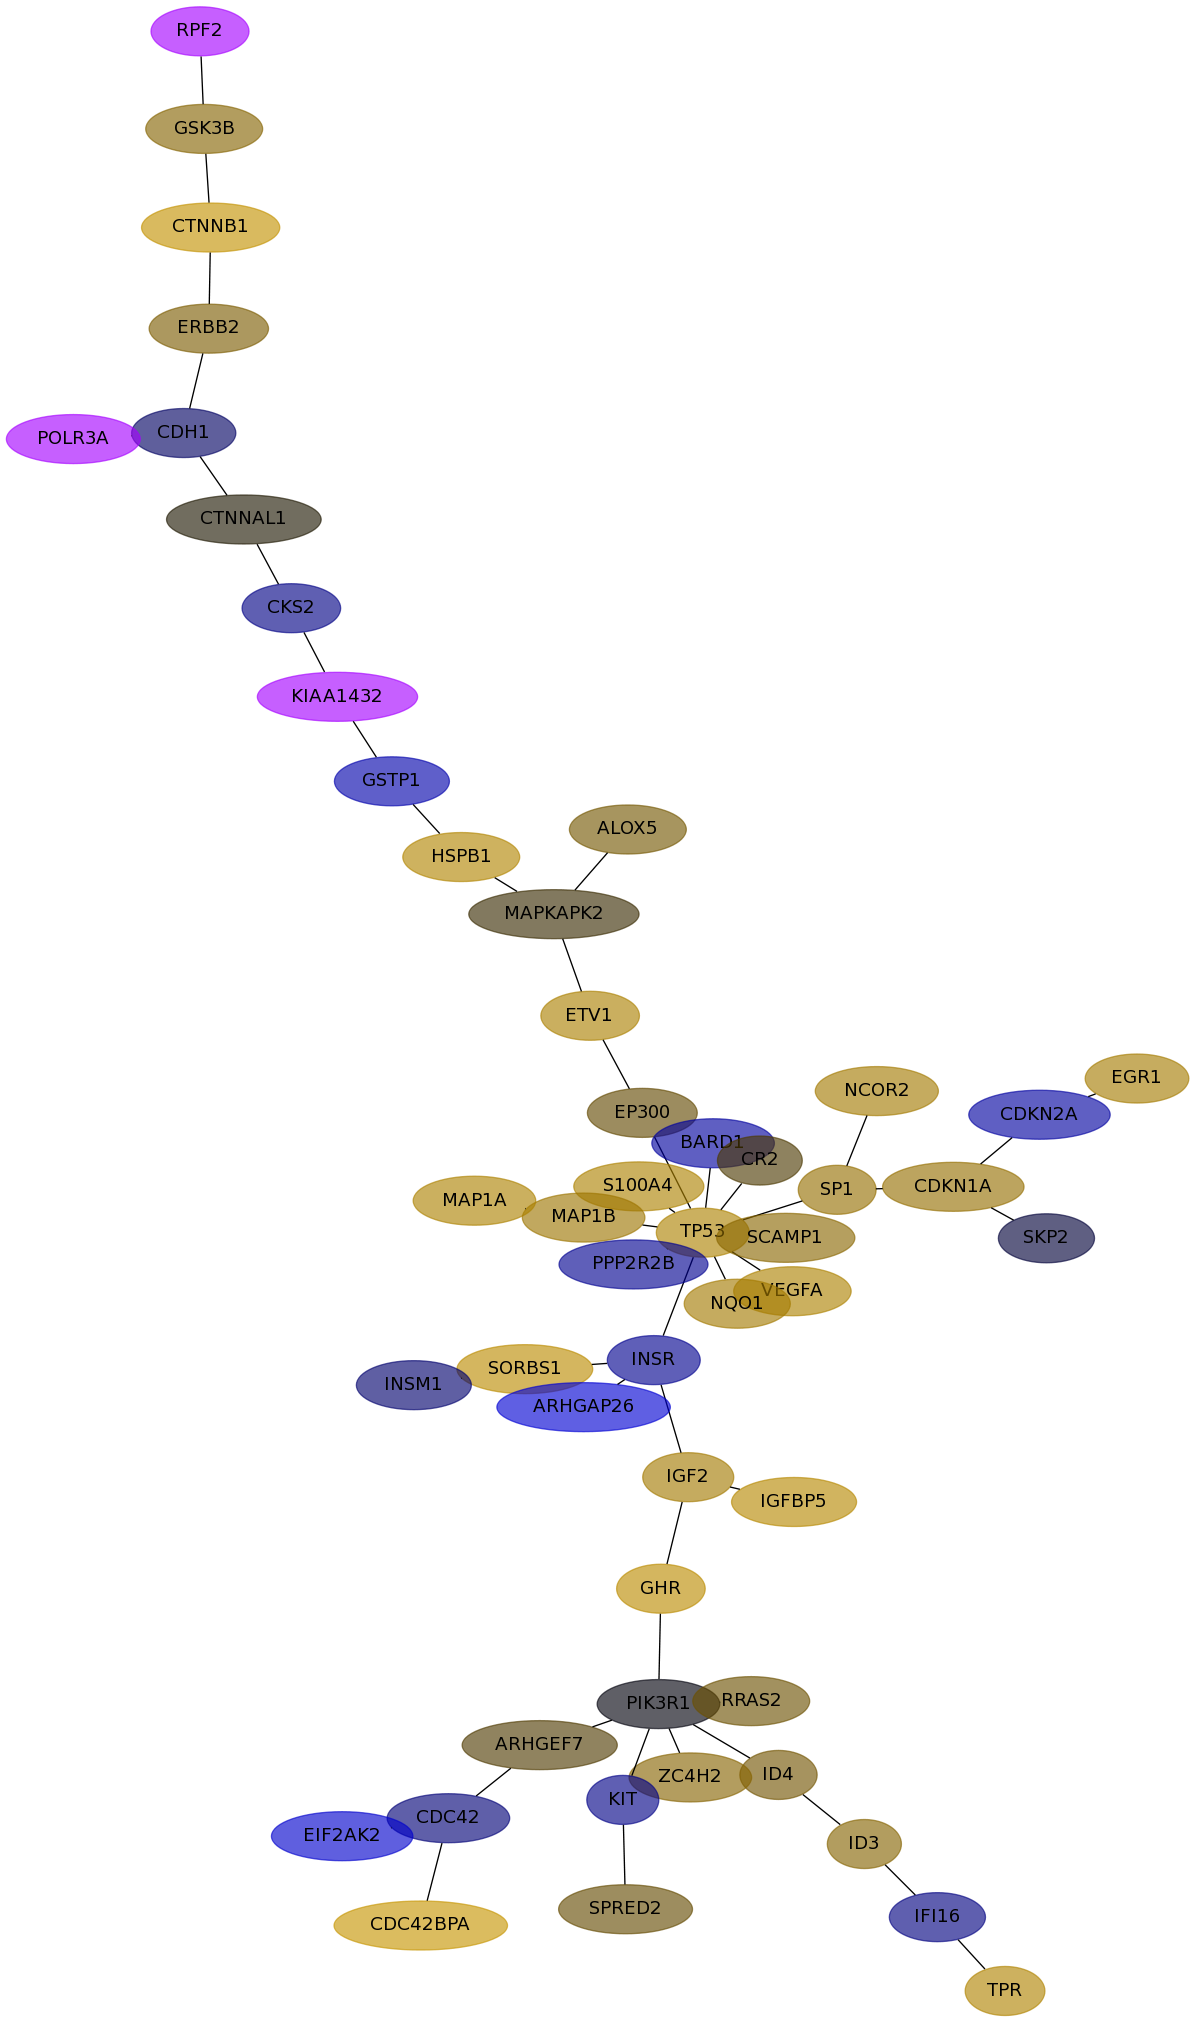
Subnetwork 6851
score
| Dataset | Score | P-val 1 | P-val 2 | P-val 3 | Fisher Score |
|---|
| IPC | 0.7491 | 3.823e-03 | 6.370e-04 | 7.822e-01 | 1.905e-06 |
|---|
| Loi | 0.2308 | 7.955e-02 | 1.117e-02 | 4.265e-01 | 3.790e-04 |
|---|
| Schmidt | 0.6758 | 0.000e+00 | 0.000e+00 | 4.235e-02 | 0.000e+00 |
|---|
| VanDeVijver | 0.7911 | 0.000e+00 | 0.000e+00 | 3.425e-03 | 0.000e+00 |
|---|
| Wang | 0.2635 | 2.426e-03 | 4.146e-02 | 3.852e-01 | 3.875e-05 |
|---|
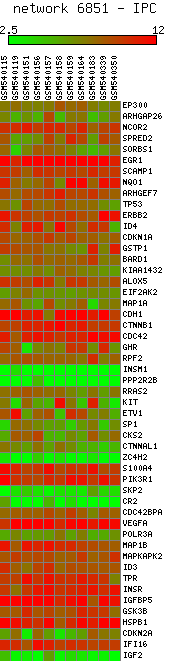
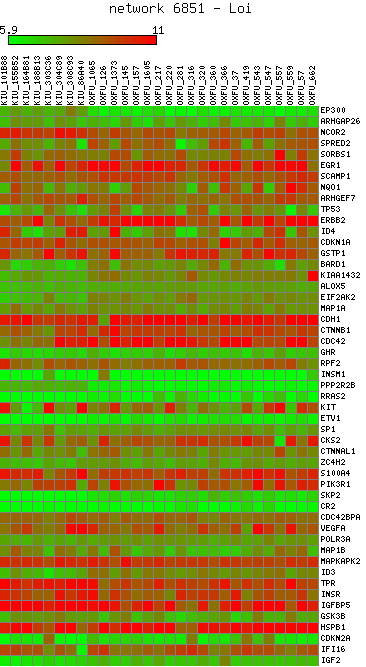
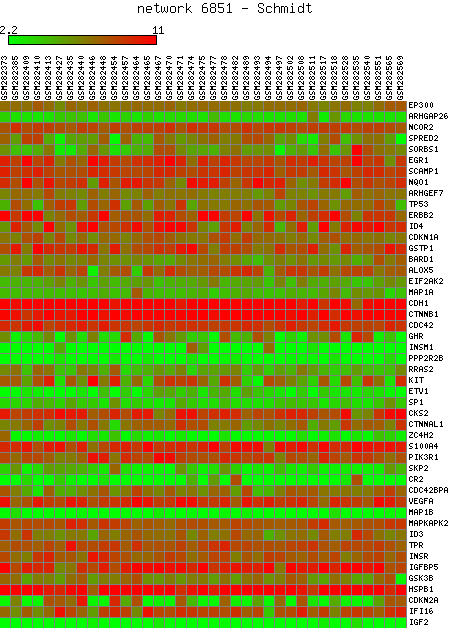
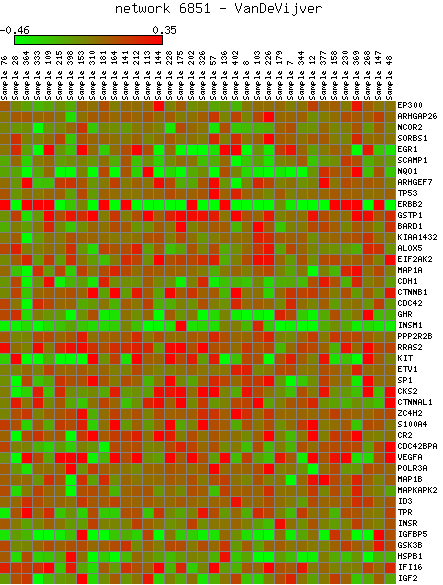
Expression data for subnetwork 6851 in each dataset
IPC |
Loi |
Schmidt |
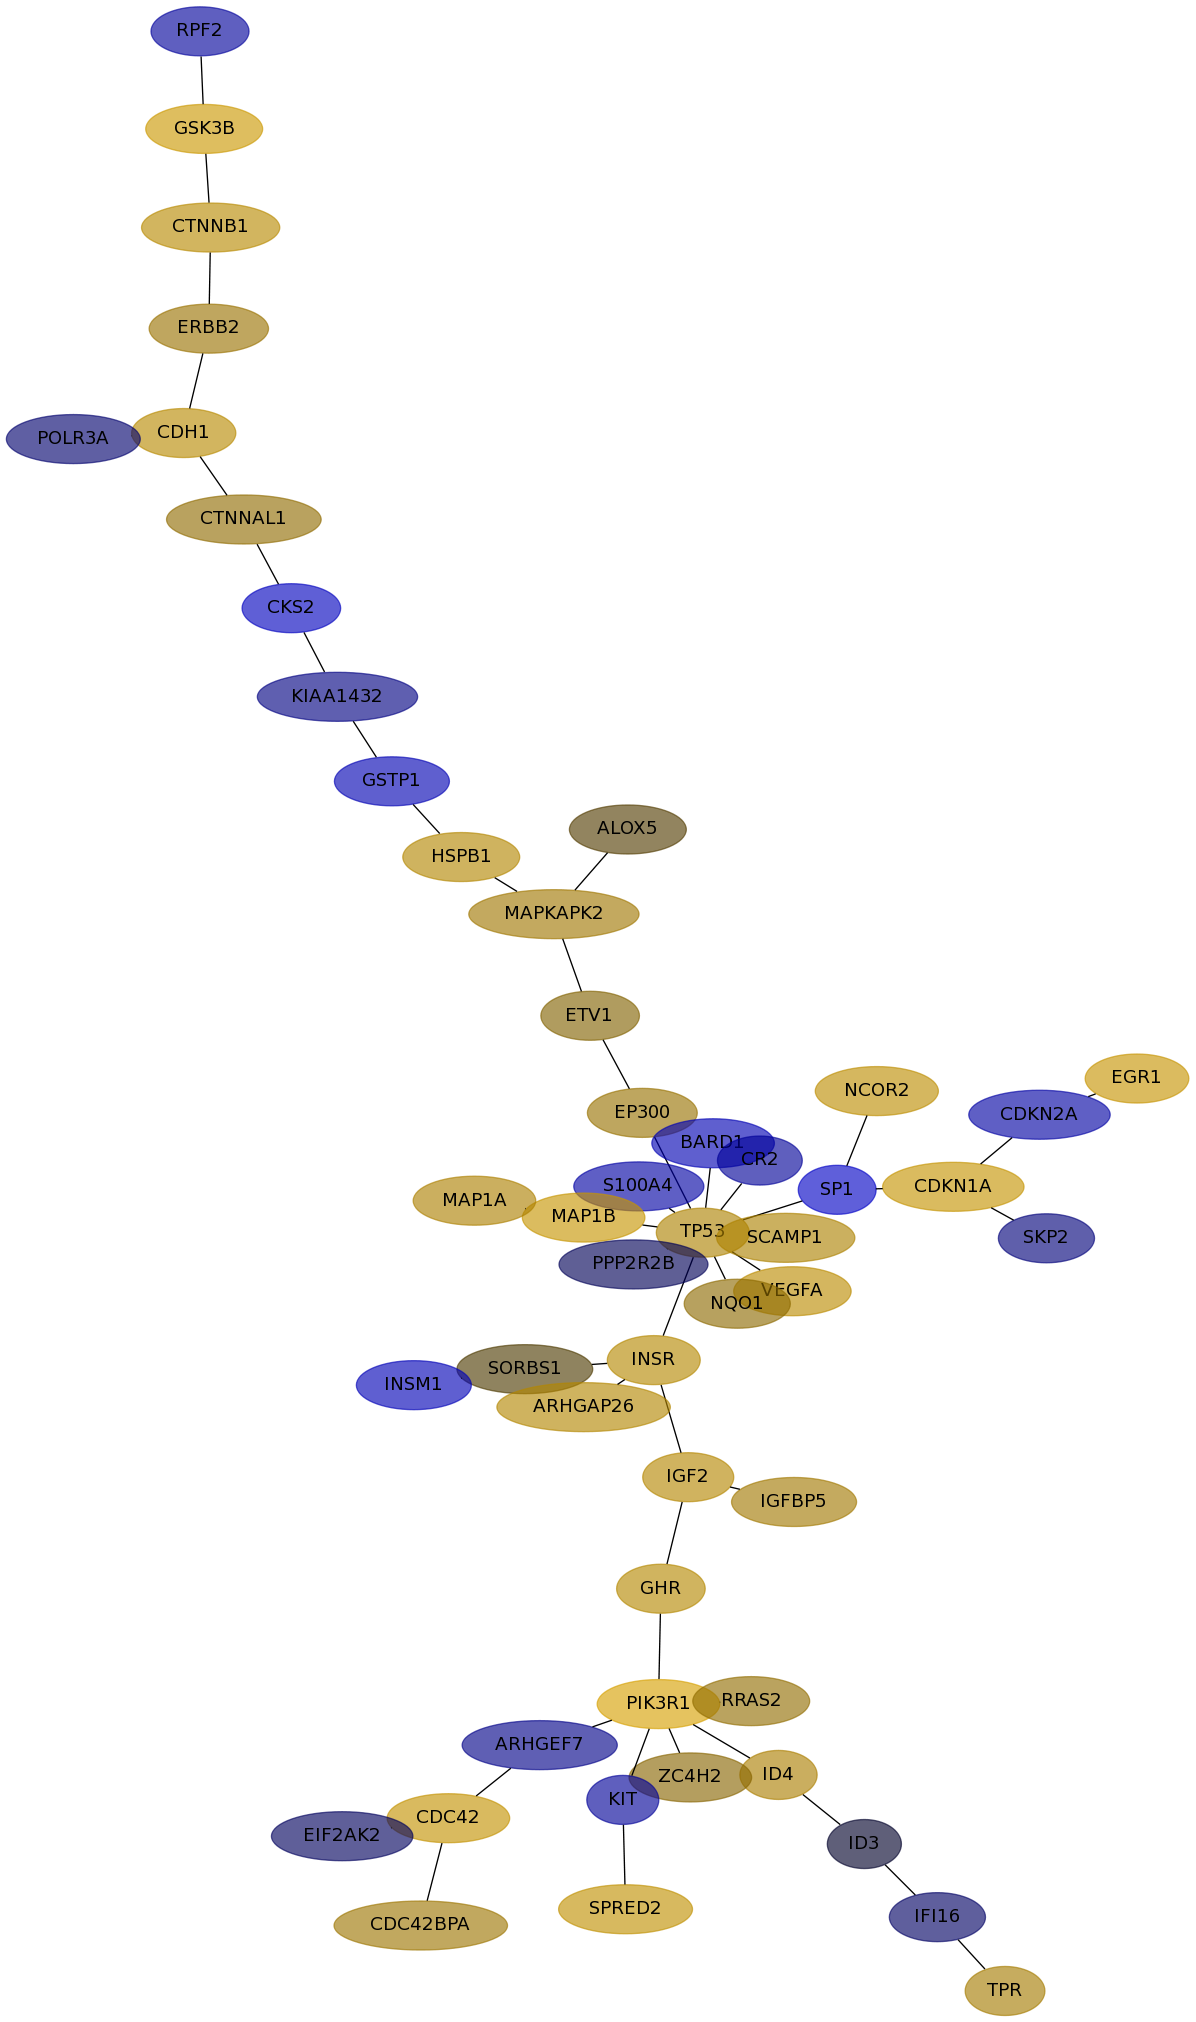
VanDeVijver |
Wang |
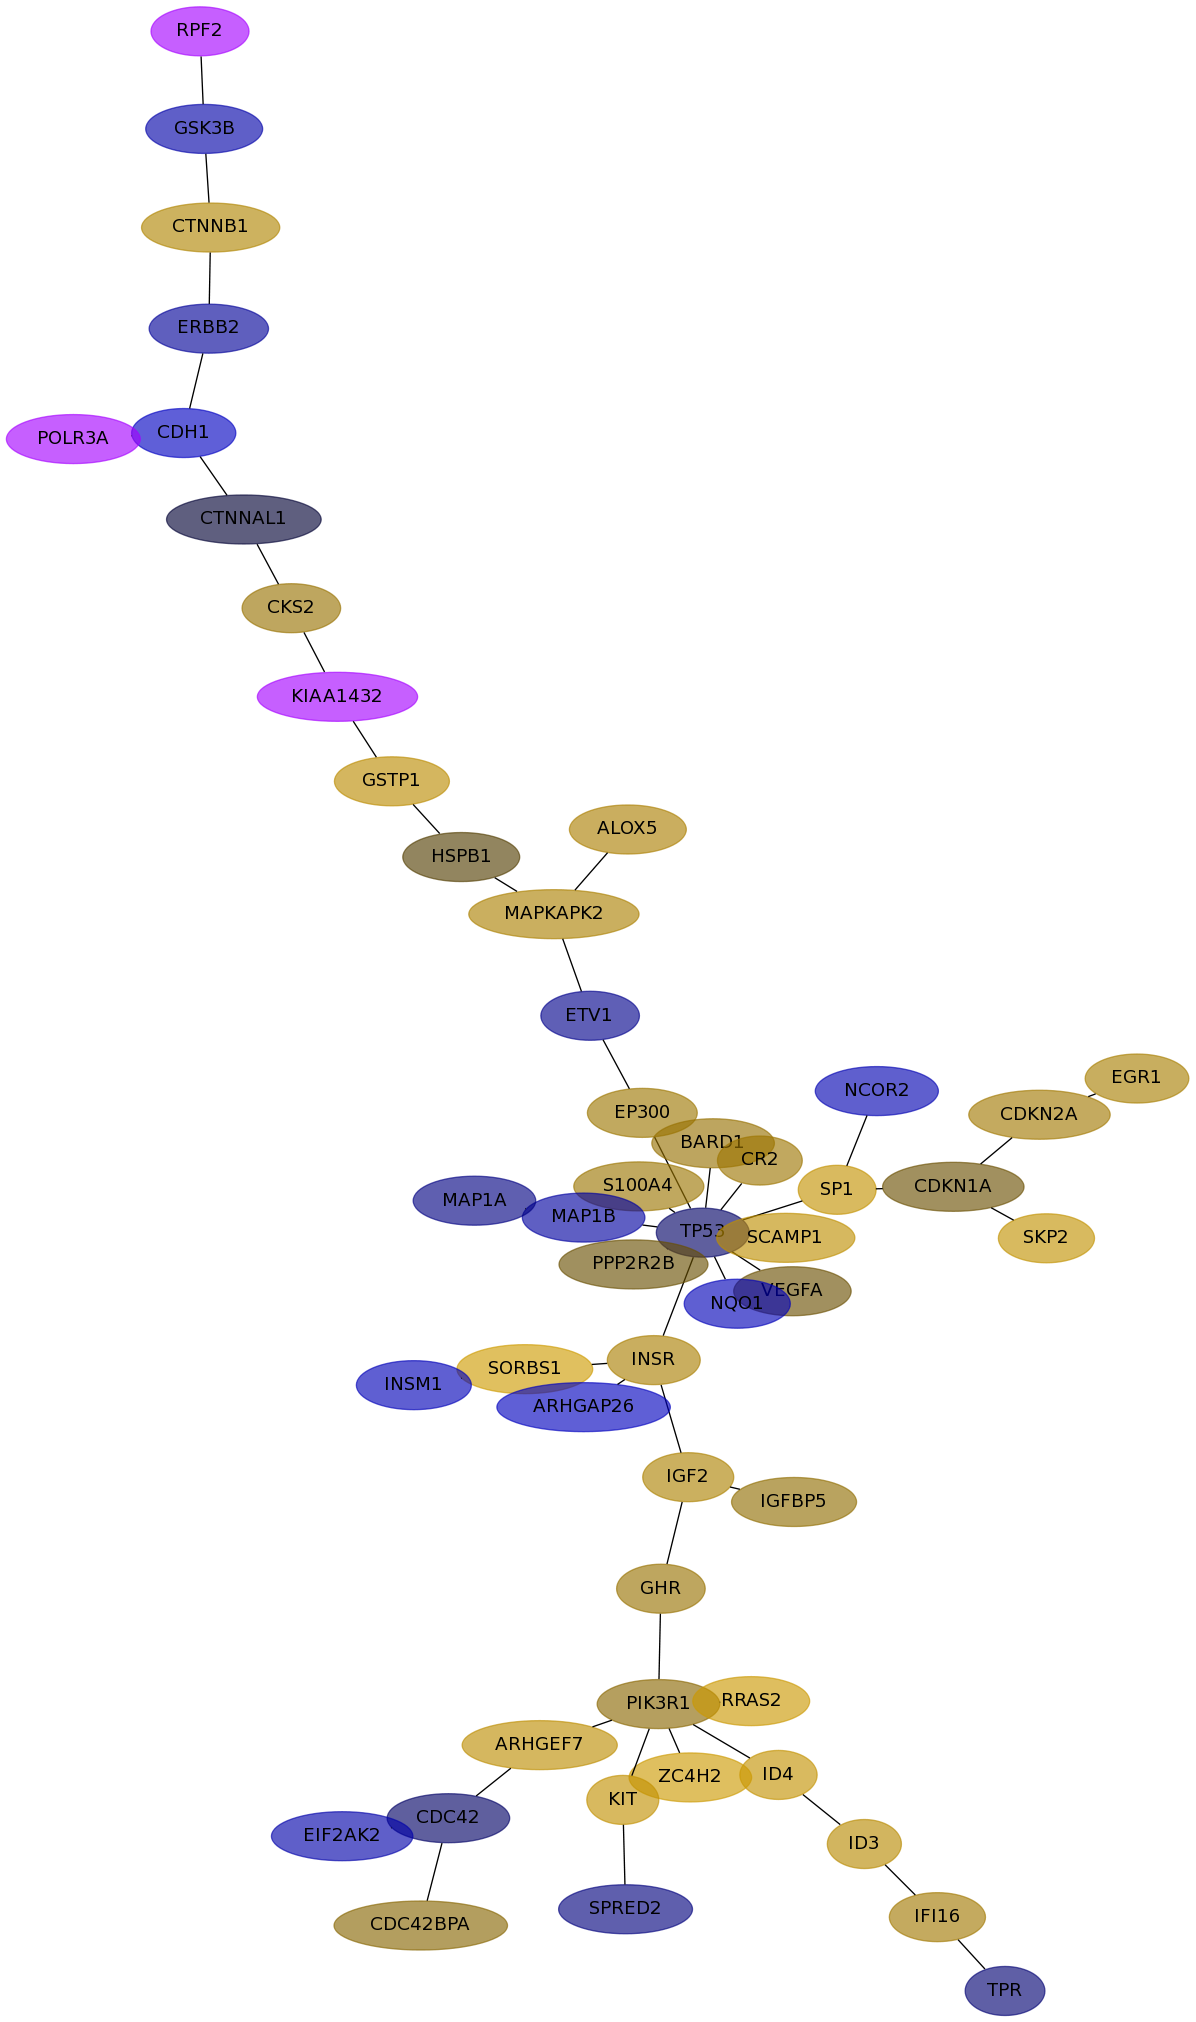
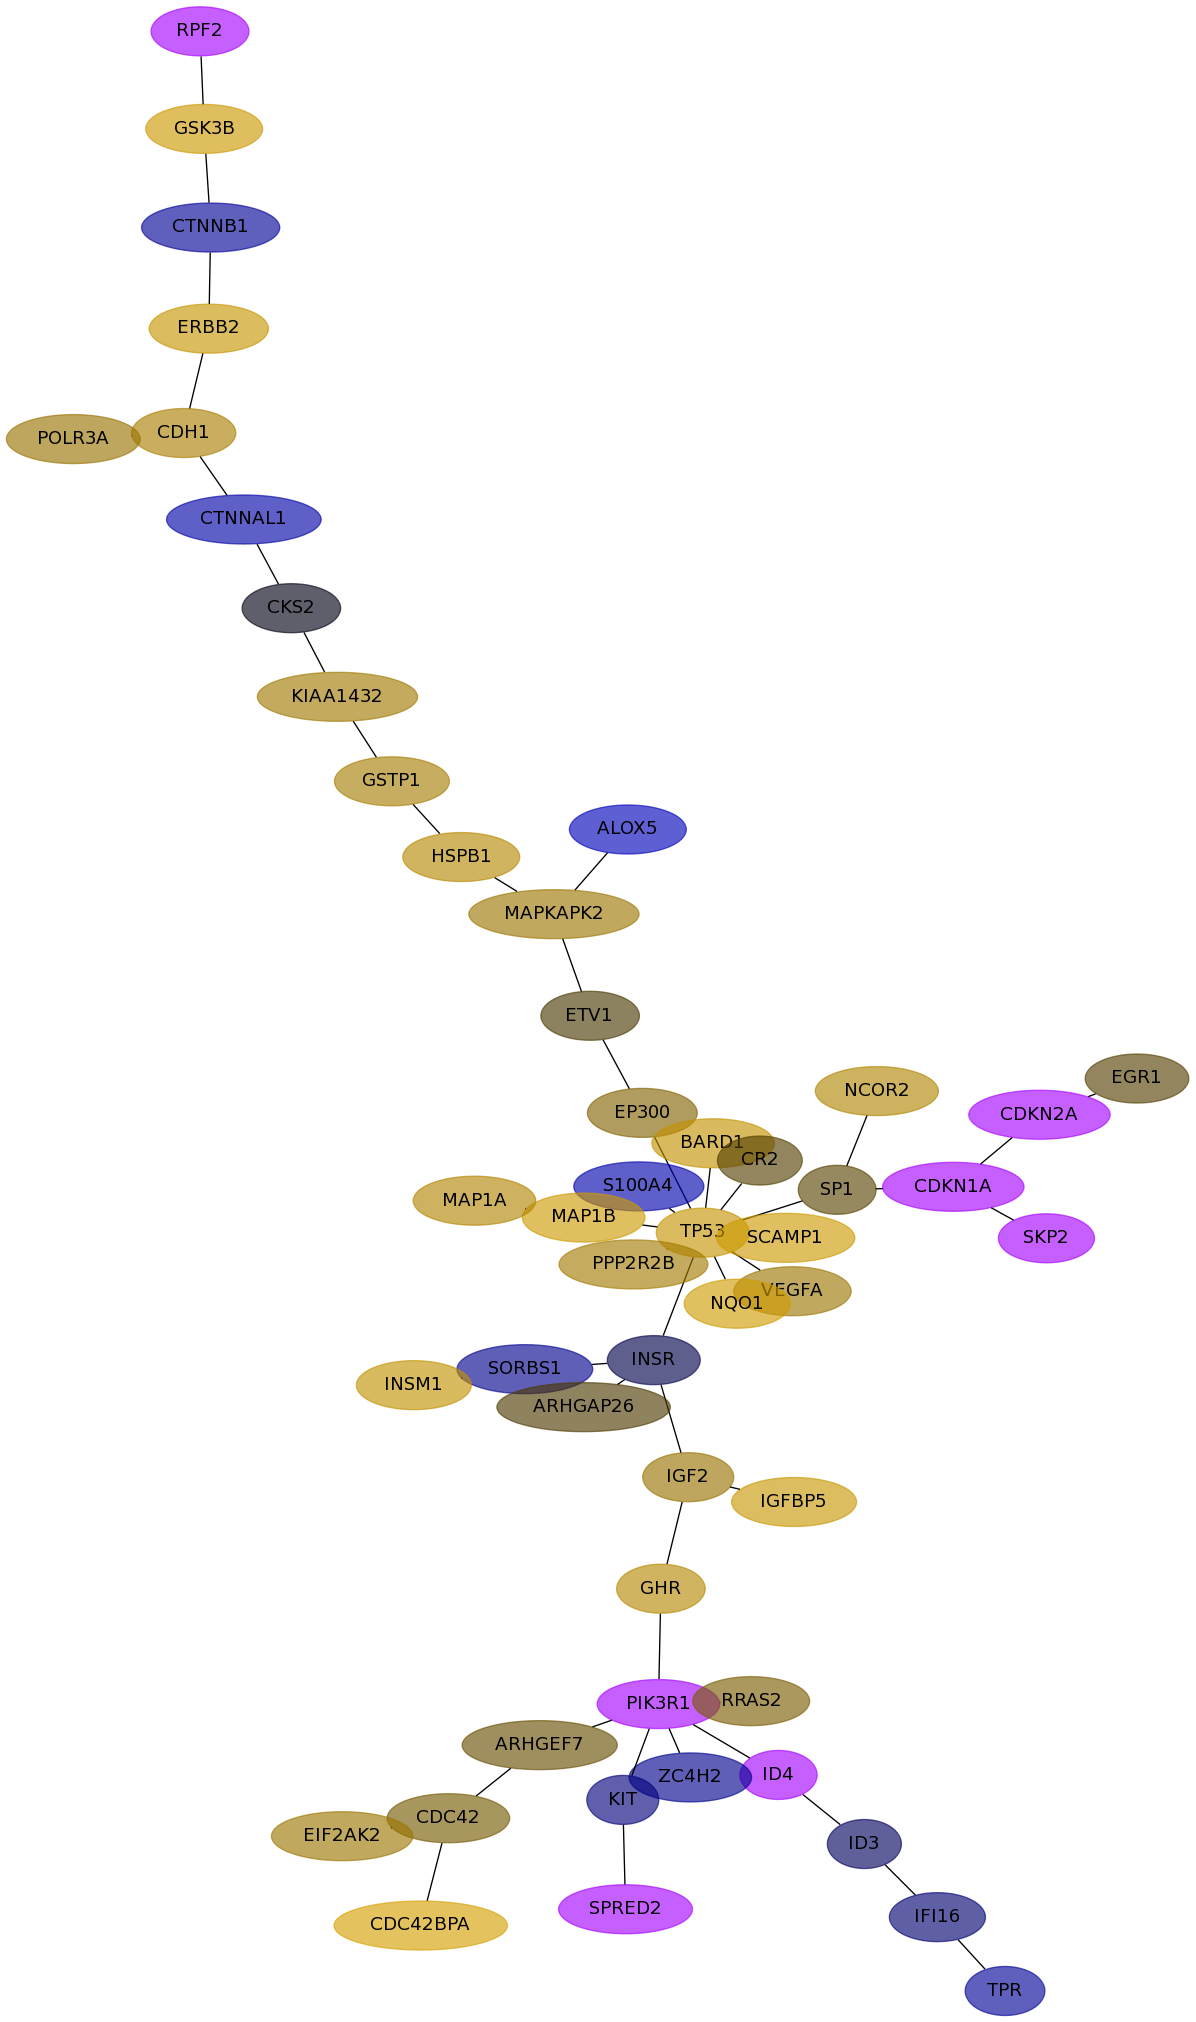
Subnetwork structure for each dataset
- IPC
Score for each gene in subnetwork 6851 in each dataset
| Gene Symbol | Links | Frequency | Frequency Rank | Subnetwork score rank | Global rank |
IPC | Loi | Schmidt | VanDeVijver | Wang |
|---|
| EP300 |   | 113 | 4 | 1 | 4 | -0.149 | 0.087 | 0.102 | 0.052 | 0.025 |
|---|
| ARHGAP26 | | 21 | 73 | 457 | 438 | -0.023 | 0.171 | -0.222 | 0.015 | -0.348 |
|---|
| NCOR2 | | 32 | 40 | 318 | 290 | -0.096 | 0.211 | -0.163 | 0.158 | 0.114 |
|---|
| SPRED2 | | 2 | 743 | 1413 | 1410 | -0.151 | 0.224 | -0.047 | undef | 0.026 |
|---|
| SORBS1 | | 57 | 19 | 1 | 13 | -0.043 | 0.015 | 0.314 | -0.072 | 0.200 |
|---|
| EGR1 | | 39 | 29 | 1 | 18 | -0.184 | 0.259 | 0.130 | 0.018 | 0.122 |
|---|
| SCAMP1 | | 1 | 1195 | 1681 | 1697 | 0.240 | 0.146 | 0.216 | 0.308 | 0.065 |
|---|
| NQO1 | | 21 | 73 | 366 | 354 | -0.115 | 0.069 | -0.189 | 0.321 | 0.118 |
|---|
| ARHGEF7 | | 25 | 59 | 83 | 92 | -0.074 | -0.061 | 0.208 | 0.028 | 0.015 |
|---|
| TP53 | | 85 | 7 | 1 | 6 | -0.167 | 0.148 | -0.027 | 0.252 | 0.147 |
|---|
| ERBB2 | | 141 | 1 | 1 | 1 | -0.103 | 0.092 | -0.090 | 0.267 | 0.046 |
|---|
| ID4 | | 35 | 34 | 236 | 223 | -0.179 | 0.137 | 0.241 | undef | 0.036 |
|---|
| CDKN1A | | 110 | 5 | 1 | 5 | 0.064 | 0.254 | 0.030 | undef | 0.082 |
|---|
| GSTP1 | | 14 | 117 | 1 | 34 | 0.222 | -0.166 | 0.201 | 0.126 | -0.136 |
|---|
| BARD1 | | 69 | 12 | 141 | 132 | 0.179 | -0.165 | 0.086 | 0.245 | -0.104 |
|---|
| KIAA1432 | | 3 | 557 | 1681 | 1657 | -0.132 | -0.054 | undef | 0.108 | undef |
|---|
| ALOX5 | | 2 | 743 | 1681 | 1665 | 0.115 | 0.016 | 0.137 | -0.198 | 0.037 |
|---|
| EIF2AK2 | | 9 | 196 | 648 | 629 | 0.023 | -0.022 | -0.134 | 0.096 | -0.303 |
|---|
| MAP1A | | 12 | 140 | 1 | 36 | -0.045 | 0.143 | -0.054 | 0.162 | 0.147 |
|---|
| CDH1 | | 37 | 32 | 296 | 278 | -0.227 | 0.187 | -0.236 | 0.137 | -0.024 |
|---|
| CTNNB1 | | 43 | 25 | 83 | 81 | -0.113 | 0.187 | 0.159 | -0.090 | 0.239 |
|---|
| CDC42 | | 26 | 52 | 179 | 177 | 0.047 | 0.242 | -0.027 | 0.040 | -0.042 |
|---|
| GHR | | 35 | 34 | 83 | 83 | -0.112 | 0.174 | 0.090 | 0.176 | 0.201 |
|---|
| RPF2 | | 1 | 1195 | 1681 | 1697 | 0.211 | -0.095 | undef | undef | undef |
|---|
| INSM1 | | 23 | 66 | 570 | 545 | 0.135 | -0.184 | -0.188 | 0.237 | -0.032 |
|---|
| PPP2R2B | | 39 | 29 | 179 | 173 | 0.124 | -0.019 | 0.029 | 0.116 | -0.073 |
|---|
| RRAS2 | | 7 | 256 | 1681 | 1633 | 0.155 | 0.076 | 0.289 | 0.044 | 0.031 |
|---|
| KIT | | 39 | 29 | 1 | 18 | -0.130 | -0.091 | 0.235 | -0.046 | -0.059 |
|---|
| ETV1 | | 10 | 167 | 1 | 40 | 0.046 | 0.054 | -0.065 | 0.014 | 0.141 |
|---|
| SP1 | | 72 | 10 | 83 | 77 | 0.222 | -0.254 | 0.239 | 0.020 | 0.082 |
|---|
| CKS2 | | 9 | 196 | 928 | 903 | 0.214 | -0.220 | 0.089 | -0.003 | -0.056 |
|---|
| CTNNAL1 | | 4 | 440 | 682 | 678 | -0.014 | 0.073 | -0.008 | -0.131 | 0.004 |
|---|
| ZC4H2 | | 17 | 95 | 570 | 546 | 0.065 | 0.061 | 0.304 | -0.072 | 0.059 |
|---|
| S100A4 | | 2 | 743 | 913 | 914 | 0.163 | -0.116 | 0.096 | -0.146 | 0.148 |
|---|
| PIK3R1 | | 127 | 2 | 1 | 2 | -0.237 | 0.381 | 0.065 | undef | -0.002 |
|---|
| SKP2 | | 29 | 45 | 1 | 23 | 0.092 | -0.043 | 0.237 | undef | -0.009 |
|---|
| CR2 | | 5 | 360 | 957 | 938 | -0.042 | -0.089 | 0.101 | 0.018 | 0.015 |
|---|
| CDC42BPA | | 6 | 301 | 1268 | 1236 | -0.102 | 0.098 | 0.059 | 0.368 | 0.260 |
|---|
| VEGFA | | 68 | 14 | 83 | 78 | 0.090 | 0.200 | 0.030 | 0.095 | 0.148 |
|---|
| POLR3A | | 8 | 222 | 296 | 287 | -0.010 | -0.032 | undef | 0.091 | undef |
|---|
| MAP1B | | 69 | 12 | 1 | 9 | -0.123 | 0.263 | -0.107 | 0.304 | 0.100 |
|---|
| MAPKAPK2 | | 3 | 557 | 1681 | 1657 | 0.149 | 0.107 | 0.141 | 0.096 | 0.009 |
|---|
| ID3 | | 9 | 196 | 658 | 637 | 0.072 | -0.006 | 0.192 | -0.023 | 0.057 |
|---|
| TPR | | 11 | 148 | 727 | 701 | -0.130 | 0.120 | -0.036 | -0.085 | 0.156 |
|---|
| INSR | | 96 | 6 | 236 | 221 | 0.063 | 0.173 | 0.135 | -0.014 | -0.072 |
|---|
| IGFBP5 | | 48 | 23 | 83 | 80 | -0.076 | 0.110 | 0.074 | 0.278 | 0.181 |
|---|
| GSK3B | | 79 | 8 | 179 | 169 | -0.130 | 0.292 | -0.129 | 0.291 | 0.057 |
|---|
| HSPB1 | | 22 | 69 | 1 | 25 | 0.053 | 0.169 | 0.017 | 0.179 | 0.161 |
|---|
| CDKN2A | | 60 | 17 | 1 | 11 | 0.263 | -0.113 | 0.111 | undef | -0.105 |
|---|
| IFI16 | | 2 | 743 | 1681 | 1665 | 0.134 | -0.026 | 0.110 | -0.037 | -0.051 |
|---|
| IGF2 | | 14 | 117 | 570 | 553 | -0.022 | 0.172 | 0.145 | 0.087 | 0.116 |
|---|
GO Enrichment output for subnetwork 6851 in each dataset
| Name | Accession Number | Link | P-val | Corrected P-val |
|---|
| nuclear migration | GO:0007097 |  | 5.457E-09 | 1.333E-05 |
|---|
| establishment of nucleus localization | GO:0040023 | | 2.529E-08 | 3.089E-05 |
|---|
| insulin receptor signaling pathway | GO:0008286 | | 1.177E-07 | 9.585E-05 |
|---|
| Wnt receptor signaling pathway through beta-catenin | GO:0060070 | | 1.18E-07 | 7.207E-05 |
|---|
| nucleus localization | GO:0051647 | | 1.18E-07 | 5.766E-05 |
|---|
| epithelial to mesenchymal transition | GO:0001837 | | 4.814E-07 | 1.96E-04 |
|---|
| cellular response to insulin stimulus | GO:0032869 | | 7.037E-07 | 2.456E-04 |
|---|
| positive regulation of pseudopodium assembly | GO:0031274 | | 1.674E-06 | 5.113E-04 |
|---|
| G1/S transition of mitotic cell cycle | GO:0000082 | | 1.868E-06 | 5.07E-04 |
|---|
| response to insulin stimulus | GO:0032868 | | 2.083E-06 | 5.088E-04 |
|---|
| cellular response to hormone stimulus | GO:0032870 | | 2.213E-06 | 4.914E-04 |
|---|
| Name | Accession Number | Link | P-val | Corrected P-val |
|---|
| nuclear migration | GO:0007097 | | 6.661E-09 | 1.603E-05 |
|---|
| establishment of nucleus localization | GO:0040023 | | 3.086E-08 | 3.712E-05 |
|---|
| Wnt receptor signaling pathway through beta-catenin | GO:0060070 | | 9.191E-08 | 7.371E-05 |
|---|
| insulin receptor signaling pathway | GO:0008286 | | 1.228E-07 | 7.389E-05 |
|---|
| nucleus localization | GO:0051647 | | 1.439E-07 | 6.925E-05 |
|---|
| epithelial to mesenchymal transition | GO:0001837 | | 5.867E-07 | 2.353E-04 |
|---|
| cellular response to insulin stimulus | GO:0032869 | | 7.813E-07 | 2.685E-04 |
|---|
| positive regulation of pseudopodium assembly | GO:0031274 | | 1.946E-06 | 5.853E-04 |
|---|
| cellular response to hormone stimulus | GO:0032870 | | 2.373E-06 | 6.344E-04 |
|---|
| G1/S transition of mitotic cell cycle | GO:0000082 | | 2.376E-06 | 5.716E-04 |
|---|
| response to insulin stimulus | GO:0032868 | | 2.376E-06 | 5.196E-04 |
|---|
| Name | Accession Number | Link | P-val | Corrected P-val |
|---|
| nuclear migration | GO:0007097 | | 5.656E-09 | 1.301E-05 |
|---|
| establishment of nucleus localization | GO:0040023 | | 3.924E-08 | 4.512E-05 |
|---|
| nucleus localization | GO:0051647 | | 1.4E-07 | 1.073E-04 |
|---|
| insulin receptor signaling pathway | GO:0008286 | | 2.503E-07 | 1.439E-04 |
|---|
| cellular response to insulin stimulus | GO:0032869 | | 1.564E-06 | 7.194E-04 |
|---|
| positive regulation of pseudopodium assembly | GO:0031274 | | 1.969E-06 | 7.549E-04 |
|---|
| regulation of protein export from nucleus | GO:0046825 | | 3.922E-06 | 1.289E-03 |
|---|
| ER overload response | GO:0006983 | | 3.922E-06 | 1.128E-03 |
|---|
| macrophage differentiation | GO:0030225 | | 3.922E-06 | 1.002E-03 |
|---|
| cellular response to hormone stimulus | GO:0032870 | | 4.837E-06 | 1.113E-03 |
|---|
| G1/S transition of mitotic cell cycle | GO:0000082 | | 5.188E-06 | 1.085E-03 |
|---|
VanDeVijver file
| Name | Accession Number | Link | P-val | Corrected P-val |
|---|
| response to endoplasmic reticulum stress | GO:0034976 | | 4.89E-07 | 9.013E-04 |
|---|
| peptidyl-amino acid modification | GO:0018193 | | 5.803E-07 | 5.347E-04 |
|---|
| insulin receptor signaling pathway | GO:0008286 | | 9.265E-07 | 5.692E-04 |
|---|
| ER-nuclear signaling pathway | GO:0006984 | | 9.265E-07 | 4.269E-04 |
|---|
| nucleus localization | GO:0051647 | | 1.422E-06 | 5.24E-04 |
|---|
| peptidyl-tyrosine phosphorylation | GO:0018108 | | 2.591E-06 | 7.958E-04 |
|---|
| ER overload response | GO:0006983 | | 2.833E-06 | 7.458E-04 |
|---|
| peptidyl-tyrosine modification | GO:0018212 | | 3.226E-06 | 7.432E-04 |
|---|
| cellular response to insulin stimulus | GO:0032869 | | 3.97E-06 | 8.129E-04 |
|---|
| cellular response to hormone stimulus | GO:0032870 | | 3.972E-06 | 7.32E-04 |
|---|
| leukocyte differentiation | GO:0002521 | | 5.461E-06 | 9.15E-04 |
|---|
| Name | Accession Number | Link | P-val | Corrected P-val |
|---|
| nuclear migration | GO:0007097 | | 5.656E-09 | 1.301E-05 |
|---|
| establishment of nucleus localization | GO:0040023 | | 3.924E-08 | 4.512E-05 |
|---|
| nucleus localization | GO:0051647 | | 1.4E-07 | 1.073E-04 |
|---|
| insulin receptor signaling pathway | GO:0008286 | | 2.503E-07 | 1.439E-04 |
|---|
| cellular response to insulin stimulus | GO:0032869 | | 1.564E-06 | 7.194E-04 |
|---|
| positive regulation of pseudopodium assembly | GO:0031274 | | 1.969E-06 | 7.549E-04 |
|---|
| regulation of protein export from nucleus | GO:0046825 | | 3.922E-06 | 1.289E-03 |
|---|
| ER overload response | GO:0006983 | | 3.922E-06 | 1.128E-03 |
|---|
| macrophage differentiation | GO:0030225 | | 3.922E-06 | 1.002E-03 |
|---|
| cellular response to hormone stimulus | GO:0032870 | | 4.837E-06 | 1.113E-03 |
|---|
| G1/S transition of mitotic cell cycle | GO:0000082 | | 5.188E-06 | 1.085E-03 |
|---|

