Study Desmedt-ER-neg
Study informations
165 subnetworks in total page | file
2310 genes associated page | file
Enriched GO terms page
General informations
General Index page
Study Index page
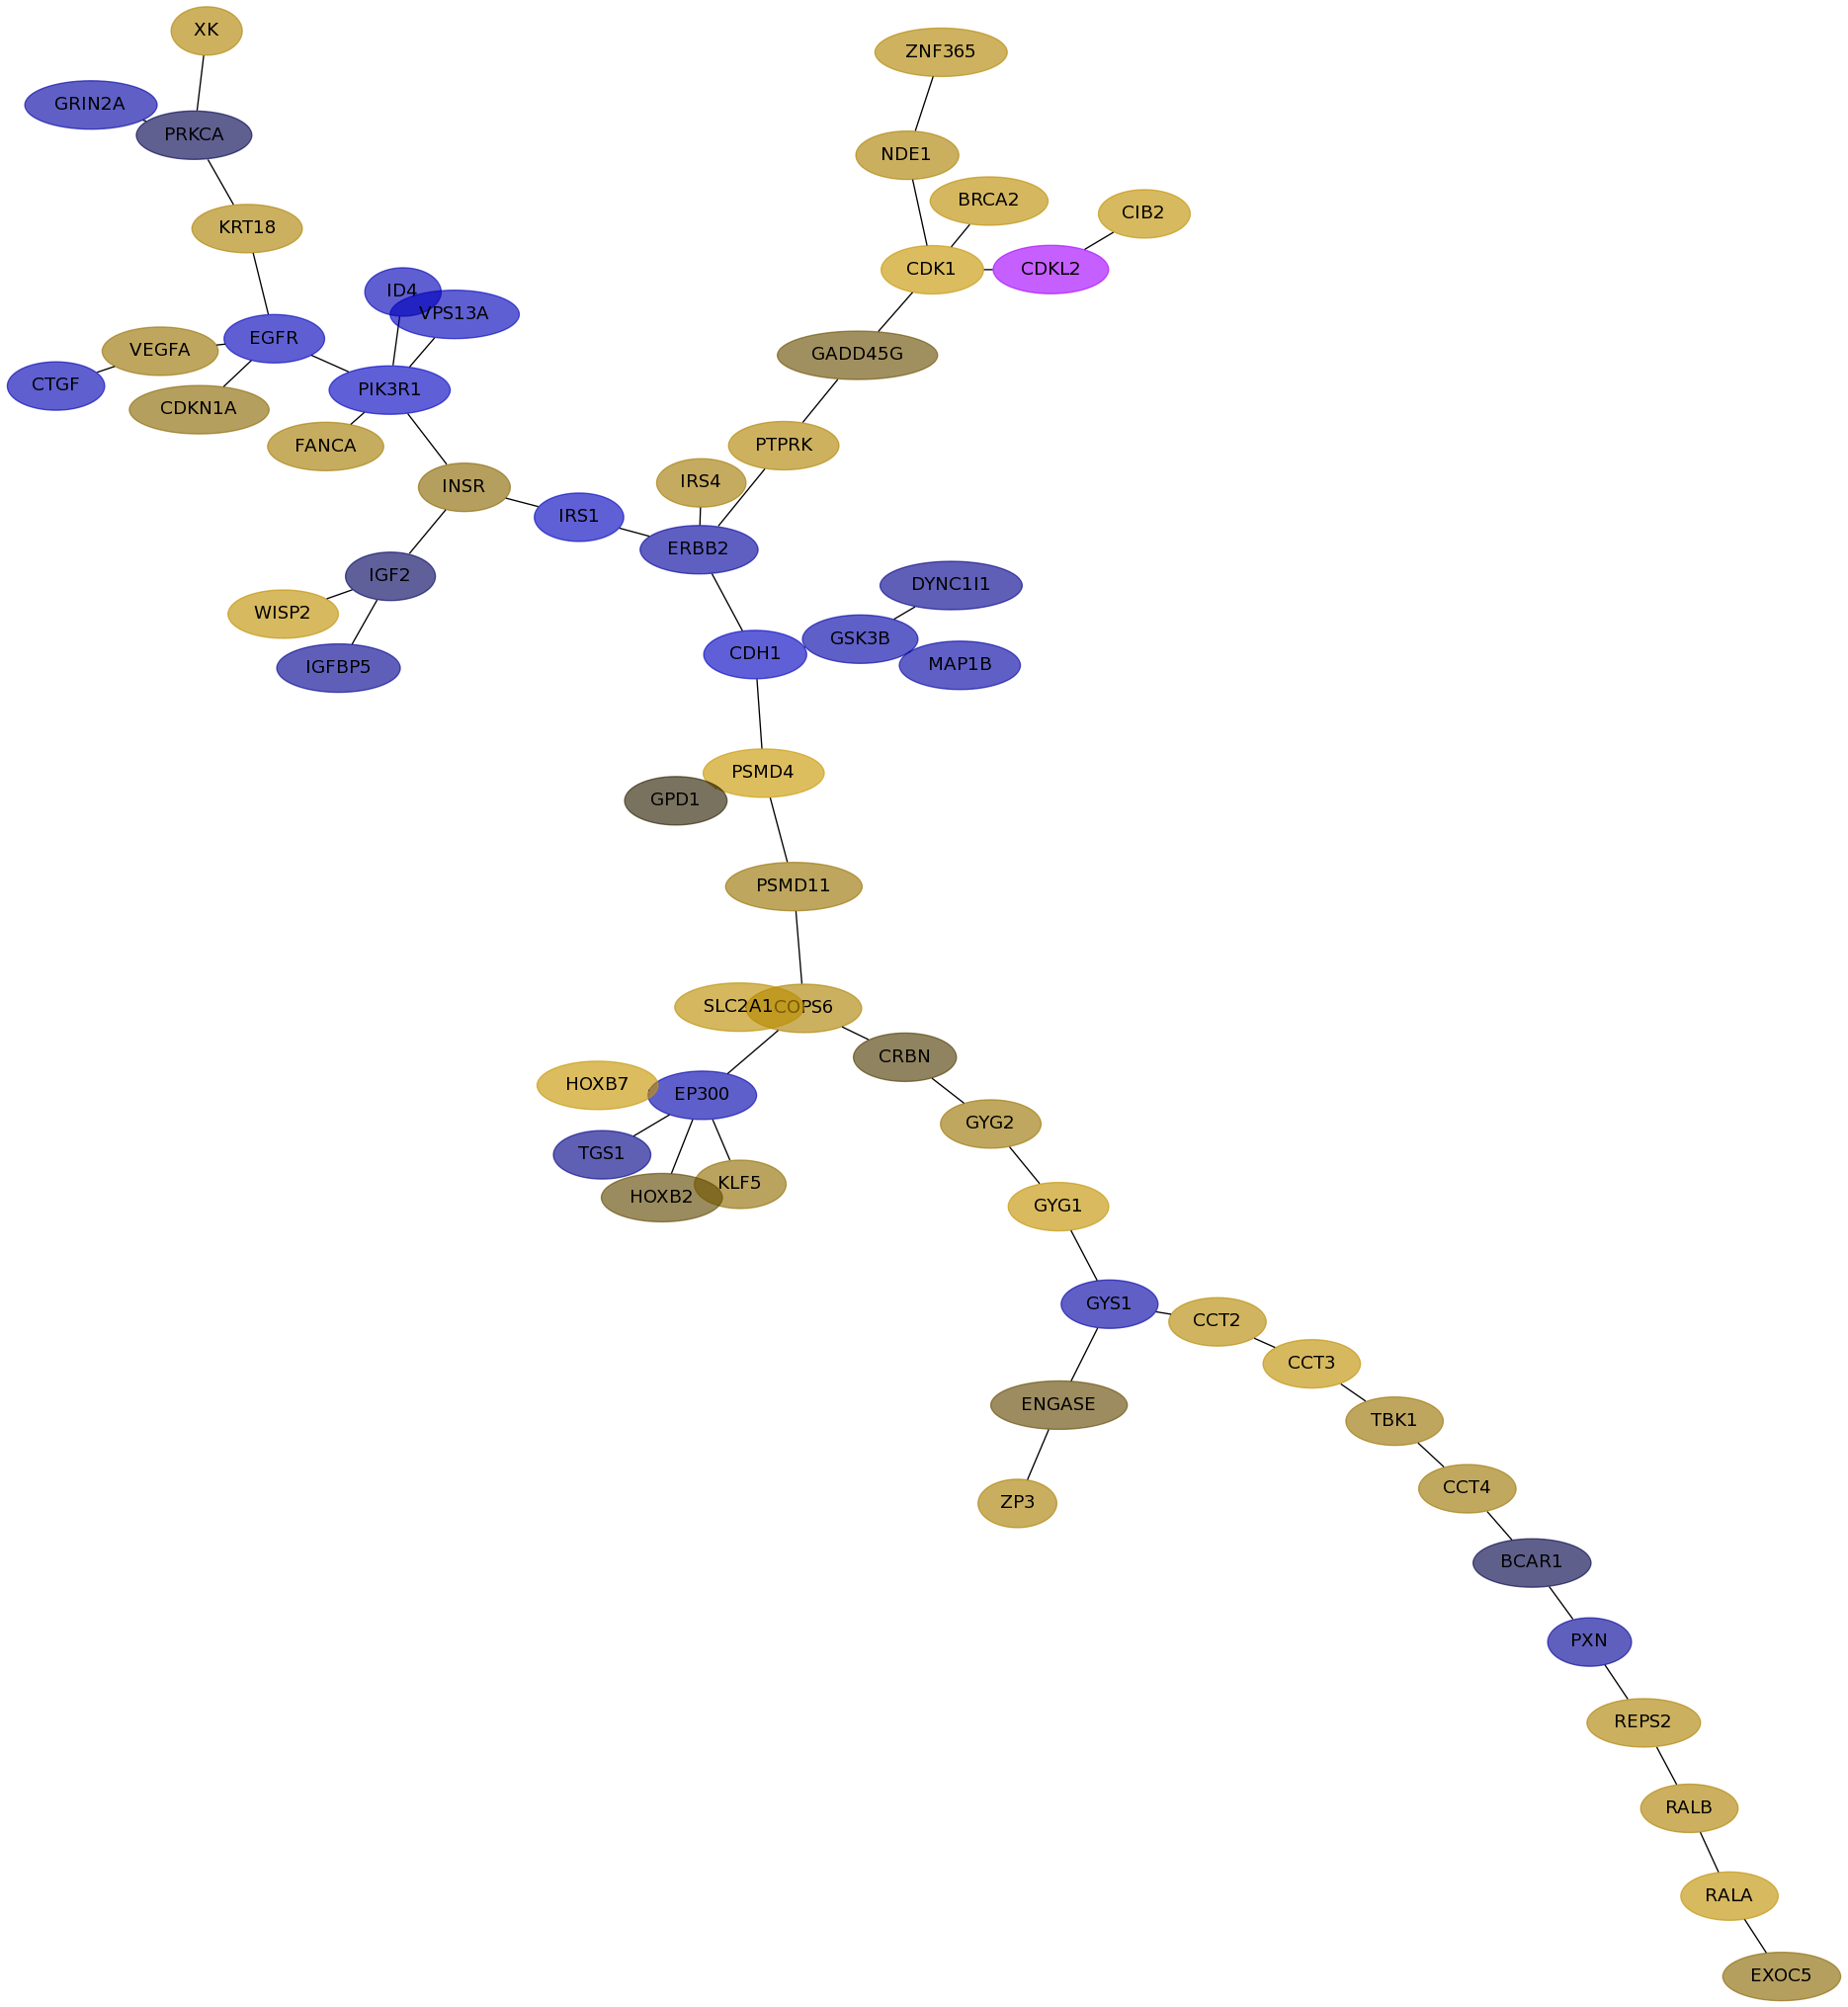
Subnetwork 6798
score
| Dataset | Score | P-val 1 | P-val 2 | P-val 3 | Fisher Score |
|---|
| IPC | 0.7499 | 3.772e-03 | 6.260e-04 | 7.804e-01 | 1.843e-06 |
|---|
| Loi | 0.2308 | 7.946e-02 | 1.115e-02 | 4.263e-01 | 3.776e-04 |
|---|
| Schmidt | 0.6753 | 0.000e+00 | 0.000e+00 | 4.289e-02 | 0.000e+00 |
|---|
| VanDeVijver | 0.7911 | 0.000e+00 | 0.000e+00 | 3.424e-03 | 0.000e+00 |
|---|
| Wang | 0.2633 | 2.450e-03 | 4.170e-02 | 3.863e-01 | 3.946e-05 |
|---|
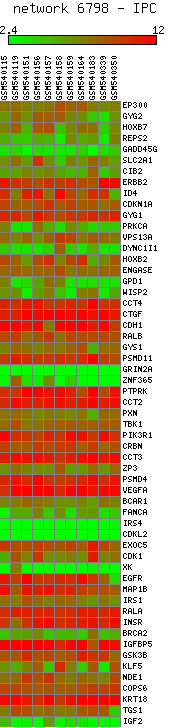
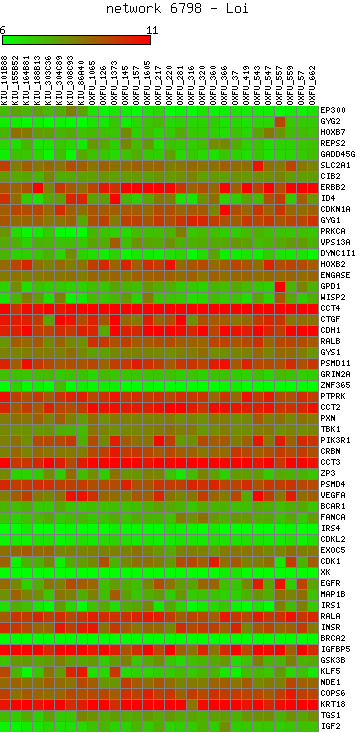
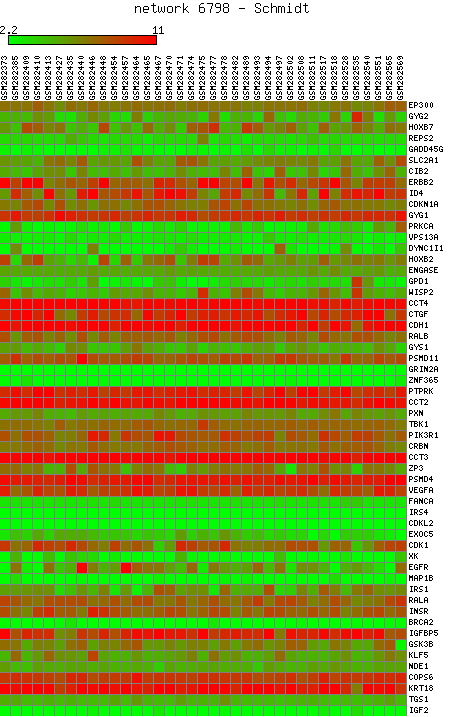
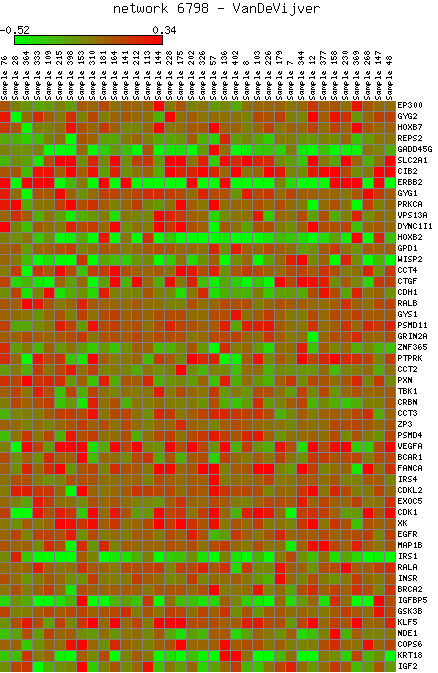
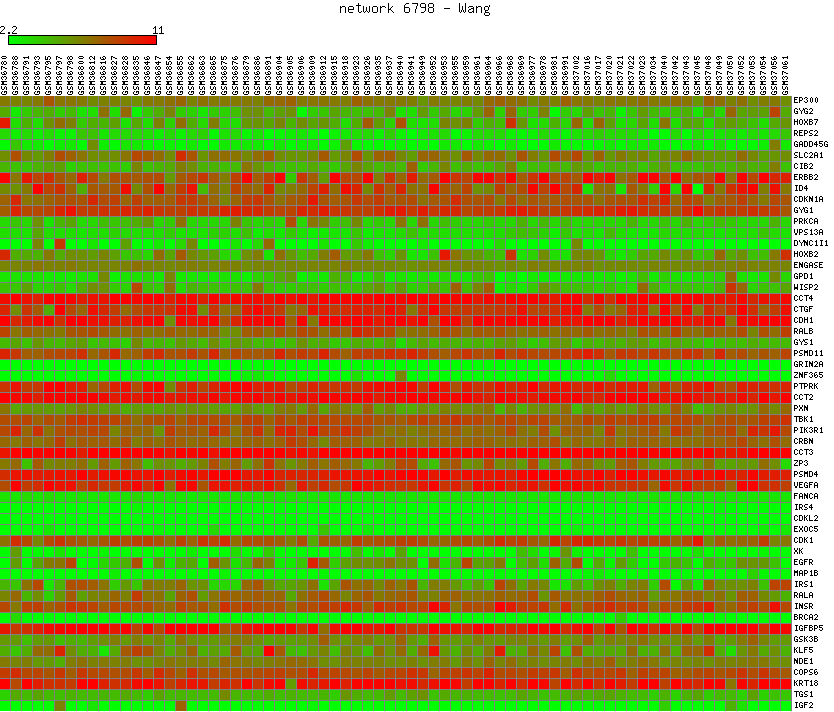
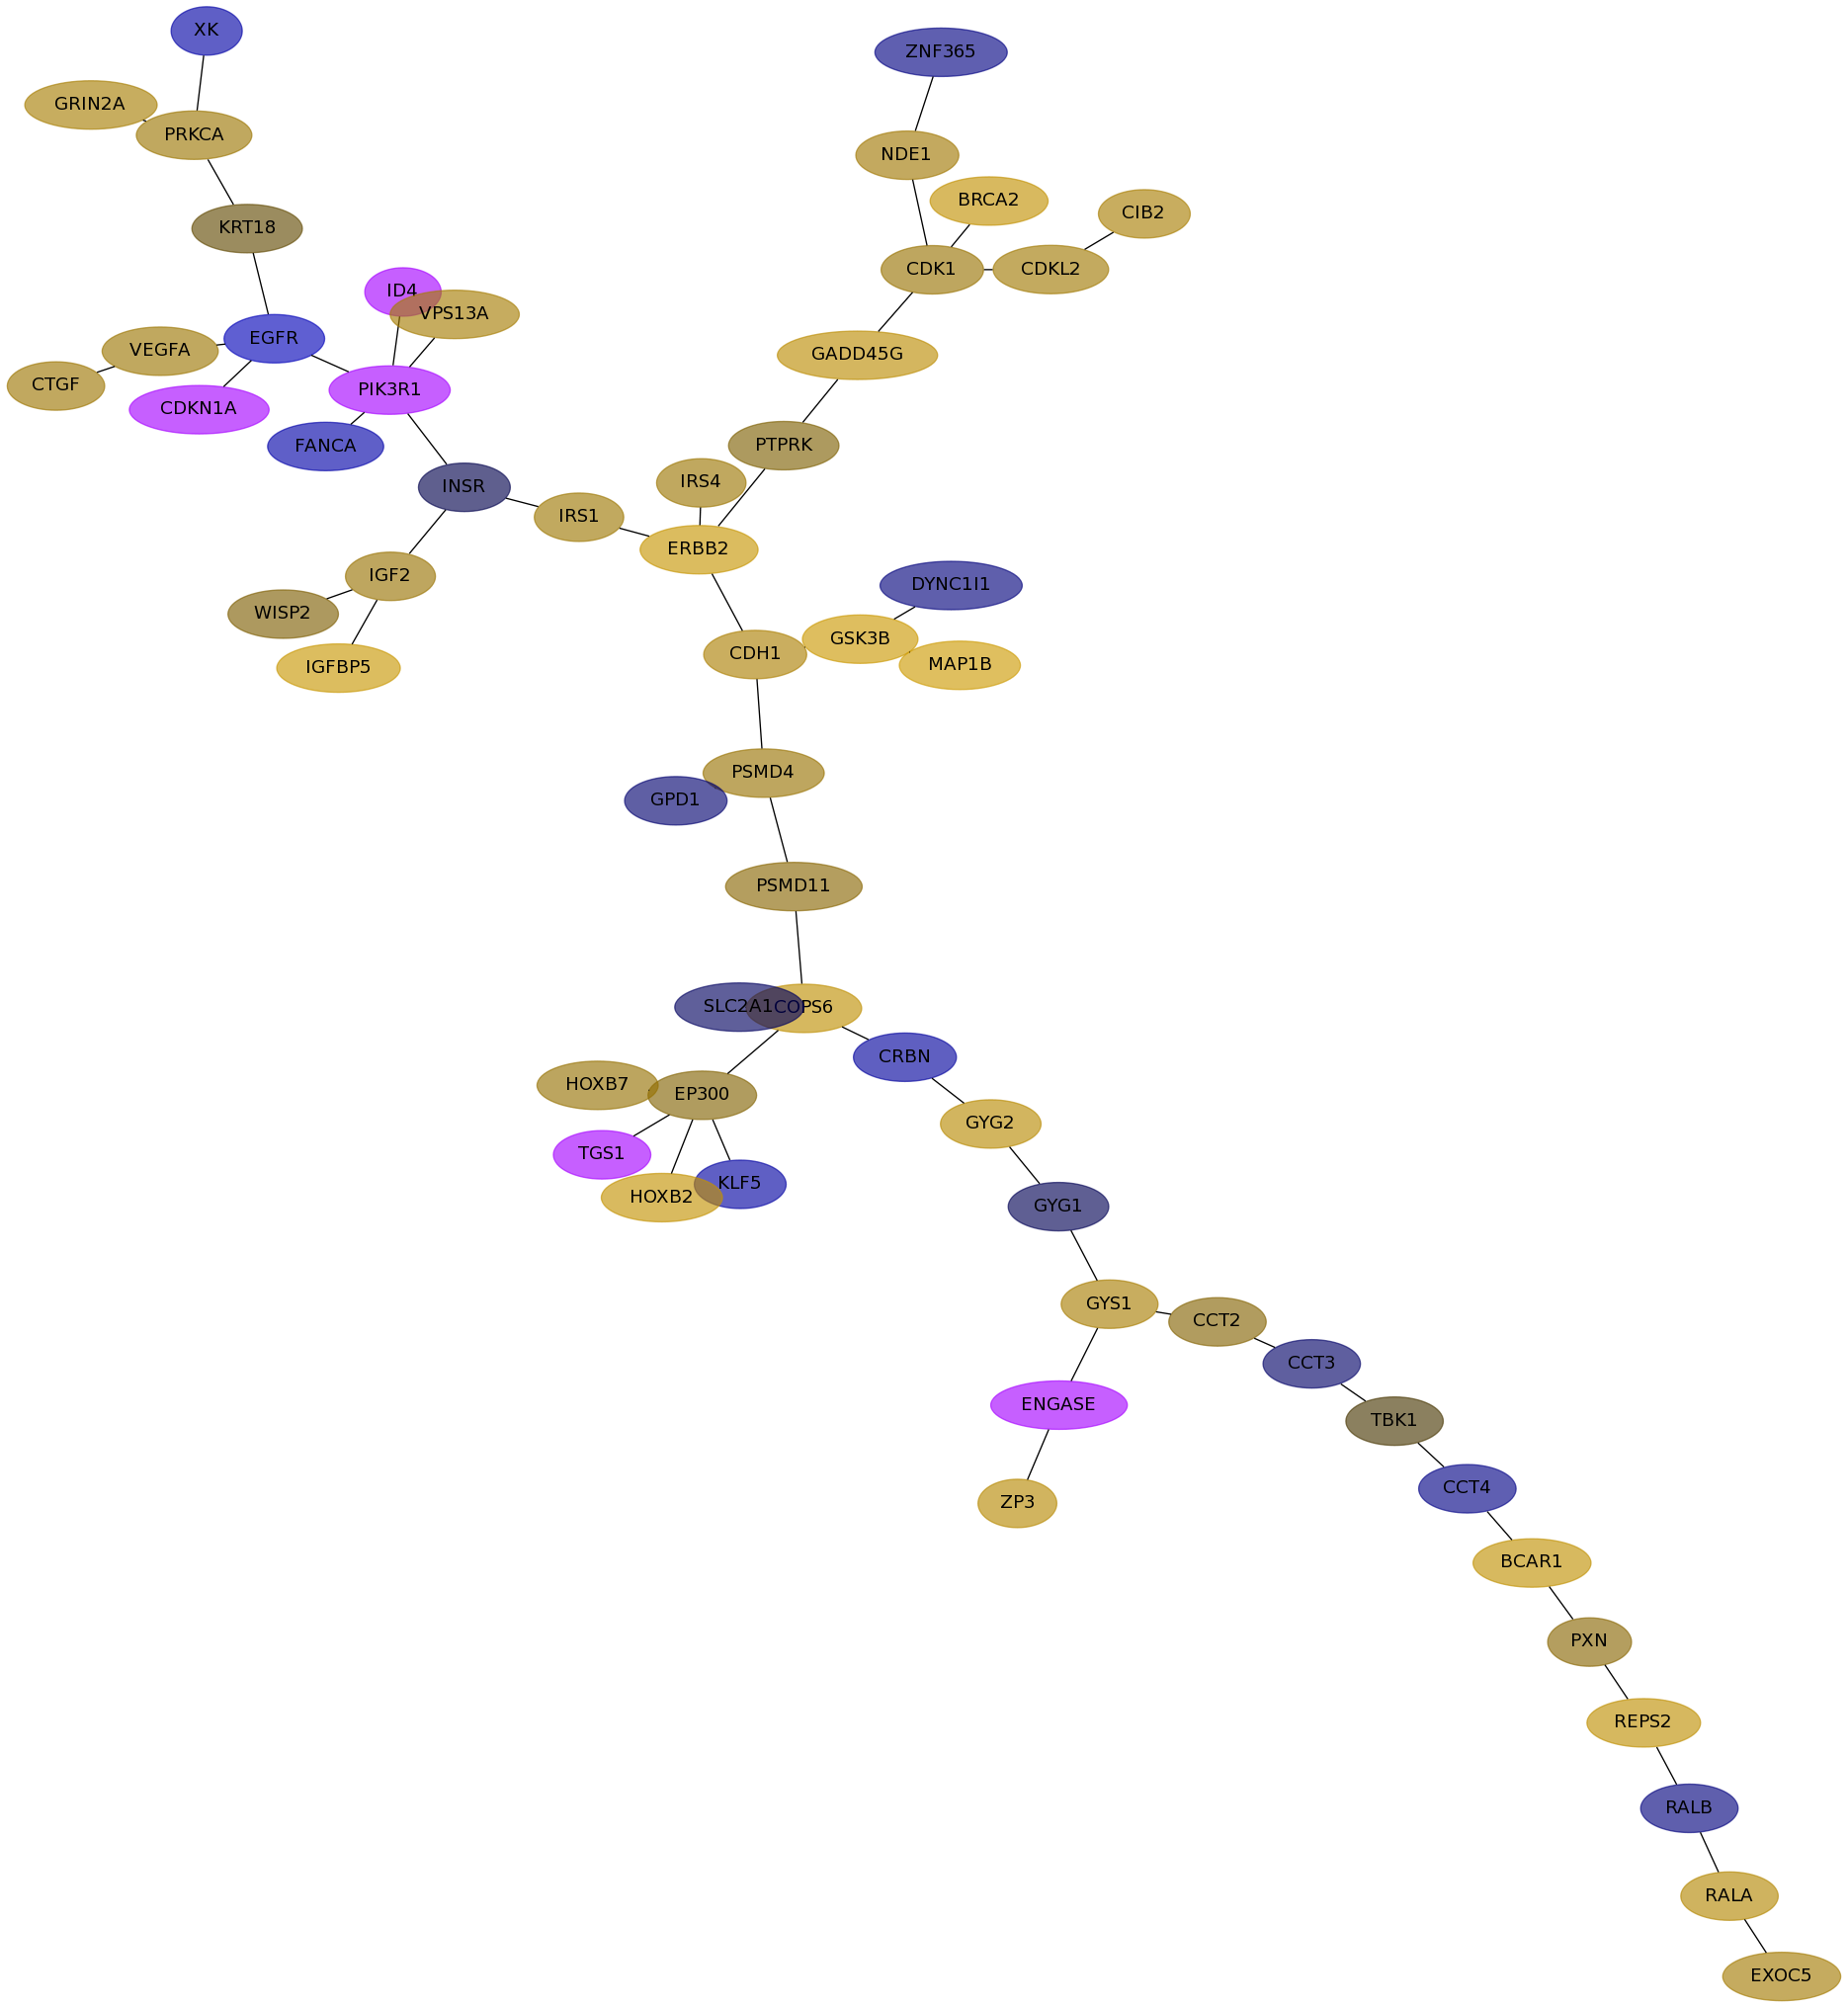
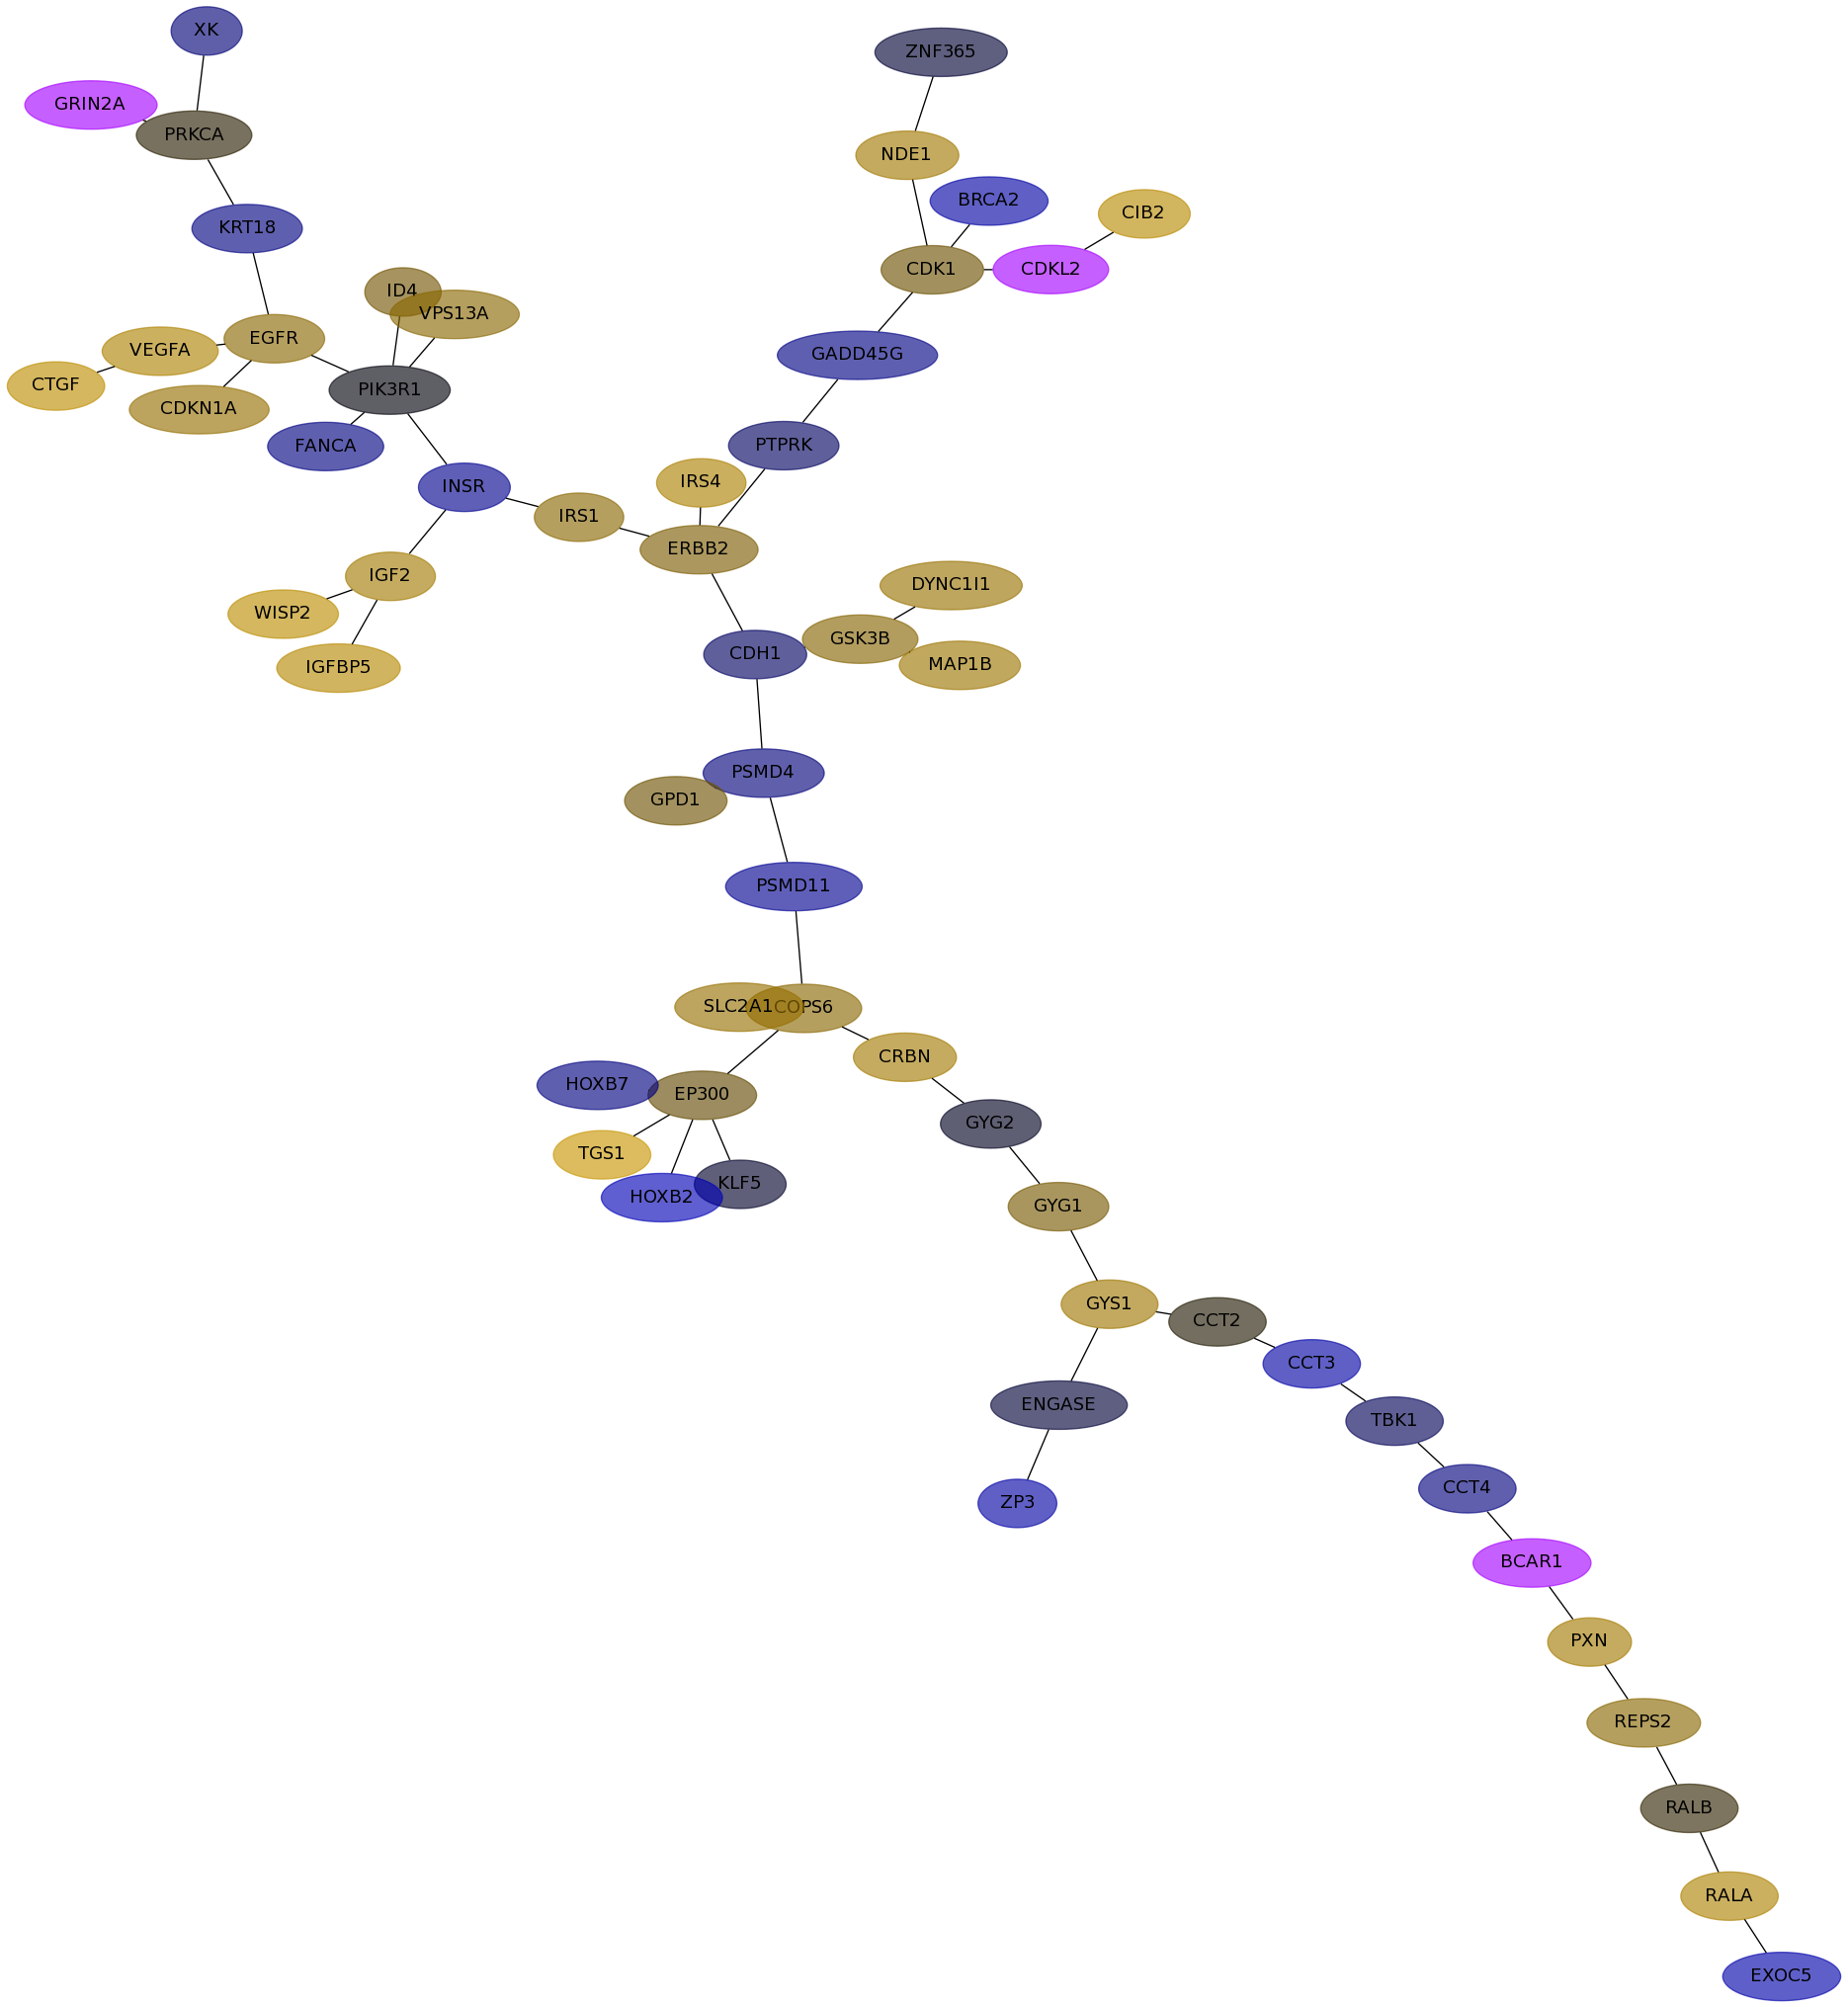
Expression data for subnetwork 6798 in each dataset
IPC |
Loi |
Schmidt |
VanDeVijver |
Wang |
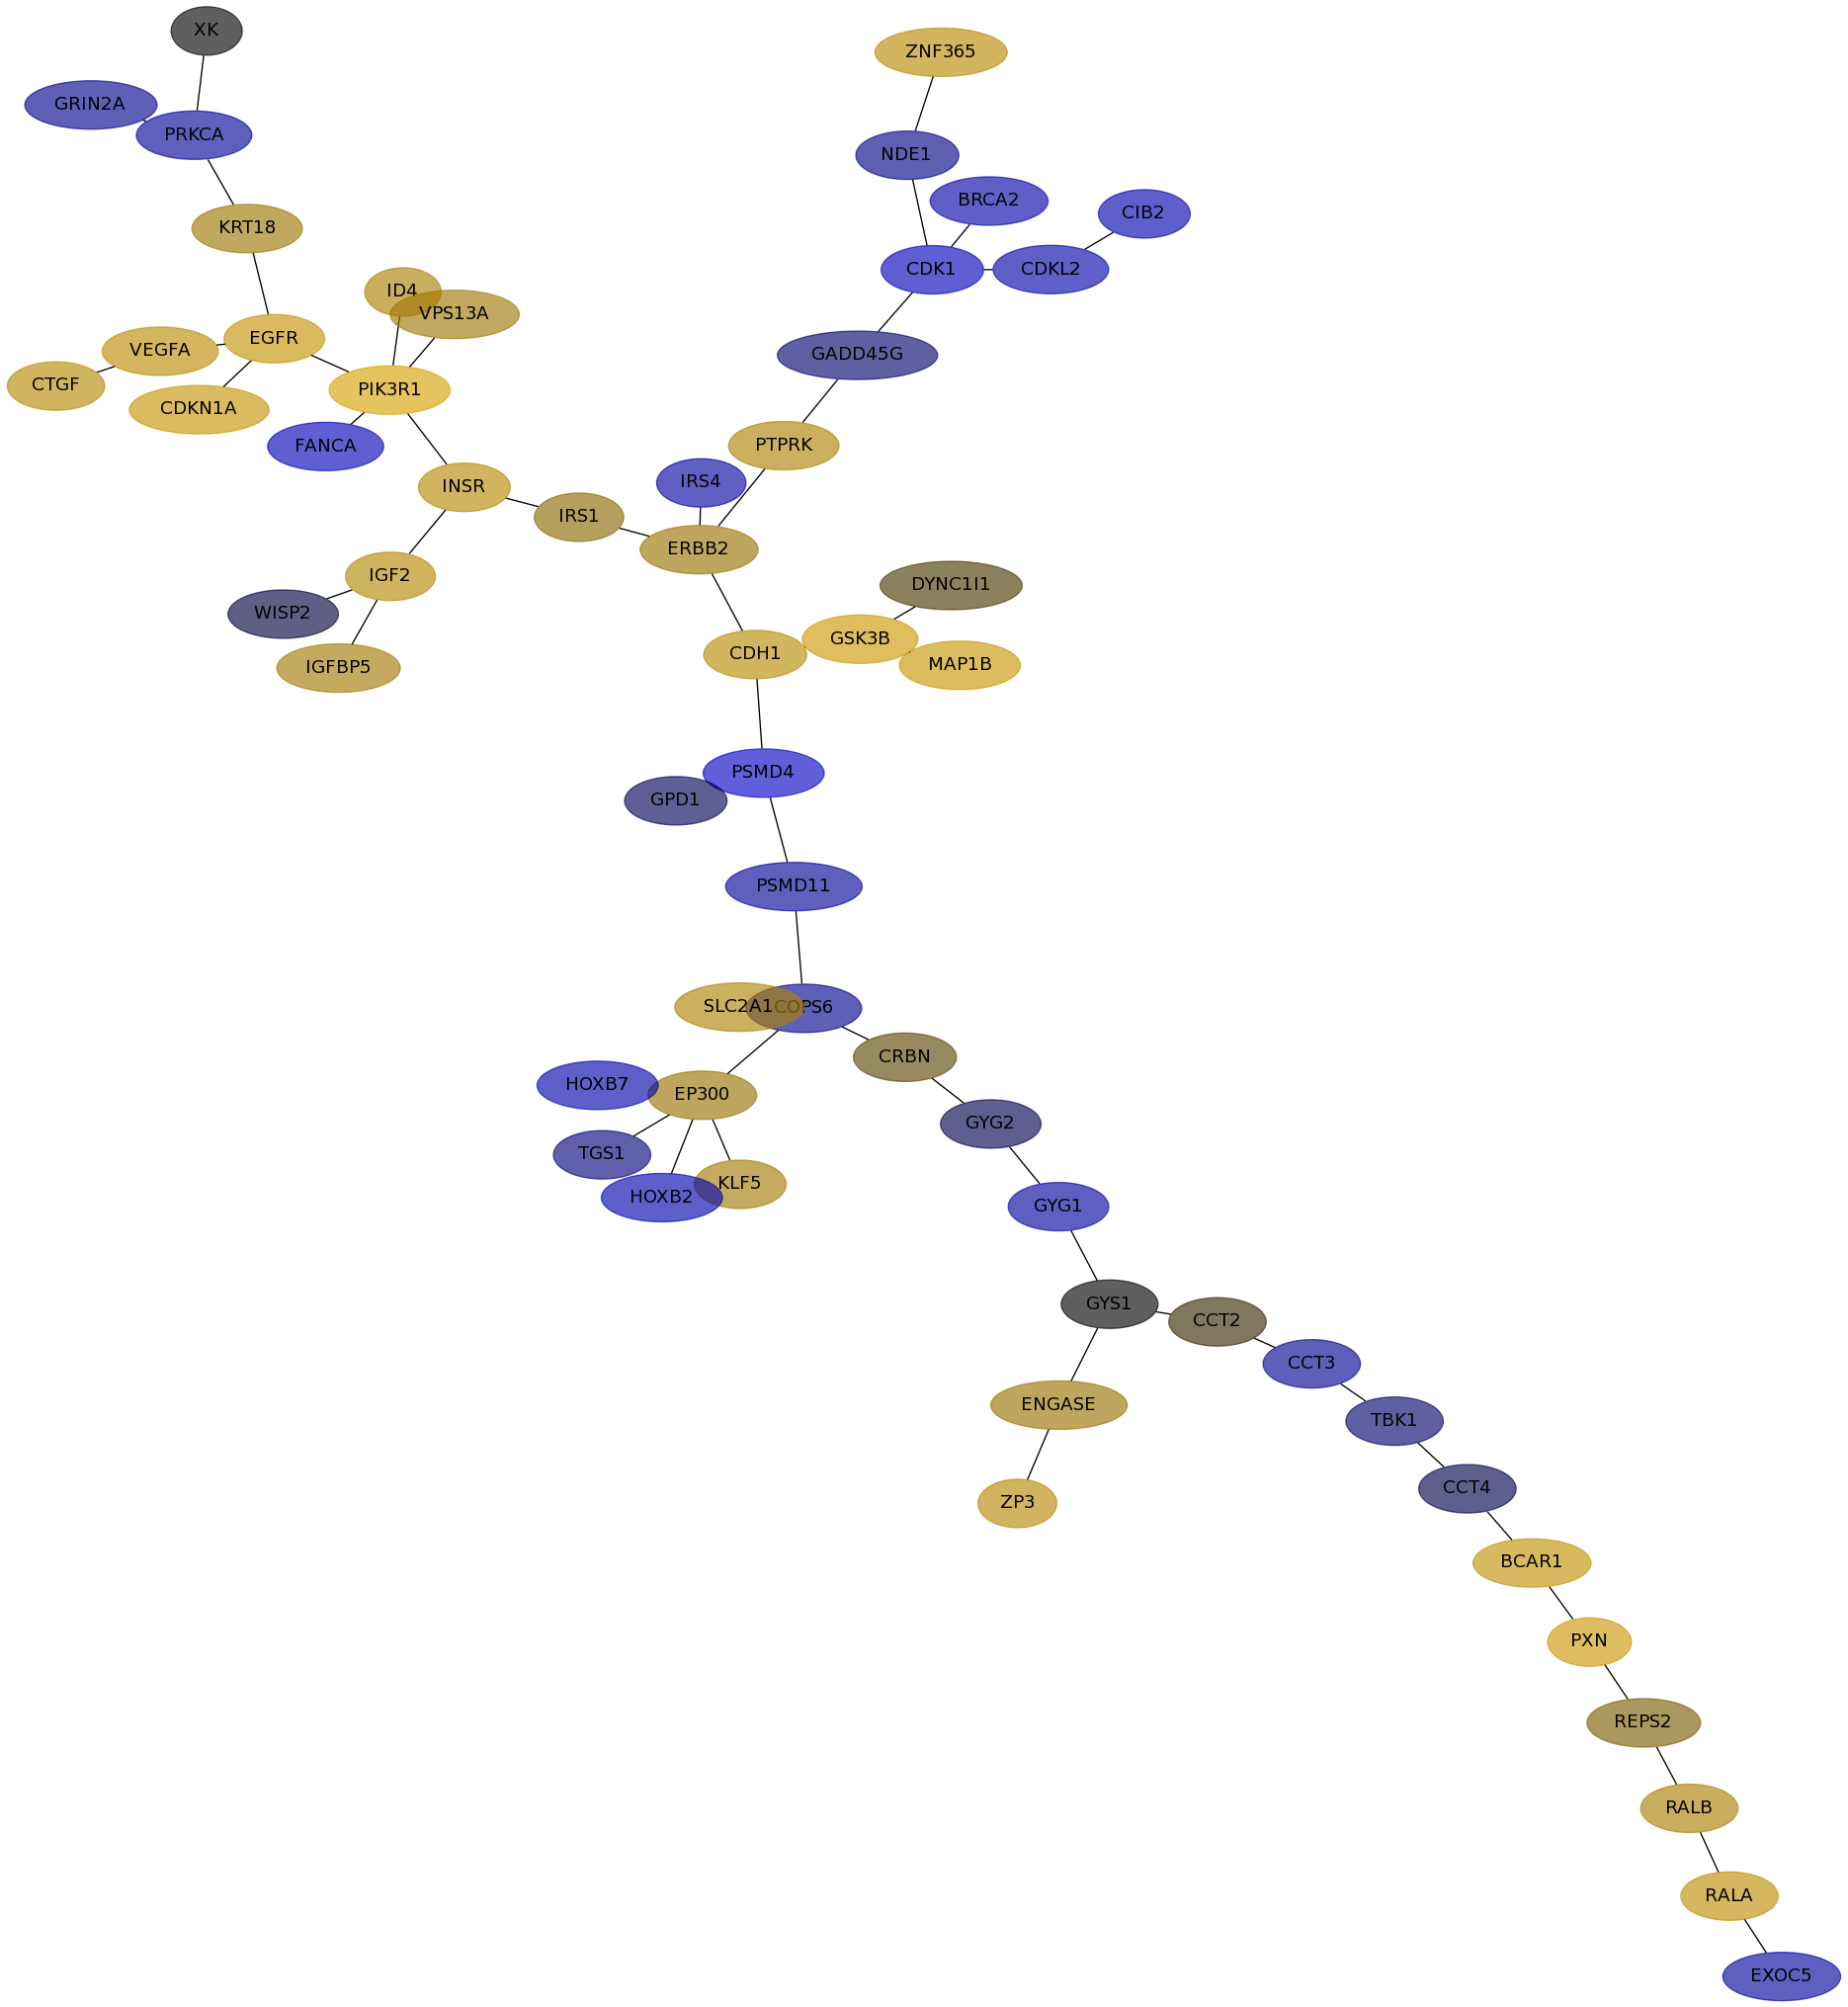
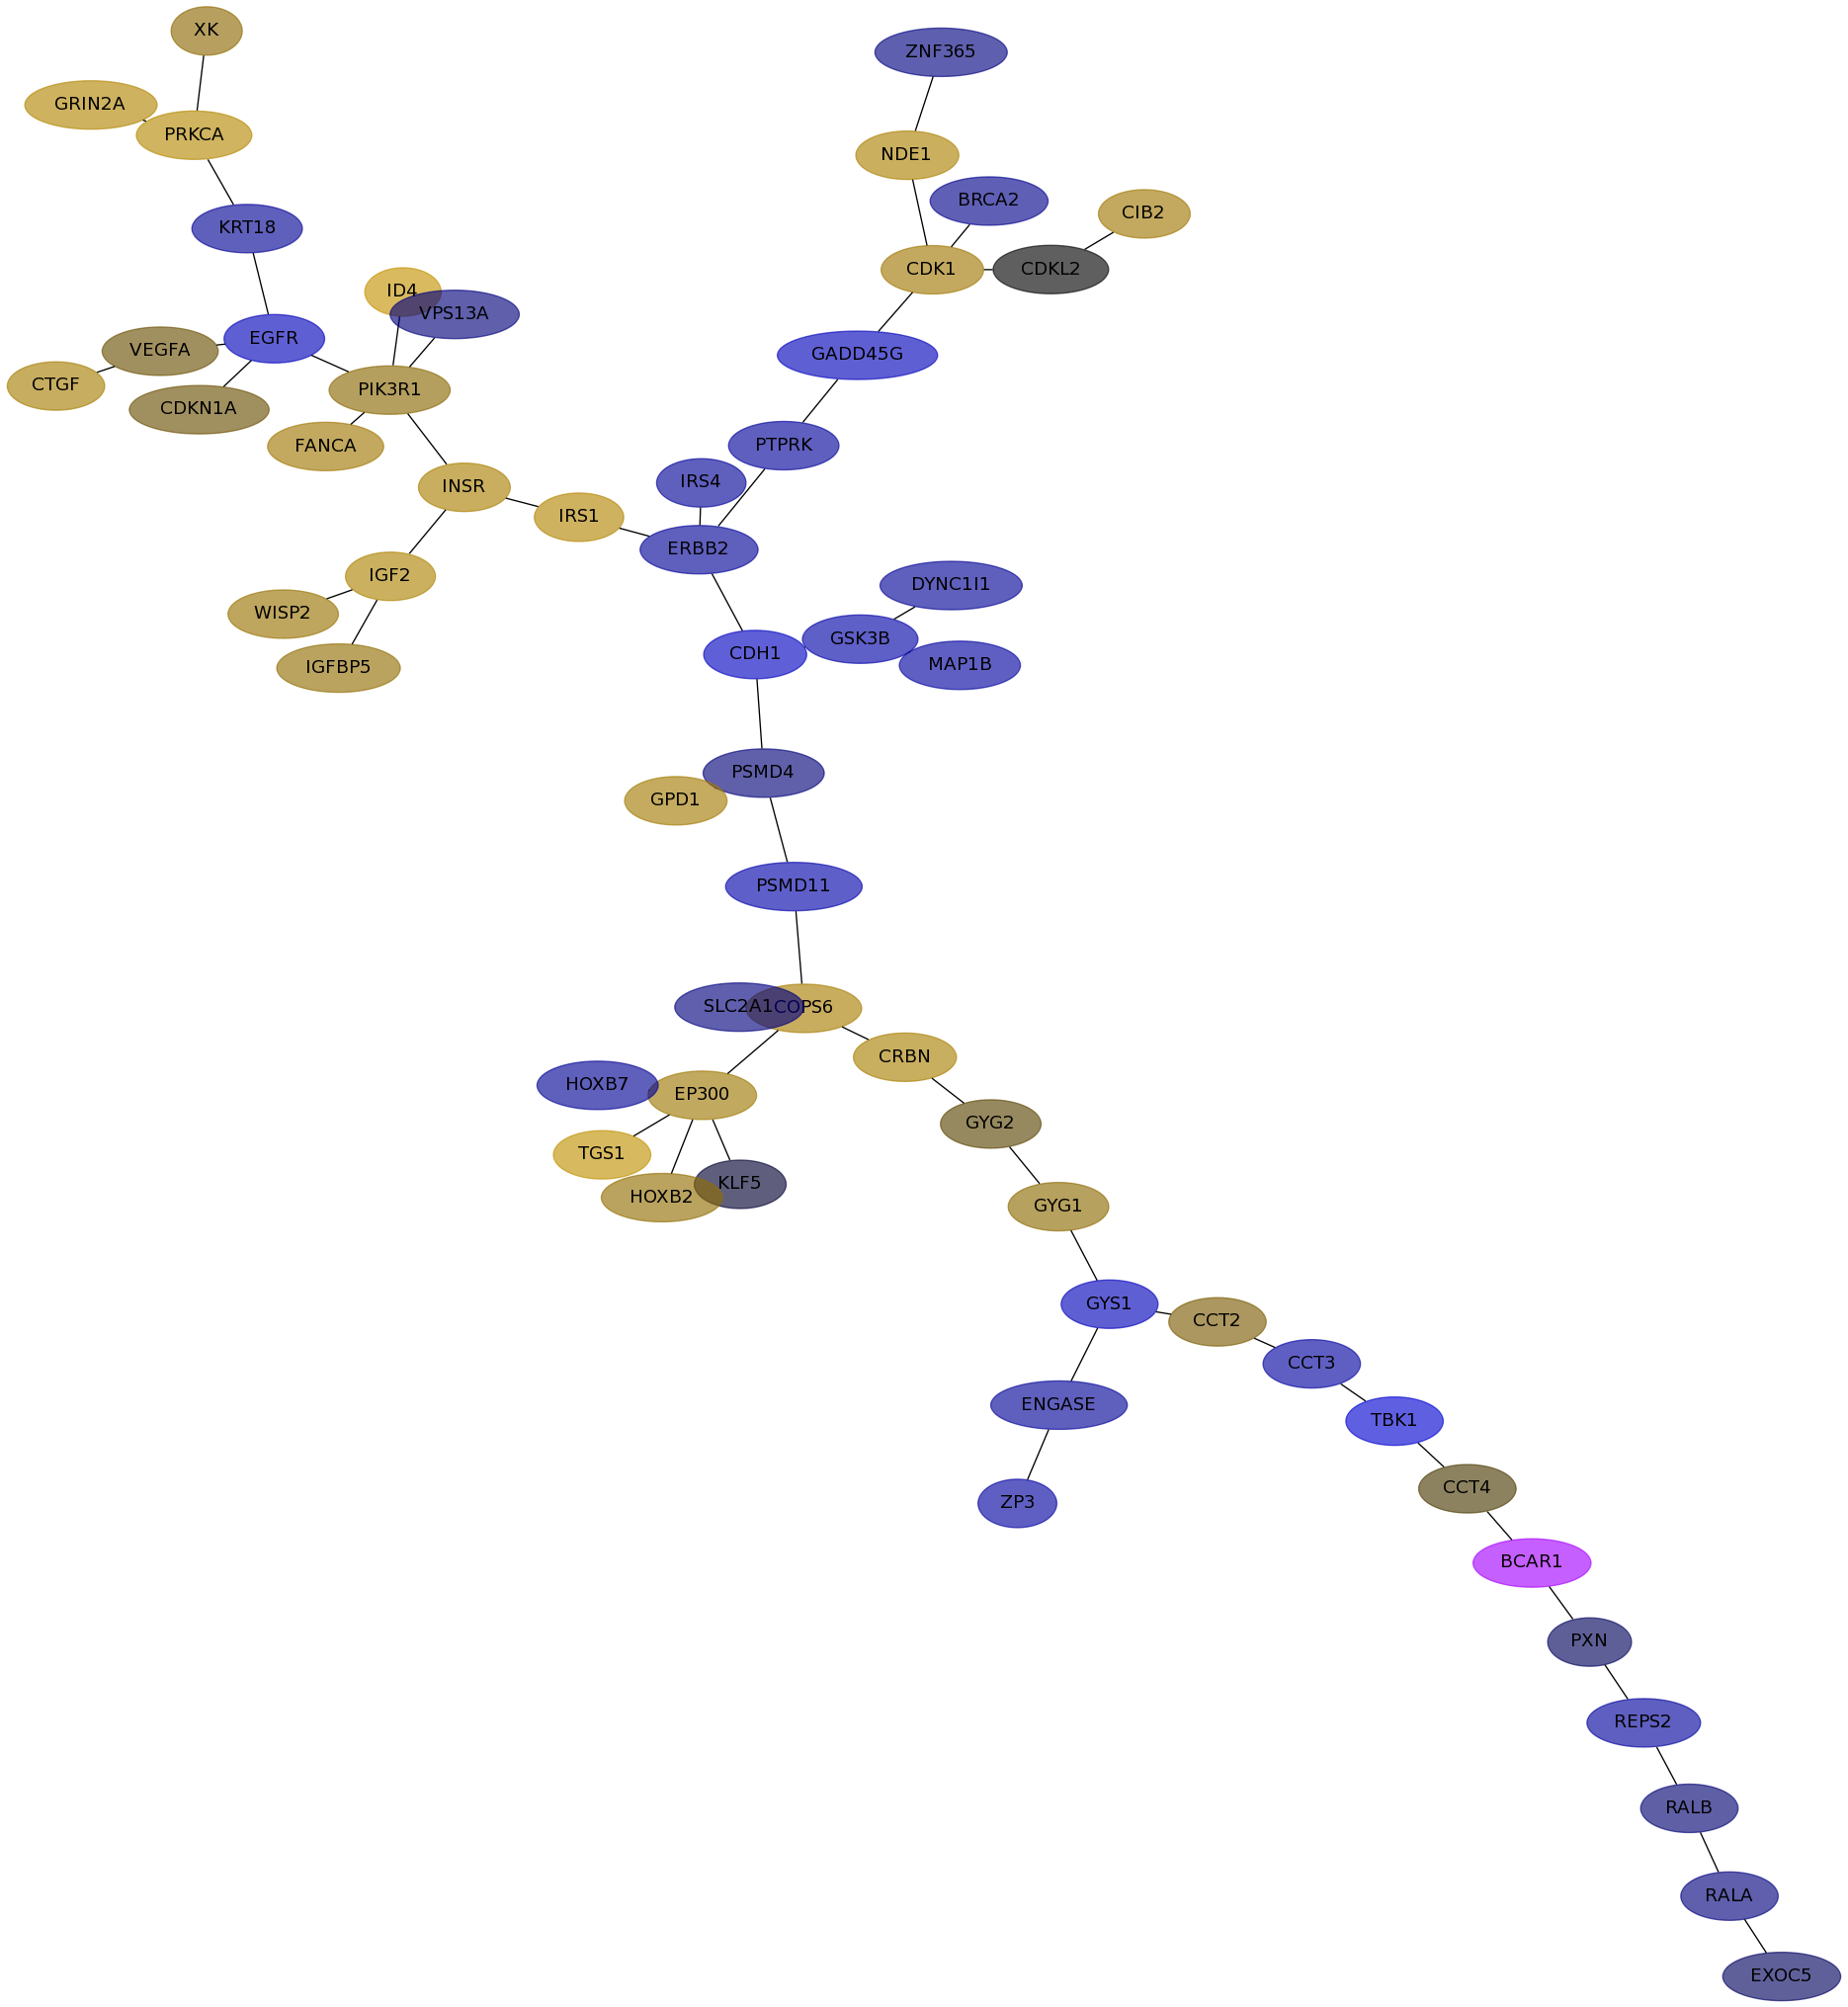
Subnetwork structure for each dataset
- IPC
Score for each gene in subnetwork 6798 in each dataset
| Gene Symbol | Links | Frequency | Frequency Rank | Subnetwork score rank | Global rank |
IPC | Loi | Schmidt | VanDeVijver | Wang |
|---|
| EP300 |   | 113 | 4 | 1 | 4 | -0.149 | 0.087 | 0.102 | 0.052 | 0.025 |
|---|
| GYG2 | | 2 | 743 | 412 | 439 | 0.092 | -0.015 | 0.020 | 0.189 | -0.004 |
|---|
| HOXB7 | | 6 | 301 | 1 | 52 | 0.267 | -0.139 | -0.083 | 0.085 | -0.051 |
|---|
| REPS2 | | 1 | 1195 | 1474 | 1491 | 0.144 | 0.043 | -0.100 | 0.222 | 0.062 |
|---|
| GADD45G | | 43 | 25 | 141 | 134 | 0.030 | -0.029 | -0.207 | 0.201 | -0.055 |
|---|
| SLC2A1 | | 7 | 256 | 236 | 237 | 0.205 | 0.143 | -0.050 | -0.023 | 0.086 |
|---|
| CIB2 | | 18 | 86 | 590 | 564 | 0.228 | -0.149 | 0.106 | 0.127 | 0.190 |
|---|
| ERBB2 | | 141 | 1 | 1 | 1 | -0.103 | 0.092 | -0.090 | 0.267 | 0.046 |
|---|
| ID4 | | 35 | 34 | 236 | 223 | -0.179 | 0.137 | 0.241 | undef | 0.036 |
|---|
| CDKN1A | | 110 | 5 | 1 | 5 | 0.064 | 0.254 | 0.030 | undef | 0.082 |
|---|
| GYG1 | | 1 | 1195 | 1474 | 1491 | 0.247 | -0.099 | 0.070 | -0.018 | 0.041 |
|---|
| PRKCA | | 63 | 15 | 1 | 10 | -0.016 | -0.088 | 0.174 | 0.095 | 0.005 |
|---|
| VPS13A | | 10 | 167 | 236 | 234 | -0.203 | 0.105 | -0.046 | 0.120 | 0.062 |
|---|
| DYNC1I1 | | 5 | 360 | 614 | 612 | -0.069 | 0.013 | -0.086 | -0.045 | 0.088 |
|---|
| HOXB2 | | 33 | 37 | 318 | 289 | 0.024 | -0.143 | 0.076 | 0.247 | -0.184 |
|---|
| ENGASE | | 1 | 1195 | 1474 | 1491 | 0.025 | 0.089 | -0.088 | undef | -0.008 |
|---|
| GPD1 | | 7 | 256 | 658 | 644 | 0.006 | -0.019 | 0.112 | -0.034 | 0.033 |
|---|
| WISP2 | | 3 | 557 | 957 | 949 | 0.232 | -0.010 | 0.088 | 0.047 | 0.204 |
|---|
| CCT4 | | 1 | 1195 | 1474 | 1491 | 0.101 | -0.014 | 0.014 | -0.058 | -0.047 |
|---|
| CTGF | | 32 | 40 | 318 | 290 | -0.169 | 0.181 | 0.126 | 0.101 | 0.209 |
|---|
| CDH1 | | 37 | 32 | 296 | 278 | -0.227 | 0.187 | -0.236 | 0.137 | -0.024 |
|---|
| RALB | | 2 | 743 | 1474 | 1462 | 0.150 | 0.137 | -0.036 | -0.047 | 0.007 |
|---|
| GYS1 | | 1 | 1195 | 1474 | 1491 | -0.120 | -0.001 | -0.204 | 0.129 | 0.104 |
|---|
| PSMD11 | | 6 | 301 | 1437 | 1408 | 0.088 | -0.090 | -0.137 | 0.060 | -0.078 |
|---|
| GRIN2A | | 12 | 140 | 179 | 192 | -0.113 | -0.068 | 0.162 | 0.125 | undef |
|---|
| ZNF365 | | 4 | 440 | 141 | 165 | 0.161 | 0.190 | -0.050 | -0.053 | -0.008 |
|---|
| PTPRK | | 14 | 117 | 83 | 96 | 0.156 | 0.141 | -0.094 | 0.048 | -0.024 |
|---|
| CCT2 | | 3 | 557 | 1474 | 1450 | 0.182 | 0.008 | 0.043 | 0.055 | 0.004 |
|---|
| PXN | | 12 | 140 | 1 | 36 | -0.088 | 0.284 | -0.022 | 0.060 | 0.114 |
|---|
| TBK1 | | 1 | 1195 | 1474 | 1491 | 0.091 | -0.031 | -0.334 | 0.013 | -0.019 |
|---|
| PIK3R1 | | 127 | 2 | 1 | 2 | -0.237 | 0.381 | 0.065 | undef | -0.002 |
|---|
| CRBN | | 1 | 1195 | 1474 | 1491 | 0.015 | 0.022 | 0.131 | -0.102 | 0.113 |
|---|
| CCT3 | | 1 | 1195 | 1474 | 1491 | 0.219 | -0.079 | -0.109 | -0.028 | -0.123 |
|---|
| ZP3 | | 1 | 1195 | 1474 | 1491 | 0.133 | 0.181 | -0.107 | 0.183 | -0.121 |
|---|
| PSMD4 | | 11 | 148 | 296 | 282 | 0.285 | -0.243 | -0.043 | 0.087 | -0.045 |
|---|
| VEGFA | | 68 | 14 | 83 | 78 | 0.090 | 0.200 | 0.030 | 0.095 | 0.148 |
|---|
| BCAR1 | | 6 | 301 | 1 | 52 | -0.012 | 0.229 | undef | 0.223 | undef |
|---|
| FANCA | | 9 | 196 | 1 | 44 | 0.120 | -0.188 | 0.106 | -0.127 | -0.053 |
|---|
| IRS4 | | 32 | 40 | 236 | 224 | 0.115 | -0.111 | -0.088 | 0.096 | 0.142 |
|---|
| CDKL2 | | 3 | 557 | 1260 | 1237 | undef | -0.129 | 0.000 | 0.109 | undef |
|---|
| EXOC5 | | 1 | 1195 | 1474 | 1491 | 0.062 | -0.094 | -0.023 | 0.116 | -0.133 |
|---|
| CDK1 | | 63 | 15 | 83 | 79 | 0.265 | -0.195 | 0.106 | 0.088 | 0.031 |
|---|
| XK | | 18 | 86 | 179 | 187 | 0.154 | -0.000 | 0.067 | -0.123 | -0.040 |
|---|
| EGFR | | 117 | 3 | 1 | 3 | -0.195 | 0.240 | -0.205 | -0.187 | 0.065 |
|---|
| MAP1B | | 69 | 12 | 1 | 9 | -0.123 | 0.263 | -0.107 | 0.304 | 0.100 |
|---|
| IRS1 | | 9 | 196 | 842 | 805 | -0.219 | 0.065 | 0.165 | 0.102 | 0.064 |
|---|
| RALA | | 10 | 167 | 318 | 323 | 0.224 | 0.207 | -0.047 | 0.169 | 0.146 |
|---|
| INSR | | 96 | 6 | 236 | 221 | 0.063 | 0.173 | 0.135 | -0.014 | -0.072 |
|---|
| BRCA2 | | 41 | 28 | 236 | 222 | 0.206 | -0.124 | -0.066 | 0.233 | -0.116 |
|---|
| IGFBP5 | | 48 | 23 | 83 | 80 | -0.076 | 0.110 | 0.074 | 0.278 | 0.181 |
|---|
| GSK3B | | 79 | 8 | 179 | 169 | -0.130 | 0.292 | -0.129 | 0.291 | 0.057 |
|---|
| KLF5 | | 76 | 9 | 1 | 7 | 0.077 | 0.117 | -0.007 | -0.110 | -0.006 |
|---|
| NDE1 | | 3 | 557 | 141 | 170 | 0.142 | -0.058 | 0.142 | 0.107 | 0.111 |
|---|
| COPS6 | | 16 | 104 | 1 | 31 | 0.147 | -0.068 | 0.128 | 0.216 | 0.065 |
|---|
| KRT18 | | 8 | 222 | 590 | 569 | 0.148 | 0.100 | -0.083 | 0.024 | -0.053 |
|---|
| TGS1 | | 5 | 360 | 780 | 767 | -0.060 | -0.044 | 0.232 | undef | 0.269 |
|---|
| IGF2 | | 14 | 117 | 570 | 553 | -0.022 | 0.172 | 0.145 | 0.087 | 0.116 |
|---|
GO Enrichment output for subnetwork 6798 in each dataset
| Name | Accession Number | Link | P-val | Corrected P-val |
|---|
| insulin receptor signaling pathway | GO:0008286 |  | 8.497E-10 | 2.076E-06 |
|---|
| cellular response to insulin stimulus | GO:0032869 | | 7.651E-09 | 9.346E-06 |
|---|
| phosphoinositide 3-kinase cascade | GO:0014065 | | 1.504E-08 | 1.225E-05 |
|---|
| induction of positive chemotaxis | GO:0050930 | | 2.7E-08 | 1.649E-05 |
|---|
| response to insulin stimulus | GO:0032868 | | 2.892E-08 | 1.413E-05 |
|---|
| glucan biosynthetic process | GO:0009250 | | 4.486E-08 | 1.826E-05 |
|---|
| regulation of positive chemotaxis | GO:0050926 | | 1.051E-07 | 3.668E-05 |
|---|
| positive regulation of cell migration | GO:0030335 | | 1.053E-07 | 3.214E-05 |
|---|
| response to peptide hormone stimulus | GO:0043434 | | 1.913E-07 | 5.193E-05 |
|---|
| positive regulation of cell motion | GO:0051272 | | 2.101E-07 | 5.132E-05 |
|---|
| anaphase-promoting complex-dependent proteasomal ubiquitin-dependent protein catabolic process | GO:0031145 | | 2.757E-07 | 6.124E-05 |
|---|
| Name | Accession Number | Link | P-val | Corrected P-val |
|---|
| insulin receptor signaling pathway | GO:0008286 | | 1.124E-09 | 2.705E-06 |
|---|
| cellular response to insulin stimulus | GO:0032869 | | 1.093E-08 | 1.315E-05 |
|---|
| phosphoinositide 3-kinase cascade | GO:0014065 | | 2.15E-08 | 1.725E-05 |
|---|
| induction of positive chemotaxis | GO:0050930 | | 3.858E-08 | 2.32E-05 |
|---|
| response to insulin stimulus | GO:0032868 | | 4.268E-08 | 2.054E-05 |
|---|
| glucan biosynthetic process | GO:0009250 | | 6.409E-08 | 2.57E-05 |
|---|
| regulation of positive chemotaxis | GO:0050926 | | 1.501E-07 | 5.158E-05 |
|---|
| positive regulation of cell migration | GO:0030335 | | 1.591E-07 | 4.786E-05 |
|---|
| response to peptide hormone stimulus | GO:0043434 | | 2.401E-07 | 6.42E-05 |
|---|
| positive regulation of cell motion | GO:0051272 | | 3.209E-07 | 7.721E-05 |
|---|
| anaphase-promoting complex-dependent proteasomal ubiquitin-dependent protein catabolic process | GO:0031145 | | 4.62E-07 | 1.011E-04 |
|---|
| Name | Accession Number | Link | P-val | Corrected P-val |
|---|
| induction of positive chemotaxis | GO:0050930 | | 5.877E-08 | 1.352E-04 |
|---|
| phosphoinositide 3-kinase cascade | GO:0014065 | | 5.877E-08 | 6.759E-05 |
|---|
| glucan biosynthetic process | GO:0009250 | | 1.748E-07 | 1.34E-04 |
|---|
| insulin receptor signaling pathway | GO:0008286 | | 1.759E-07 | 1.011E-04 |
|---|
| regulation of positive chemotaxis | GO:0050926 | | 2.736E-07 | 1.258E-04 |
|---|
| anaphase-promoting complex-dependent proteasomal ubiquitin-dependent protein catabolic process | GO:0031145 | | 1.019E-06 | 3.906E-04 |
|---|
| cellular response to insulin stimulus | GO:0032869 | | 1.103E-06 | 3.623E-04 |
|---|
| positive regulation of ubiquitin-protein ligase activity during mitotic cell cycle | GO:0051437 | | 1.123E-06 | 3.229E-04 |
|---|
| glycogen metabolic process | GO:0005977 | | 1.281E-06 | 3.273E-04 |
|---|
| glucan metabolic process | GO:0044042 | | 1.481E-06 | 3.406E-04 |
|---|
| positive regulation of ubiquitin-protein ligase activity | GO:0051443 | | 1.489E-06 | 3.114E-04 |
|---|
VanDeVijver file
| Name | Accession Number | Link | P-val | Corrected P-val |
|---|
| glucan biosynthetic process | GO:0009250 | | 2.373E-08 | 4.374E-05 |
|---|
| insulin receptor signaling pathway | GO:0008286 | | 2.725E-08 | 2.511E-05 |
|---|
| positive regulation of cell migration | GO:0030335 | | 9.325E-08 | 5.729E-05 |
|---|
| positive regulation of cell motion | GO:0051272 | | 1.539E-07 | 7.092E-05 |
|---|
| cellular response to insulin stimulus | GO:0032869 | | 1.793E-07 | 6.61E-05 |
|---|
| regulation of cell migration | GO:0030334 | | 3.064E-07 | 9.412E-05 |
|---|
| glucan metabolic process | GO:0044042 | | 3.691E-07 | 9.719E-05 |
|---|
| response to insulin stimulus | GO:0032868 | | 5.658E-07 | 1.303E-04 |
|---|
| regulation of locomotion | GO:0040012 | | 6.424E-07 | 1.315E-04 |
|---|
| regulation of cell motion | GO:0051270 | | 6.424E-07 | 1.184E-04 |
|---|
| energy reserve metabolic process | GO:0006112 | | 6.91E-07 | 1.158E-04 |
|---|
| Name | Accession Number | Link | P-val | Corrected P-val |
|---|
| induction of positive chemotaxis | GO:0050930 | | 5.877E-08 | 1.352E-04 |
|---|
| phosphoinositide 3-kinase cascade | GO:0014065 | | 5.877E-08 | 6.759E-05 |
|---|
| glucan biosynthetic process | GO:0009250 | | 1.748E-07 | 1.34E-04 |
|---|
| insulin receptor signaling pathway | GO:0008286 | | 1.759E-07 | 1.011E-04 |
|---|
| regulation of positive chemotaxis | GO:0050926 | | 2.736E-07 | 1.258E-04 |
|---|
| anaphase-promoting complex-dependent proteasomal ubiquitin-dependent protein catabolic process | GO:0031145 | | 1.019E-06 | 3.906E-04 |
|---|
| cellular response to insulin stimulus | GO:0032869 | | 1.103E-06 | 3.623E-04 |
|---|
| positive regulation of ubiquitin-protein ligase activity during mitotic cell cycle | GO:0051437 | | 1.123E-06 | 3.229E-04 |
|---|
| glycogen metabolic process | GO:0005977 | | 1.281E-06 | 3.273E-04 |
|---|
| glucan metabolic process | GO:0044042 | | 1.481E-06 | 3.406E-04 |
|---|
| positive regulation of ubiquitin-protein ligase activity | GO:0051443 | | 1.489E-06 | 3.114E-04 |
|---|

