Study Desmedt-ER-neg
Study informations
165 subnetworks in total page | file
2310 genes associated page | file
Enriched GO terms page
General informations
General Index page
Study Index page
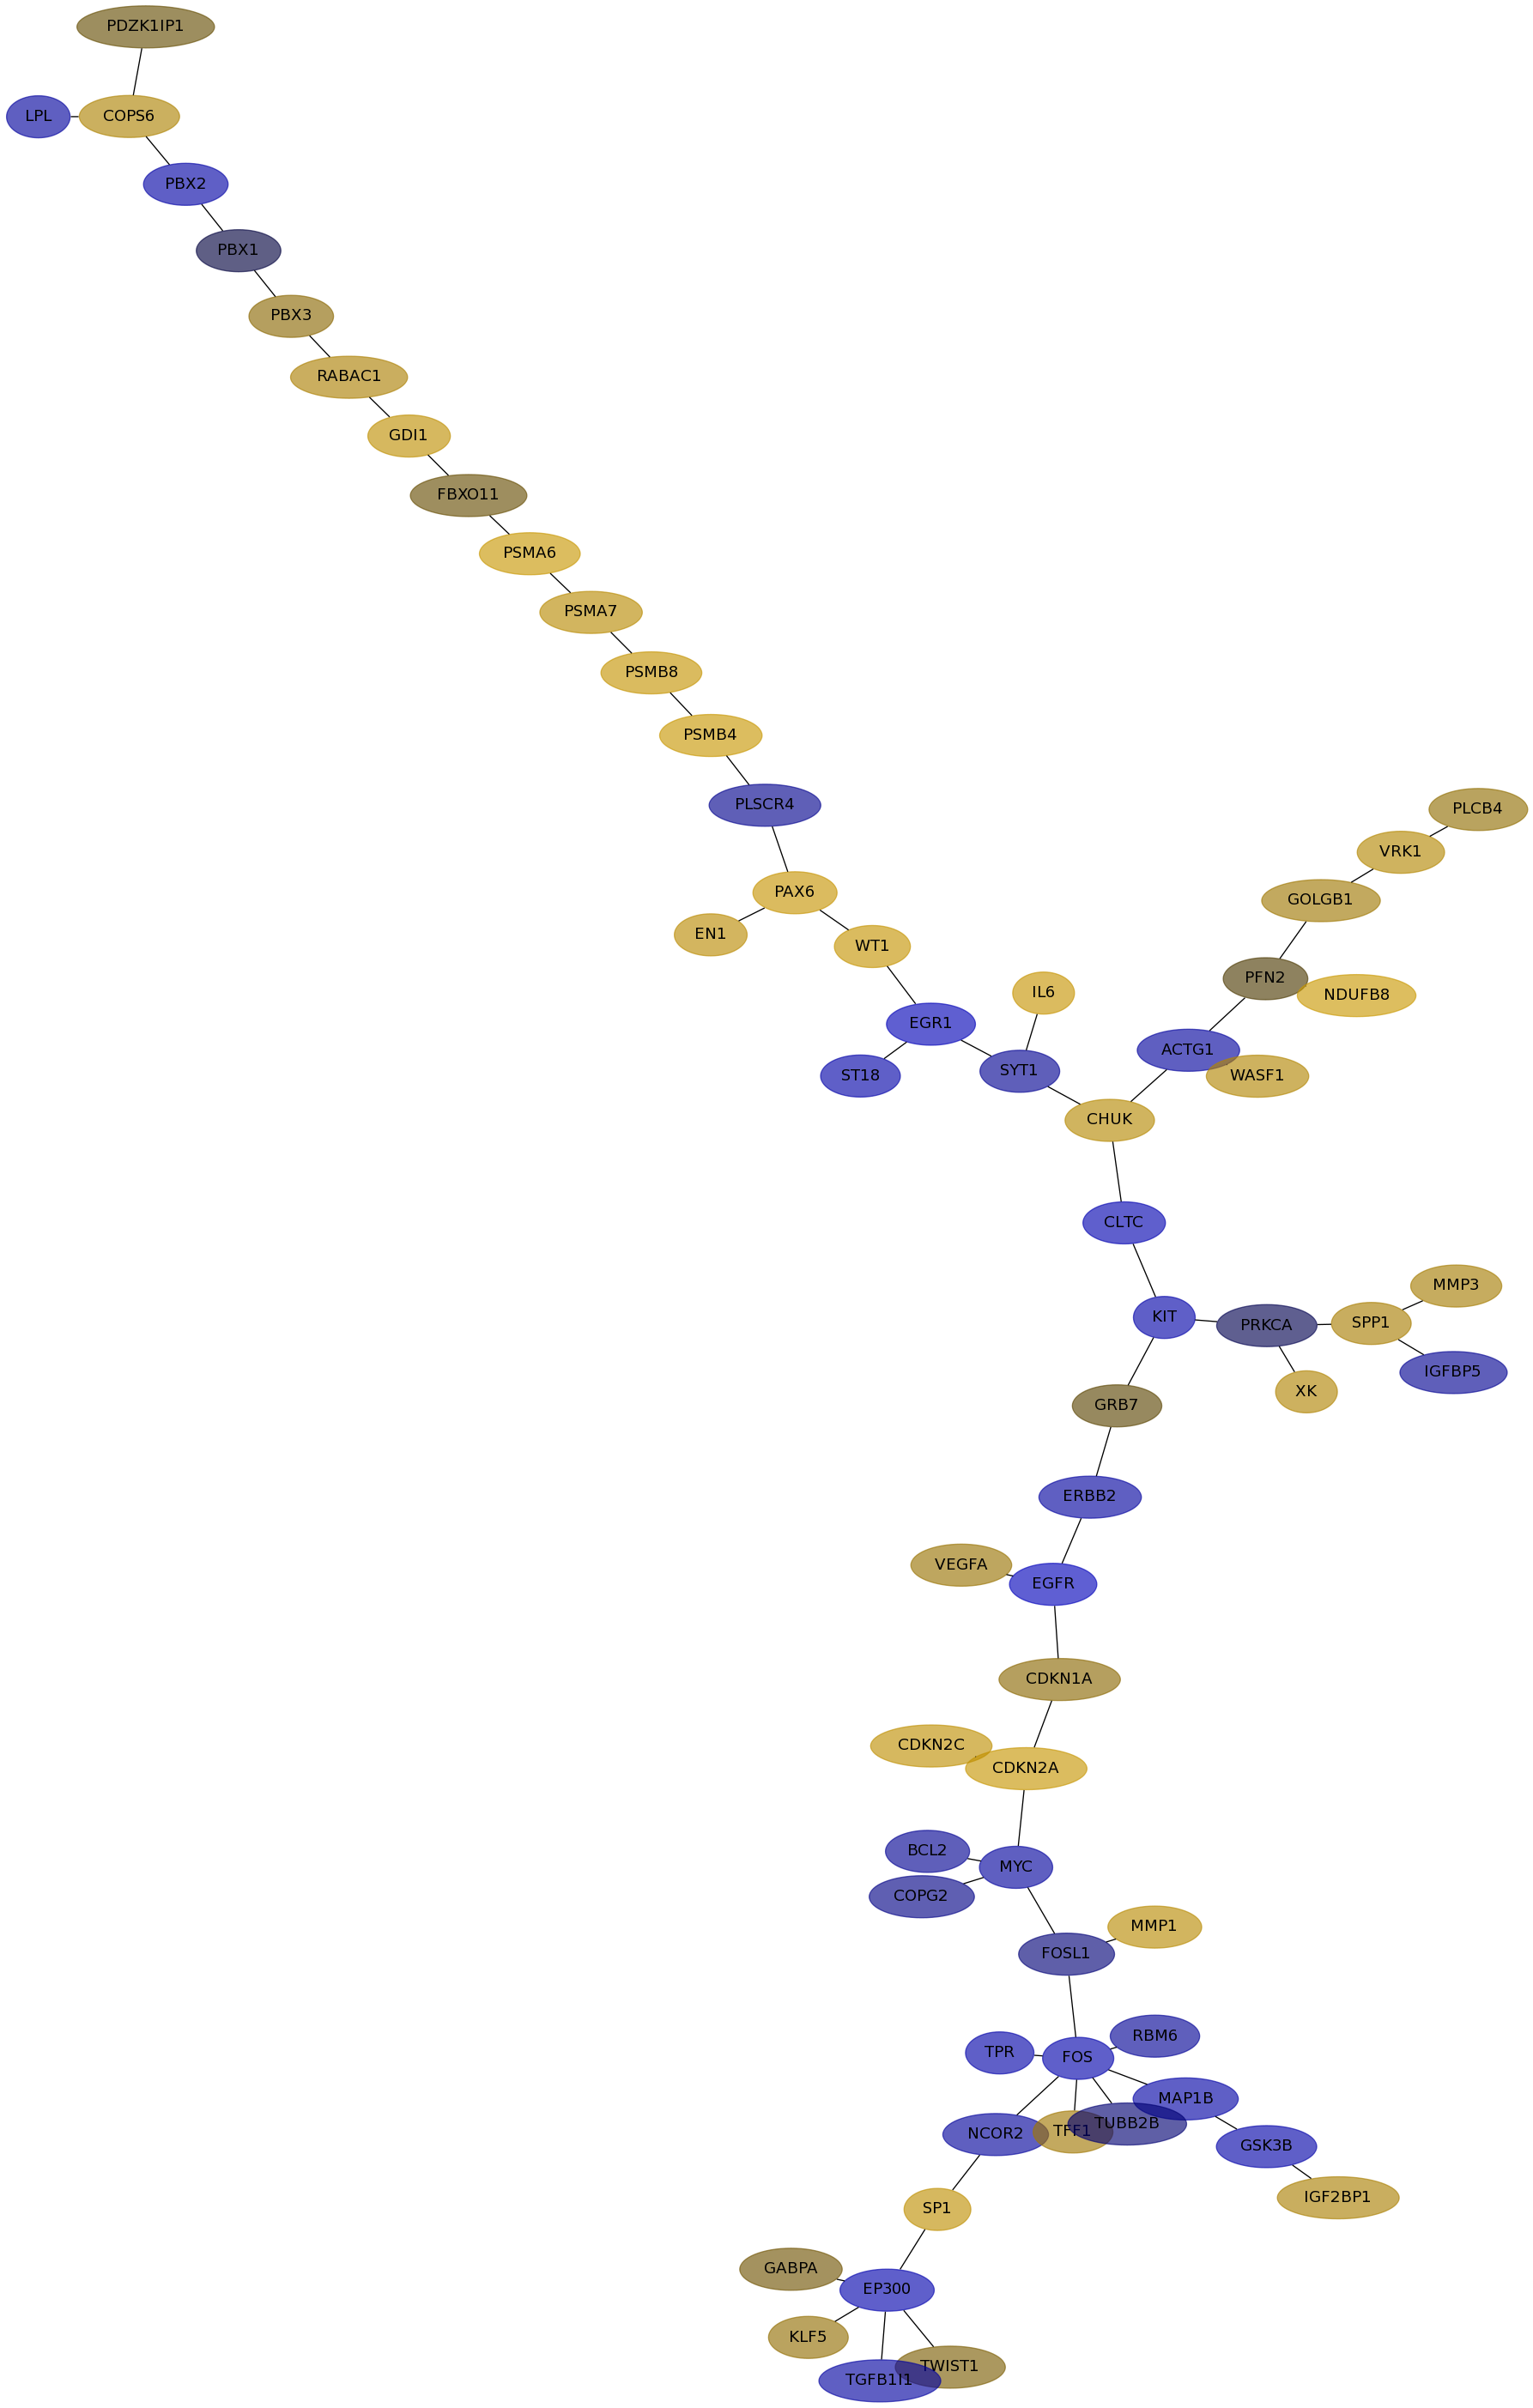
Subnetwork 6744
score
| Dataset | Score | P-val 1 | P-val 2 | P-val 3 | Fisher Score |
|---|
| IPC | 0.7507 | 3.717e-03 | 6.150e-04 | 7.785e-01 | 1.780e-06 |
|---|
| Loi | 0.2309 | 7.931e-02 | 1.111e-02 | 4.259e-01 | 3.751e-04 |
|---|
| Schmidt | 0.6749 | 0.000e+00 | 0.000e+00 | 4.333e-02 | 0.000e+00 |
|---|
| VanDeVijver | 0.7910 | 0.000e+00 | 0.000e+00 | 3.440e-03 | 0.000e+00 |
|---|
| Wang | 0.2632 | 2.471e-03 | 4.190e-02 | 3.873e-01 | 4.009e-05 |
|---|
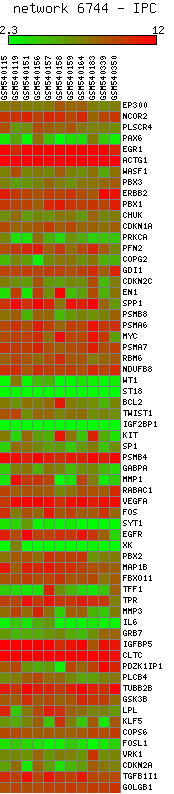
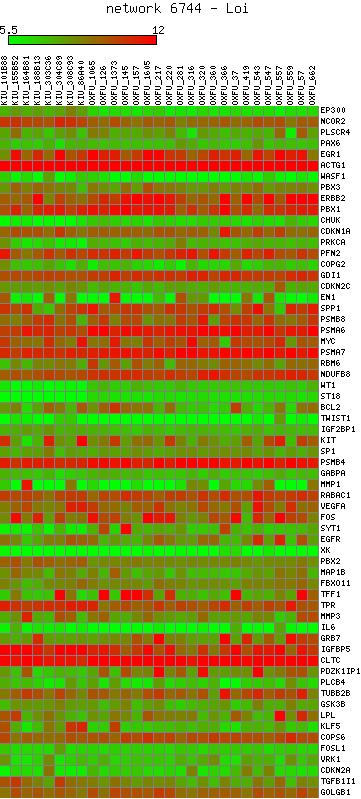
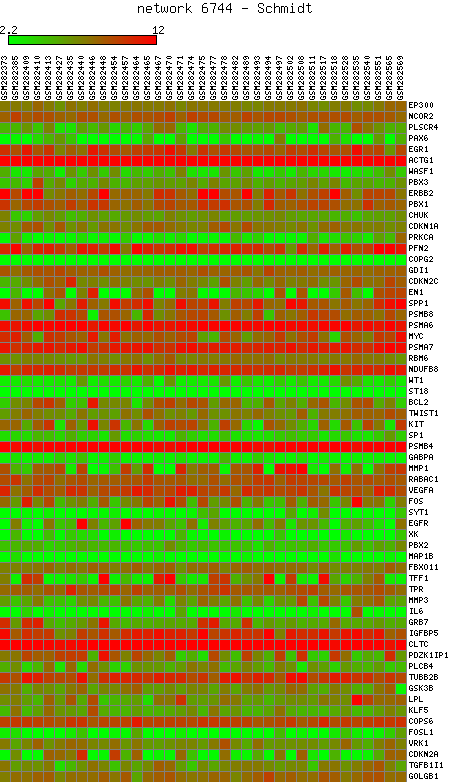
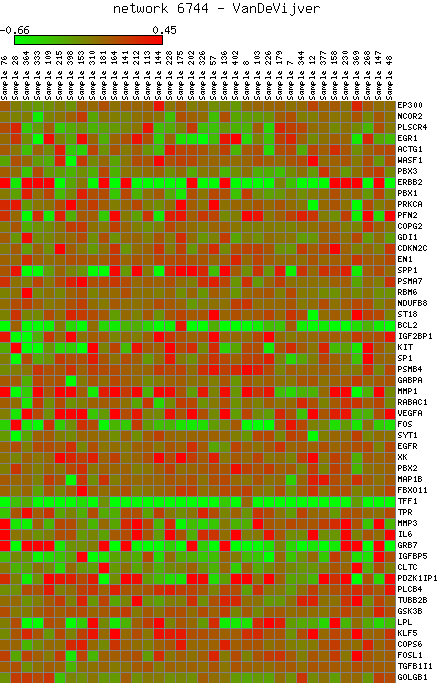
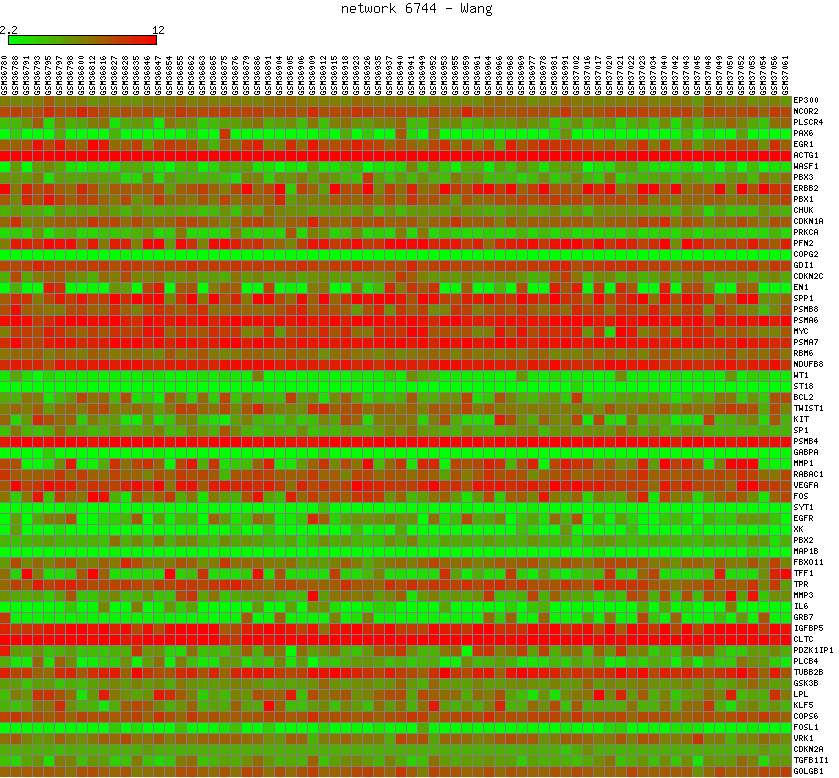
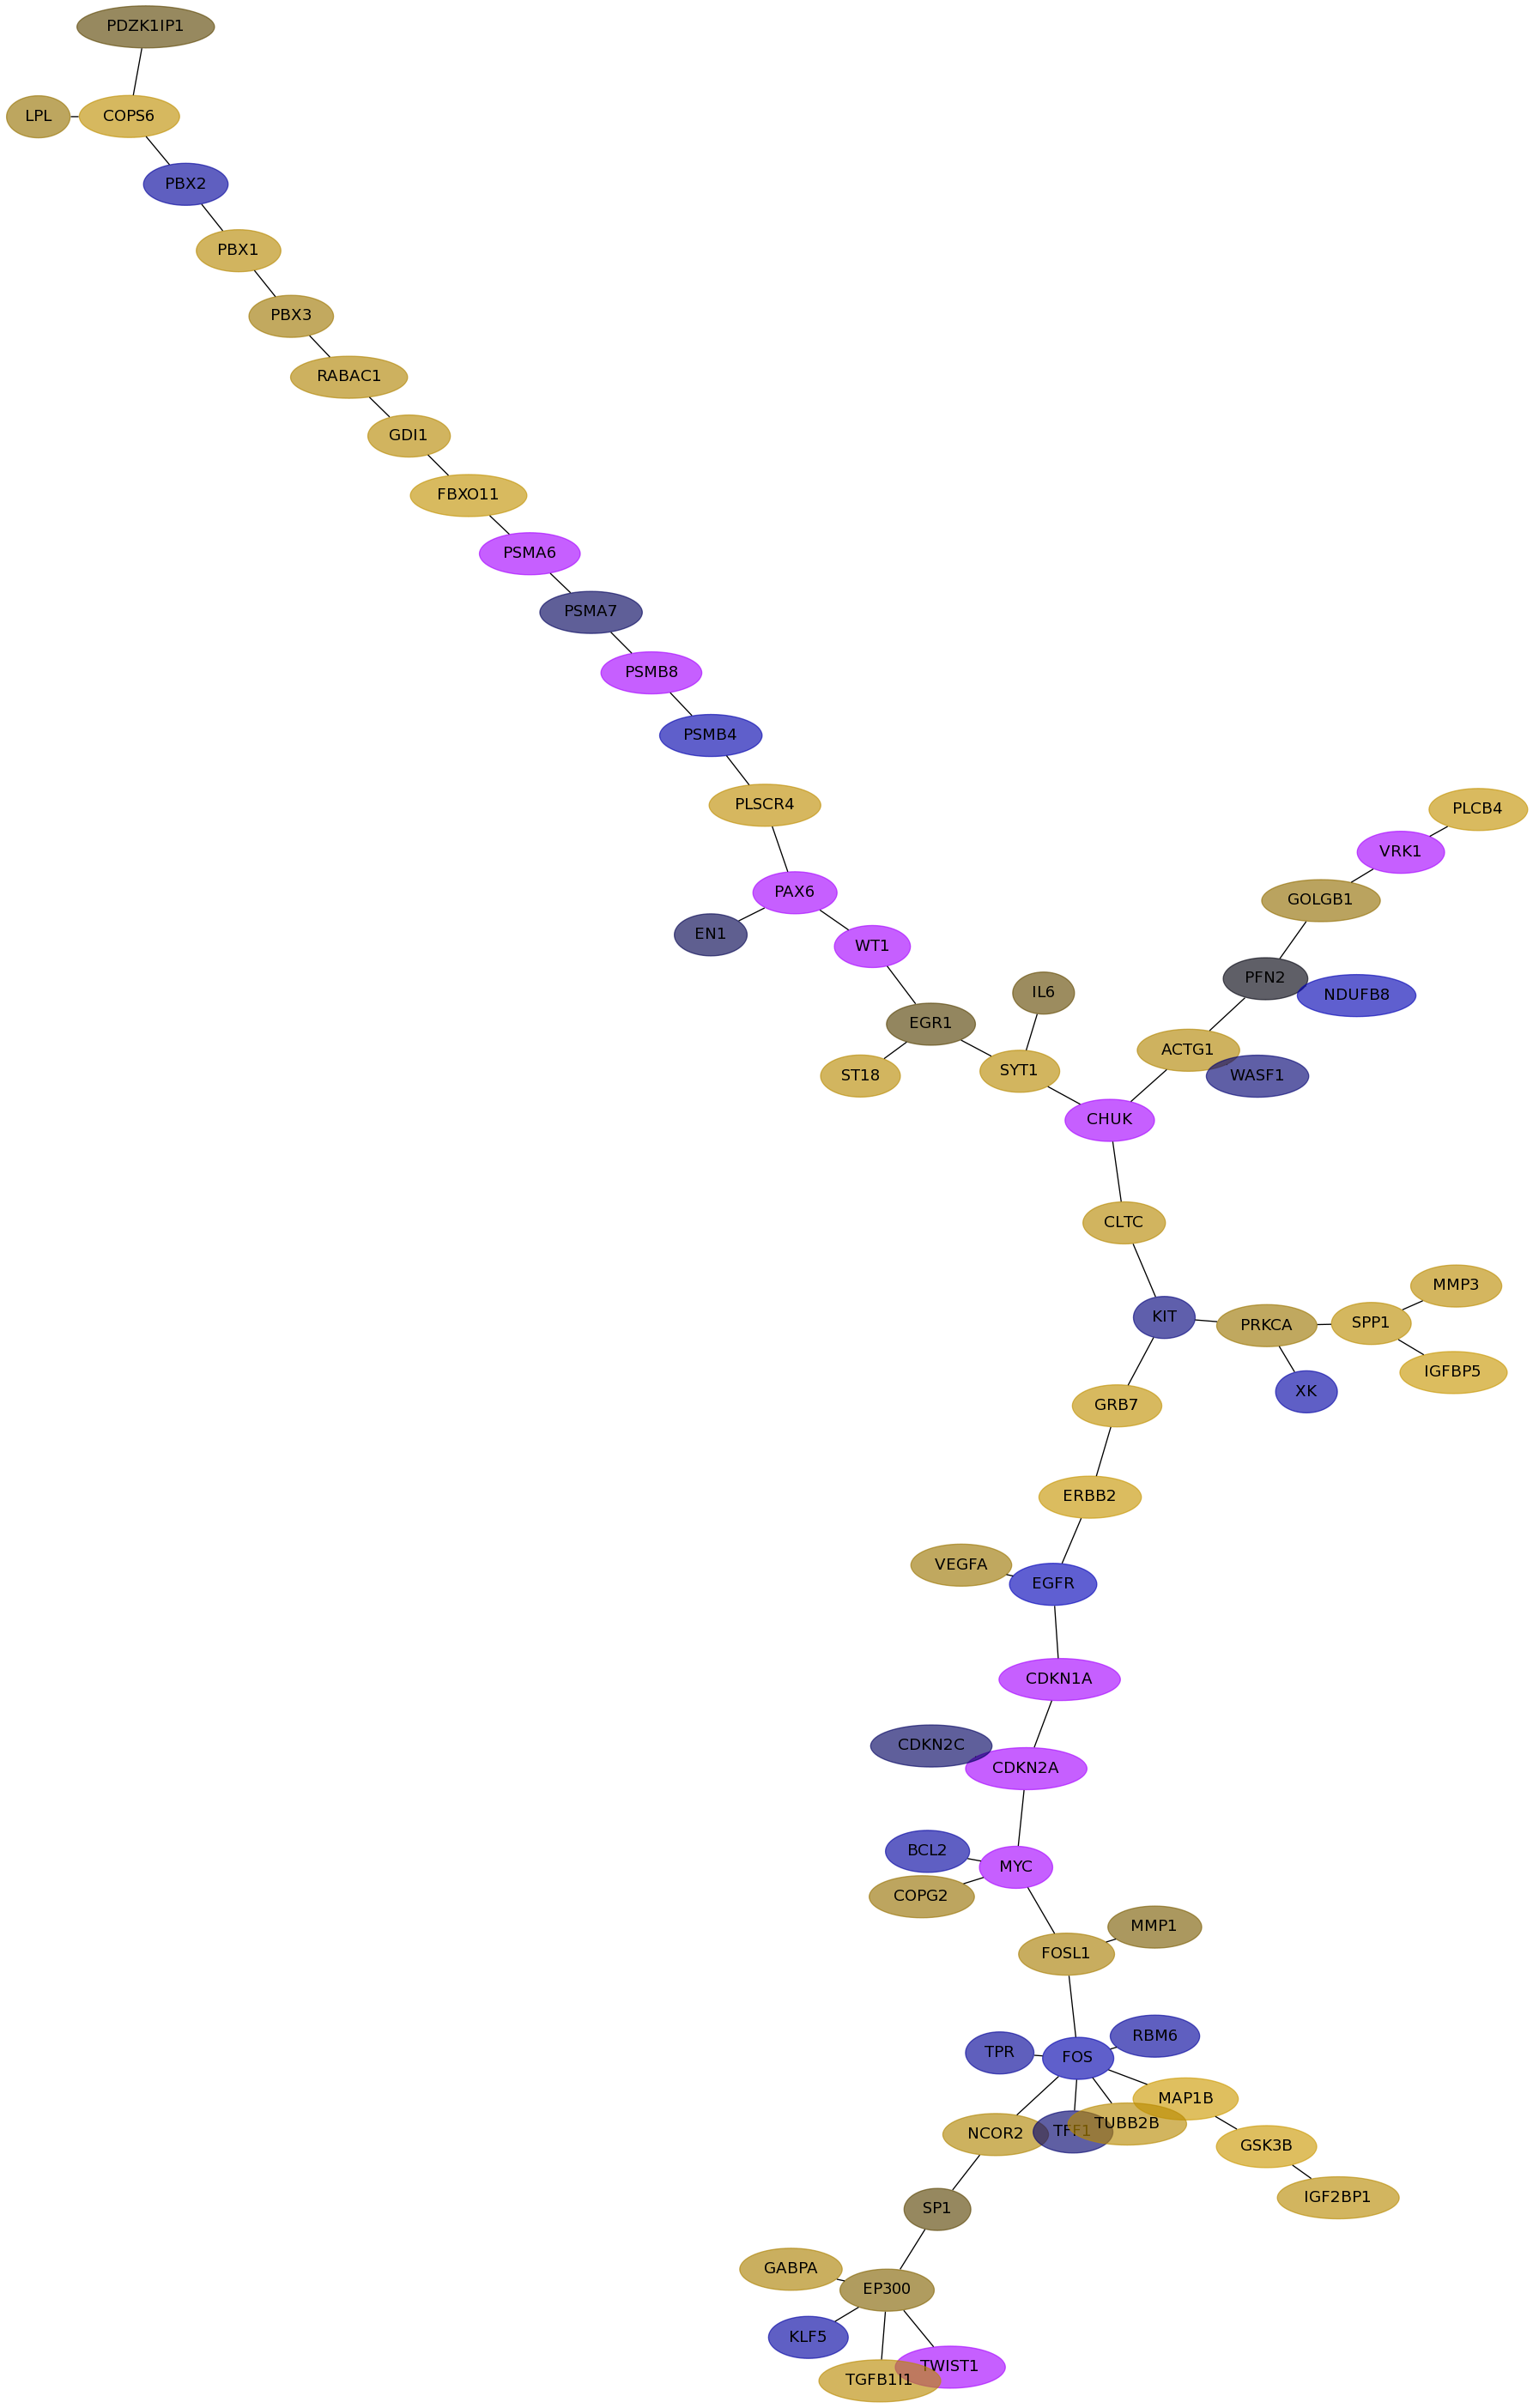
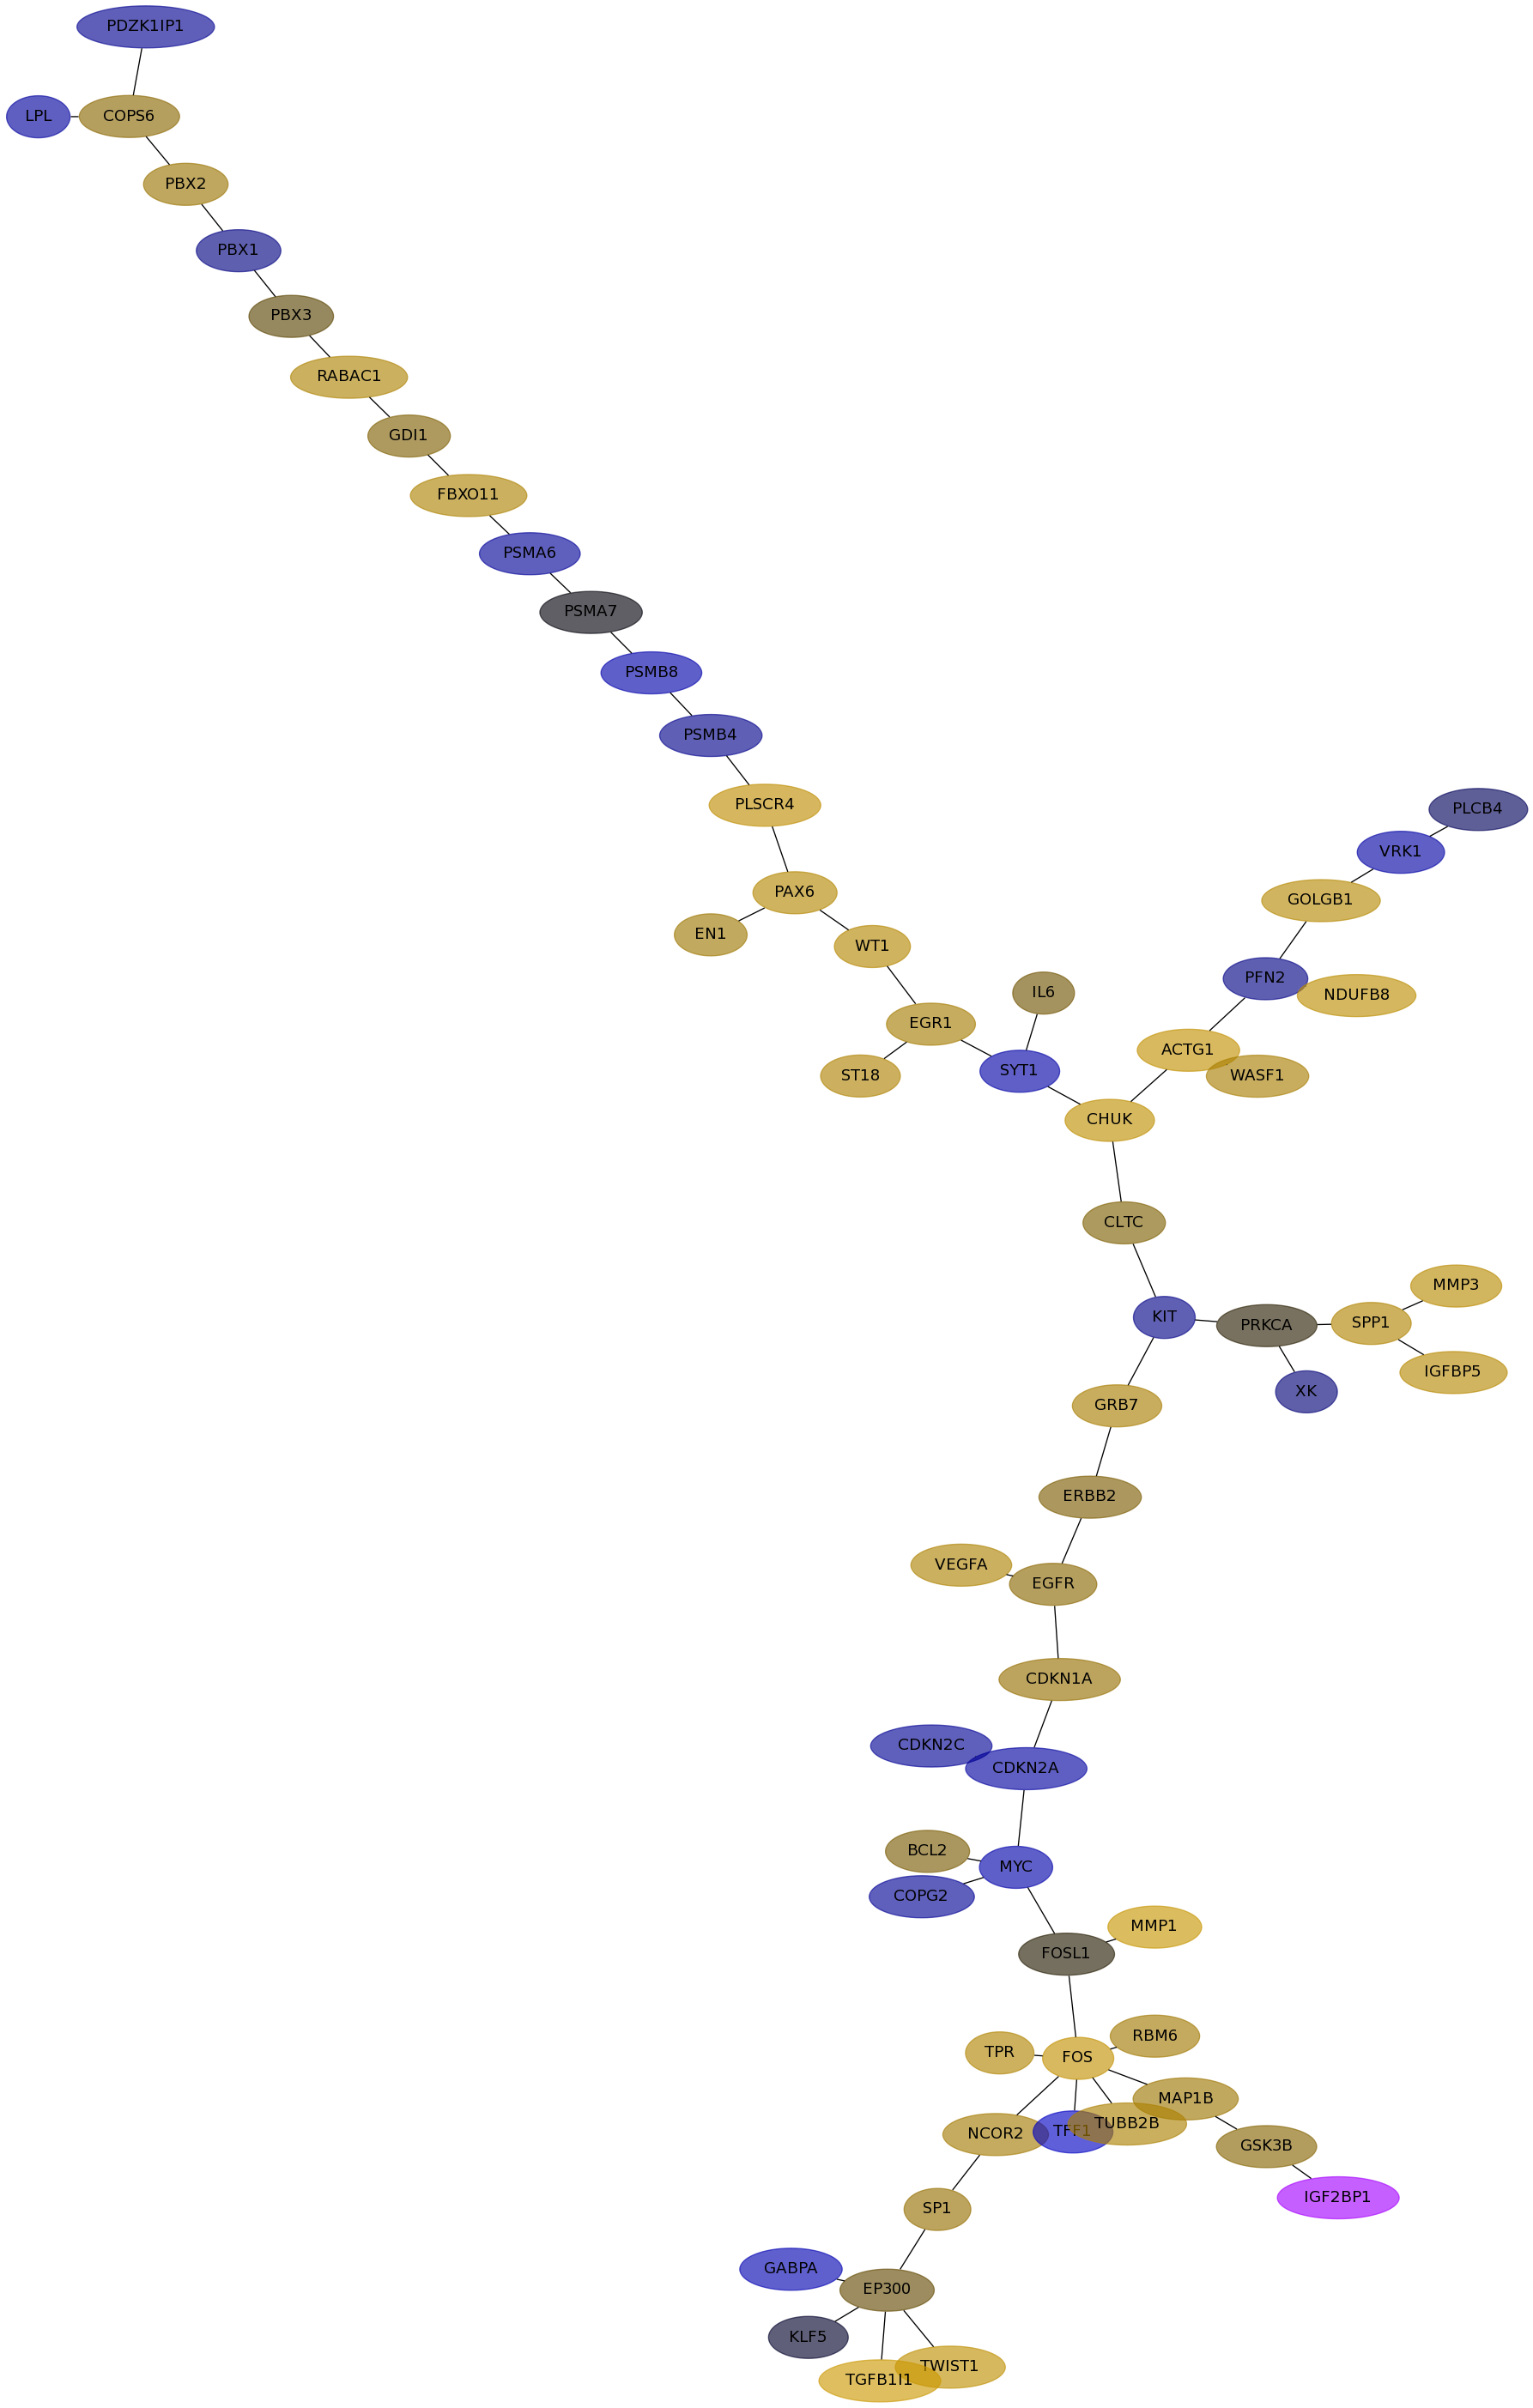
Expression data for subnetwork 6744 in each dataset
IPC |
Loi |
Schmidt |
VanDeVijver |
Wang |
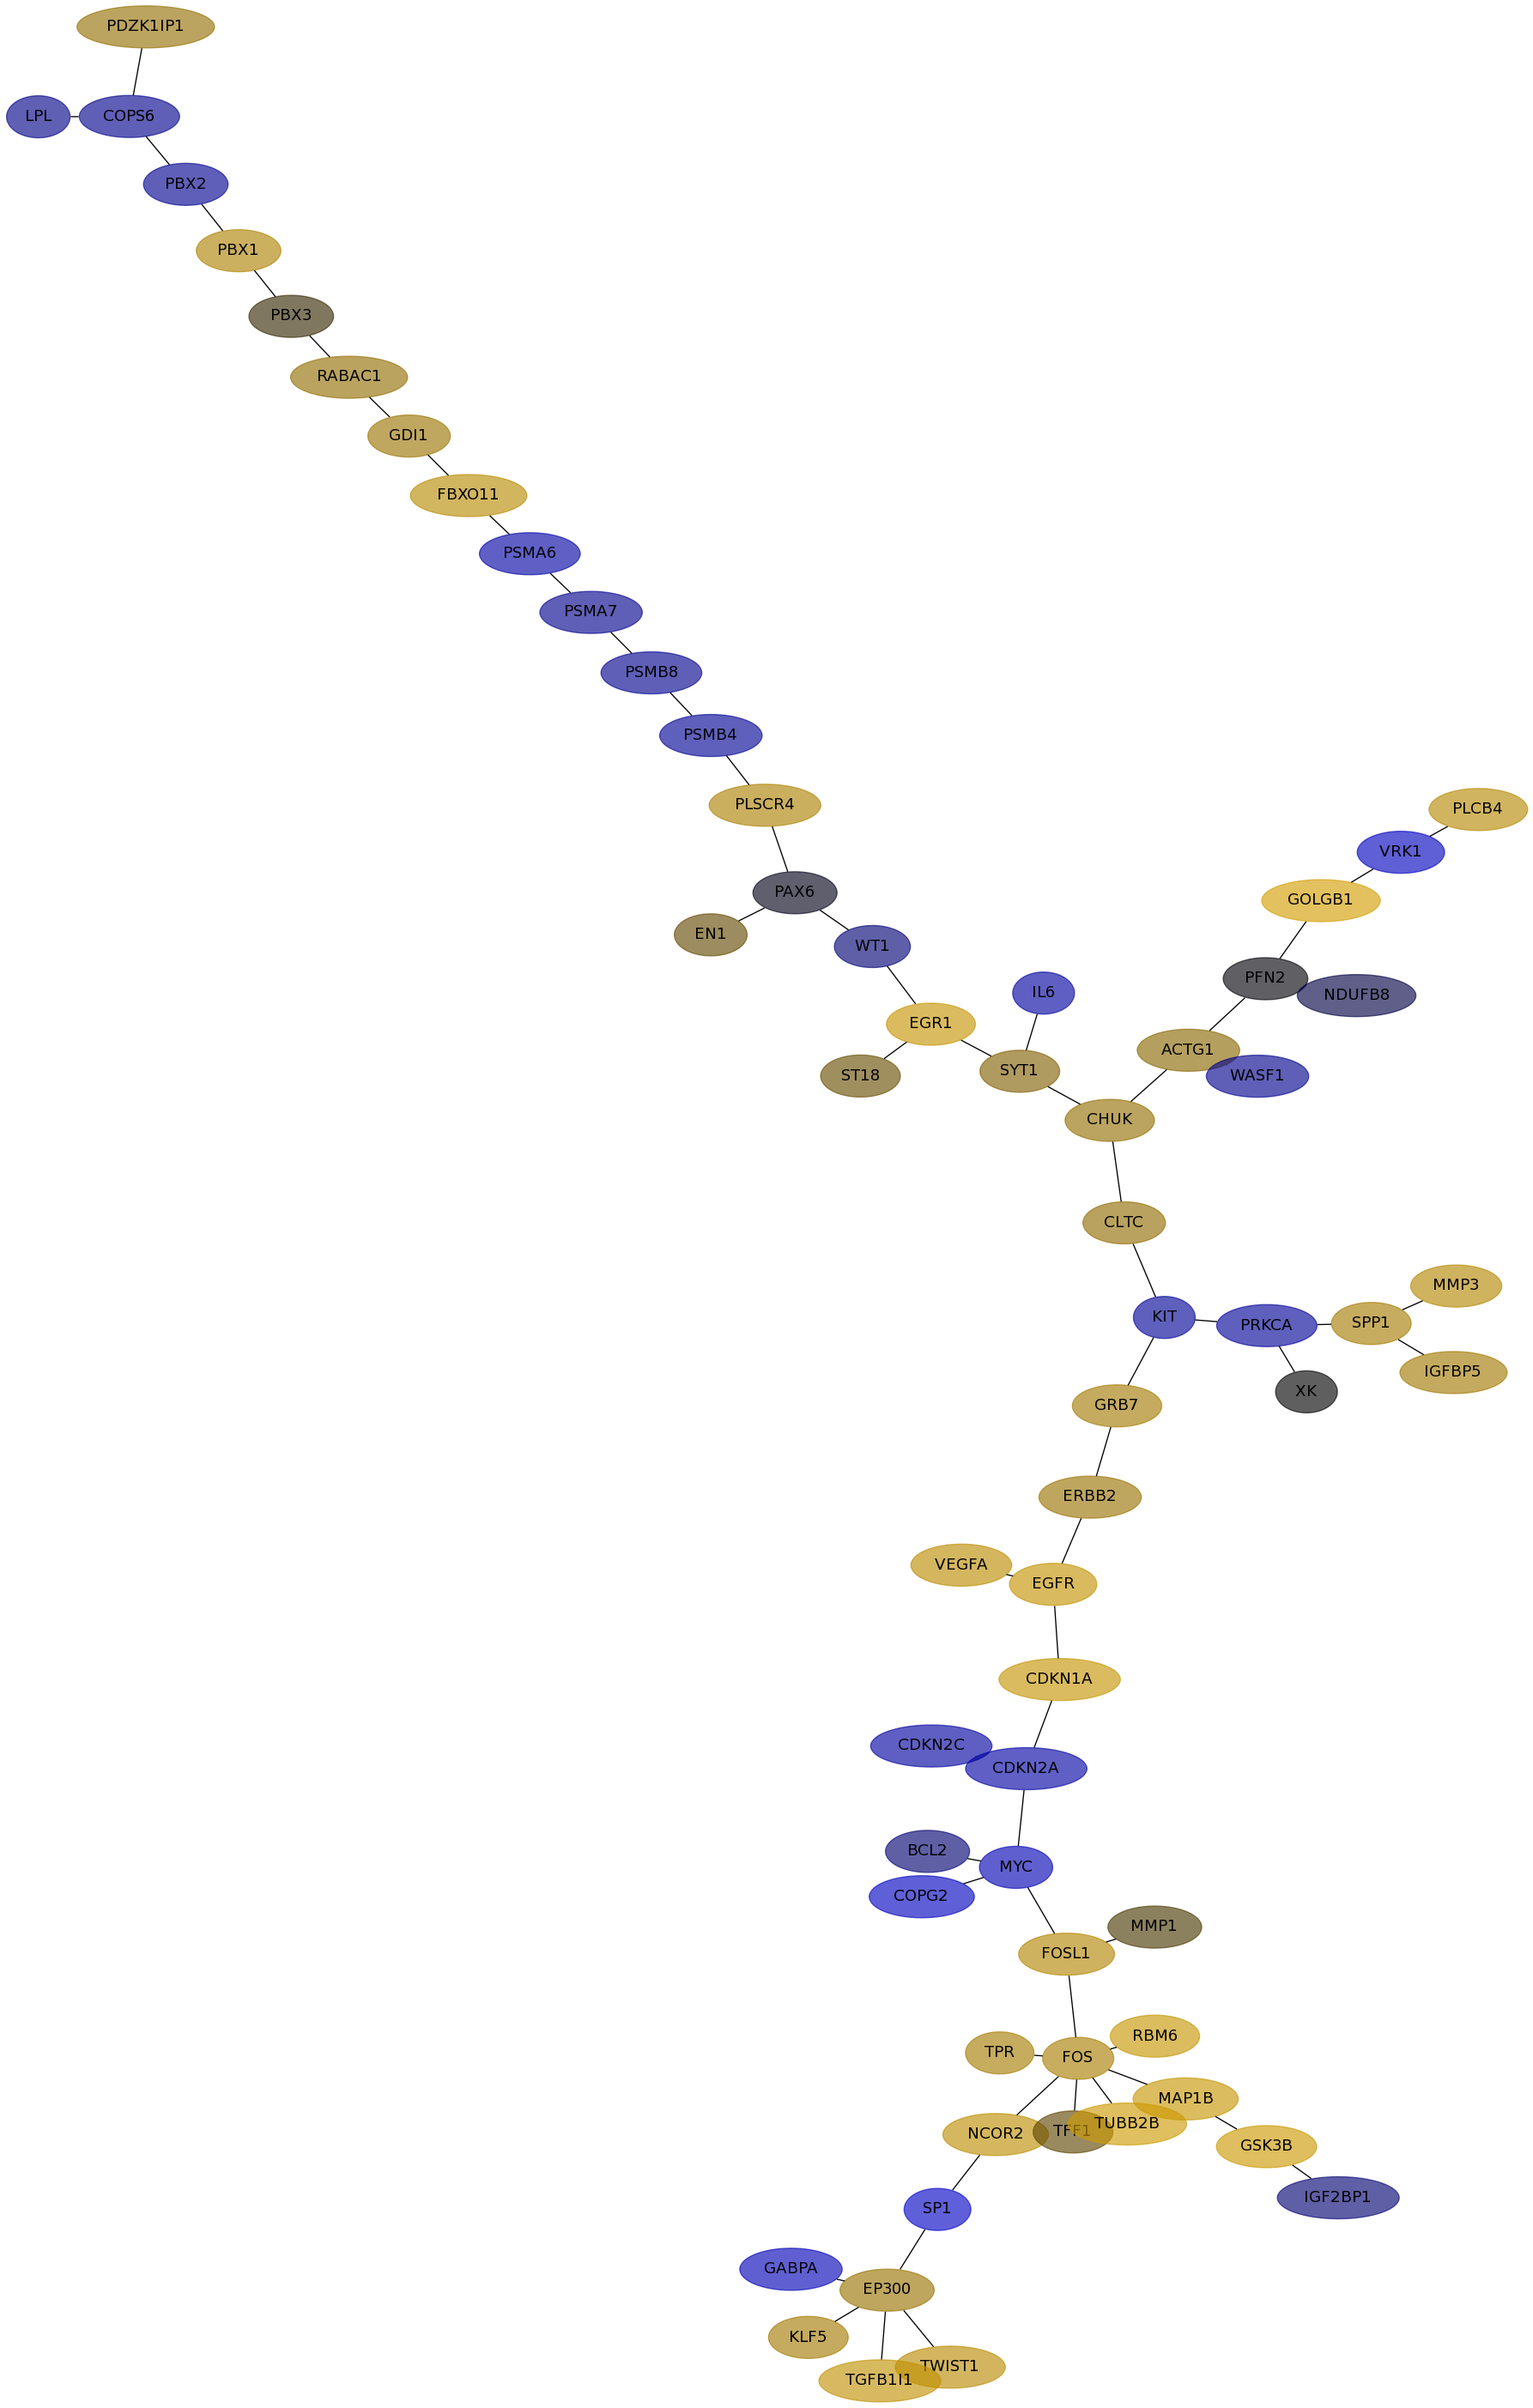
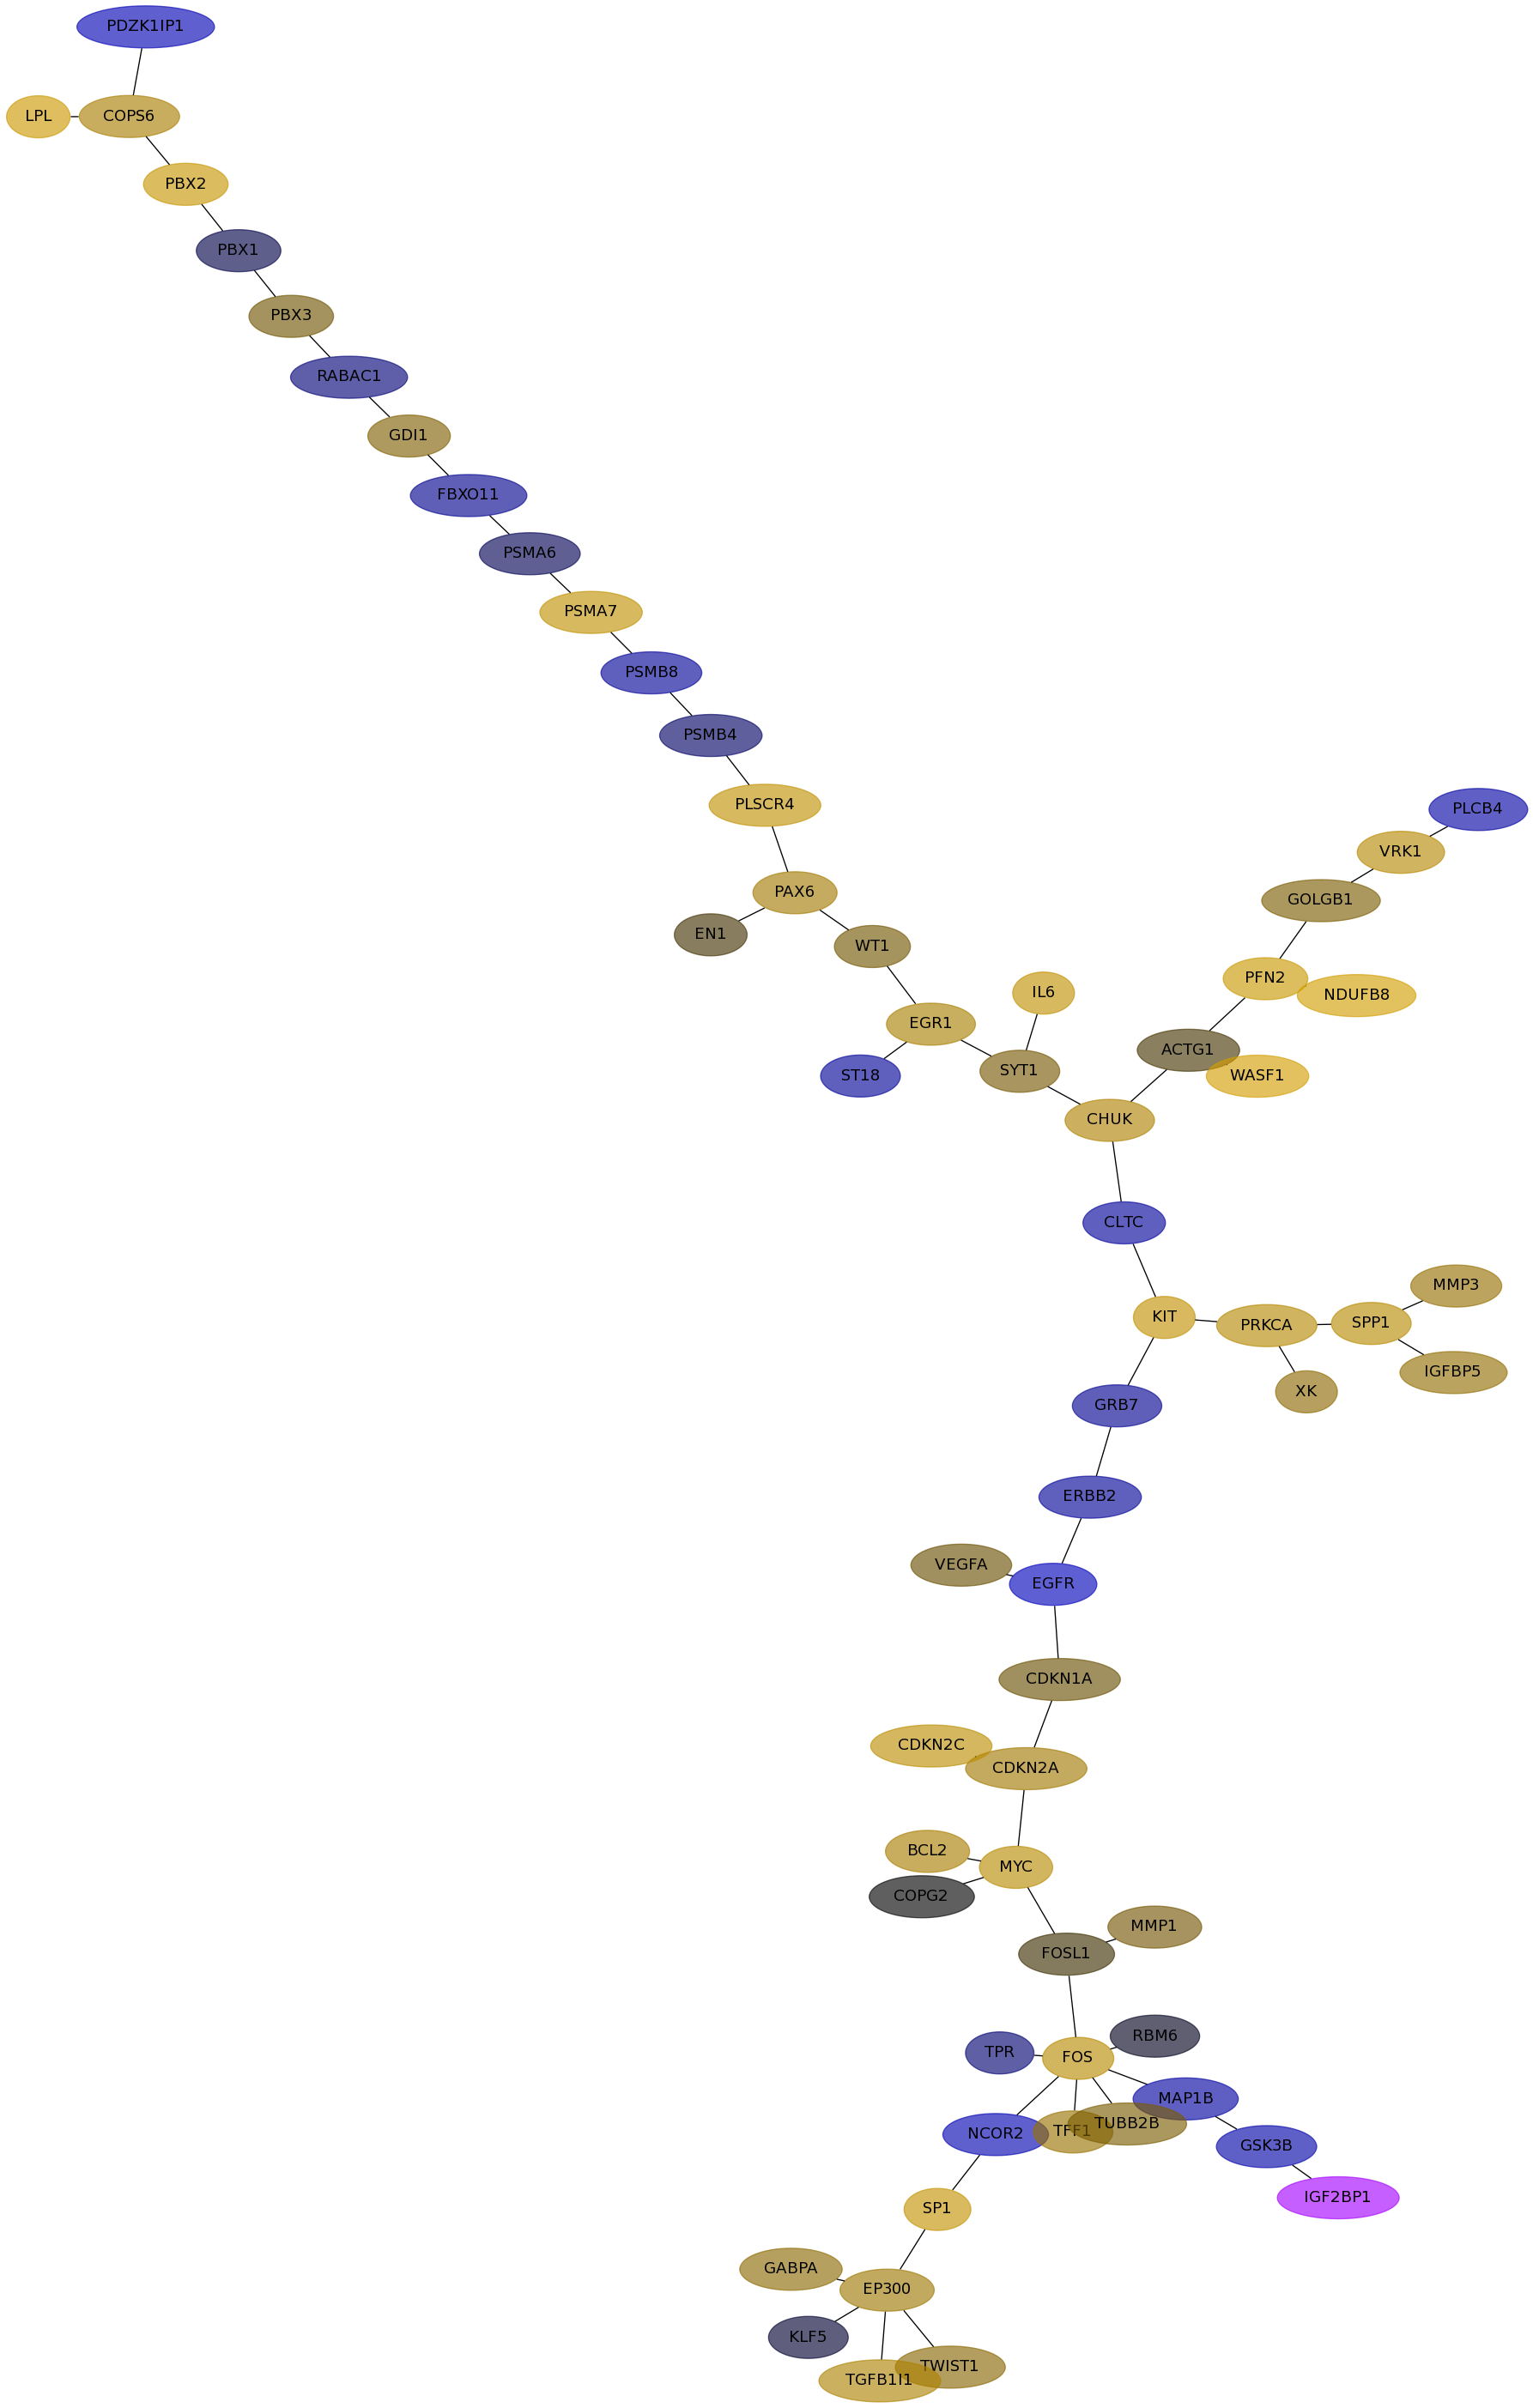
Subnetwork structure for each dataset
- IPC
Score for each gene in subnetwork 6744 in each dataset
| Gene Symbol | Links | Frequency | Frequency Rank | Subnetwork score rank | Global rank |
IPC | Loi | Schmidt | VanDeVijver | Wang |
|---|
| EP300 |   | 113 | 4 | 1 | 4 | -0.149 | 0.087 | 0.102 | 0.052 | 0.025 |
|---|
| NCOR2 | | 32 | 40 | 318 | 290 | -0.096 | 0.211 | -0.163 | 0.158 | 0.114 |
|---|
| PLSCR4 | | 13 | 124 | 318 | 316 | -0.069 | 0.140 | 0.231 | 0.212 | 0.212 |
|---|
| PAX6 | | 22 | 69 | 318 | 312 | 0.259 | -0.003 | 0.112 | undef | 0.168 |
|---|
| EGR1 | | 39 | 29 | 1 | 18 | -0.184 | 0.259 | 0.130 | 0.018 | 0.122 |
|---|
| ACTG1 | | 2 | 743 | 983 | 988 | -0.102 | 0.061 | 0.012 | 0.161 | 0.235 |
|---|
| WASF1 | | 7 | 256 | 1 | 47 | 0.162 | -0.070 | 0.348 | -0.037 | 0.130 |
|---|
| PBX3 | | 2 | 743 | 983 | 988 | 0.065 | 0.008 | 0.034 | 0.103 | 0.021 |
|---|
| ERBB2 | | 141 | 1 | 1 | 1 | -0.103 | 0.092 | -0.090 | 0.267 | 0.046 |
|---|
| PBX1 | | 6 | 301 | 1 | 52 | -0.010 | 0.145 | -0.013 | 0.176 | -0.053 |
|---|
| CHUK | | 6 | 301 | 318 | 330 | 0.173 | 0.080 | 0.152 | undef | 0.215 |
|---|
| CDKN1A | | 110 | 5 | 1 | 5 | 0.064 | 0.254 | 0.030 | undef | 0.082 |
|---|
| PRKCA | | 63 | 15 | 1 | 10 | -0.016 | -0.088 | 0.174 | 0.095 | 0.005 |
|---|
| PFN2 | | 11 | 148 | 141 | 143 | 0.014 | -0.001 | 0.286 | -0.002 | -0.056 |
|---|
| COPG2 | | 4 | 440 | 412 | 419 | -0.058 | -0.232 | 0.000 | 0.086 | -0.081 |
|---|
| GDI1 | | 3 | 557 | 842 | 834 | 0.219 | 0.094 | 0.049 | 0.181 | 0.049 |
|---|
| CDKN2C | | 16 | 104 | 236 | 227 | 0.216 | -0.106 | 0.202 | -0.024 | -0.081 |
|---|
| EN1 | | 10 | 167 | 179 | 194 | 0.196 | 0.024 | 0.011 | -0.016 | 0.102 |
|---|
| SPP1 | | 26 | 52 | 83 | 91 | 0.130 | 0.119 | 0.184 | 0.204 | 0.153 |
|---|
| PSMB8 | | 3 | 557 | 928 | 925 | 0.254 | -0.071 | -0.088 | undef | -0.139 |
|---|
| PSMA6 | | 5 | 360 | 842 | 828 | 0.280 | -0.118 | -0.018 | undef | -0.091 |
|---|
| MYC | | 72 | 10 | 1 | 8 | -0.101 | -0.169 | 0.188 | undef | -0.134 |
|---|
| PSMA7 | | 2 | 743 | 928 | 929 | 0.188 | -0.067 | 0.223 | -0.022 | -0.001 |
|---|
| RBM6 | | 2 | 743 | 570 | 593 | -0.082 | 0.265 | -0.004 | -0.096 | 0.111 |
|---|
| NDUFB8 | | 5 | 360 | 696 | 680 | 0.286 | -0.012 | 0.340 | -0.171 | 0.205 |
|---|
| WT1 | | 33 | 37 | 1 | 21 | 0.254 | -0.039 | 0.036 | undef | 0.172 |
|---|
| ST18 | | 16 | 104 | 236 | 227 | -0.131 | 0.028 | -0.088 | 0.186 | 0.151 |
|---|
| BCL2 | | 37 | 32 | 83 | 82 | -0.077 | -0.035 | 0.128 | -0.106 | 0.043 |
|---|
| TWIST1 | | 50 | 20 | 1 | 14 | 0.044 | 0.194 | 0.061 | undef | 0.219 |
|---|
| IGF2BP1 | | 15 | 111 | 366 | 359 | 0.135 | -0.036 | undef | 0.190 | undef |
|---|
| KIT | | 39 | 29 | 1 | 18 | -0.130 | -0.091 | 0.235 | -0.046 | -0.059 |
|---|
| SP1 | | 72 | 10 | 83 | 77 | 0.222 | -0.254 | 0.239 | 0.020 | 0.082 |
|---|
| PSMB4 | | 2 | 743 | 983 | 988 | 0.281 | -0.082 | -0.027 | -0.147 | -0.066 |
|---|
| GABPA | | 23 | 66 | 696 | 665 | 0.033 | -0.183 | 0.066 | 0.141 | -0.161 |
|---|
| MMP1 | | 11 | 148 | 366 | 360 | 0.192 | 0.014 | 0.036 | 0.044 | 0.260 |
|---|
| RABAC1 | | 1 | 1195 | 983 | 1017 | 0.138 | 0.077 | -0.040 | 0.156 | 0.146 |
|---|
| VEGFA | | 68 | 14 | 83 | 78 | 0.090 | 0.200 | 0.030 | 0.095 | 0.148 |
|---|
| FOS | | 42 | 27 | 1 | 17 | -0.137 | 0.129 | 0.185 | -0.144 | 0.234 |
|---|
| SYT1 | | 11 | 148 | 1 | 39 | -0.079 | 0.051 | 0.038 | 0.189 | -0.124 |
|---|
| EGFR | | 117 | 3 | 1 | 3 | -0.195 | 0.240 | -0.205 | -0.187 | 0.065 |
|---|
| XK | | 18 | 86 | 179 | 187 | 0.154 | -0.000 | 0.067 | -0.123 | -0.040 |
|---|
| PBX2 | | 5 | 360 | 1 | 56 | -0.122 | -0.073 | 0.264 | -0.095 | 0.092 |
|---|
| MAP1B | | 69 | 12 | 1 | 9 | -0.123 | 0.263 | -0.107 | 0.304 | 0.100 |
|---|
| FBXO11 | | 5 | 360 | 457 | 455 | 0.027 | 0.186 | -0.069 | 0.238 | 0.149 |
|---|
| TFF1 | | 7 | 256 | 957 | 928 | 0.106 | 0.022 | 0.088 | -0.033 | -0.244 |
|---|
| TPR | | 11 | 148 | 727 | 701 | -0.130 | 0.120 | -0.036 | -0.085 | 0.156 |
|---|
| MMP3 | | 6 | 301 | 179 | 205 | 0.121 | 0.171 | 0.081 | 0.198 | 0.192 |
|---|
| IL6 | | 9 | 196 | 366 | 365 | 0.257 | -0.106 | 0.226 | 0.024 | 0.035 |
|---|
| GRB7 | | 58 | 18 | 1 | 12 | 0.021 | 0.115 | -0.072 | 0.229 | 0.129 |
|---|
| IGFBP5 | | 48 | 23 | 83 | 80 | -0.076 | 0.110 | 0.074 | 0.278 | 0.181 |
|---|
| CLTC | | 3 | 557 | 983 | 979 | -0.155 | 0.072 | -0.095 | 0.179 | 0.048 |
|---|
| PDZK1IP1 | | 1 | 1195 | 983 | 1017 | 0.026 | 0.080 | -0.166 | 0.021 | -0.075 |
|---|
| PLCB4 | | 4 | 440 | 928 | 912 | 0.074 | 0.179 | -0.113 | 0.248 | -0.020 |
|---|
| TUBB2B | | 13 | 124 | 141 | 141 | -0.036 | 0.304 | 0.045 | 0.187 | 0.139 |
|---|
| GSK3B | | 79 | 8 | 179 | 169 | -0.130 | 0.292 | -0.129 | 0.291 | 0.057 |
|---|
| LPL | | 13 | 124 | 236 | 230 | -0.102 | -0.062 | 0.292 | 0.087 | -0.105 |
|---|
| KLF5 | | 76 | 9 | 1 | 7 | 0.077 | 0.117 | -0.007 | -0.110 | -0.006 |
|---|
| COPS6 | | 16 | 104 | 1 | 31 | 0.147 | -0.068 | 0.128 | 0.216 | 0.065 |
|---|
| FOSL1 | | 11 | 148 | 366 | 360 | -0.040 | 0.164 | 0.010 | 0.128 | 0.005 |
|---|
| VRK1 | | 1 | 1195 | 983 | 1017 | 0.169 | -0.212 | 0.178 | undef | -0.120 |
|---|
| CDKN2A | | 60 | 17 | 1 | 11 | 0.263 | -0.113 | 0.111 | undef | -0.105 |
|---|
| TGFB1I1 | | 49 | 22 | 1 | 16 | -0.105 | 0.229 | 0.143 | 0.195 | 0.298 |
|---|
| GOLGB1 | | 3 | 557 | 983 | 979 | 0.104 | 0.352 | 0.044 | 0.079 | 0.175 |
|---|
GO Enrichment output for subnetwork 6744 in each dataset
| Name | Accession Number | Link | P-val | Corrected P-val |
|---|
| sarcomere organization | GO:0045214 |  | 2.403E-16 | 5.87E-13 |
|---|
| myofibril assembly | GO:0030239 | | 6.707E-15 | 8.192E-12 |
|---|
| muscle cell development | GO:0055001 | | 1.305E-14 | 1.063E-11 |
|---|
| response to calcium ion | GO:0051592 | | 1.499E-14 | 9.154E-12 |
|---|
| actomyosin structure organization | GO:0031032 | | 5.68E-14 | 2.775E-11 |
|---|
| cellular component assembly involved in morphogenesis | GO:0010927 | | 7.415E-14 | 3.019E-11 |
|---|
| response to metal ion | GO:0010038 | | 1.232E-13 | 4.301E-11 |
|---|
| striated muscle cell differentiation | GO:0051146 | | 2.518E-13 | 7.688E-11 |
|---|
| response to inorganic substance | GO:0010035 | | 2.699E-13 | 7.326E-11 |
|---|
| muscle cell differentiation | GO:0042692 | | 1.01E-10 | 2.467E-08 |
|---|
| negative regulation of phosphorylation | GO:0042326 | | 8.502E-10 | 1.888E-07 |
|---|
| Name | Accession Number | Link | P-val | Corrected P-val |
|---|
| sarcomere organization | GO:0045214 | | 5.096E-16 | 1.226E-12 |
|---|
| myofibril assembly | GO:0030239 | | 1.419E-14 | 1.707E-11 |
|---|
| response to calcium ion | GO:0051592 | | 2.172E-14 | 1.742E-11 |
|---|
| muscle cell development | GO:0055001 | | 2.759E-14 | 1.66E-11 |
|---|
| cellular component assembly involved in morphogenesis | GO:0010927 | | 1.199E-13 | 5.77E-11 |
|---|
| actomyosin structure organization | GO:0031032 | | 1.199E-13 | 4.808E-11 |
|---|
| response to metal ion | GO:0010038 | | 1.729E-13 | 5.943E-11 |
|---|
| response to inorganic substance | GO:0010035 | | 3.939E-13 | 1.185E-10 |
|---|
| striated muscle cell differentiation | GO:0051146 | | 5.304E-13 | 1.418E-10 |
|---|
| muscle cell differentiation | GO:0042692 | | 1.876E-10 | 4.514E-08 |
|---|
| negative regulation of phosphorylation | GO:0042326 | | 1.406E-09 | 3.076E-07 |
|---|
| Name | Accession Number | Link | P-val | Corrected P-val |
|---|
| sarcomere organization | GO:0045214 | | 1.589E-15 | 3.654E-12 |
|---|
| myofibril assembly | GO:0030239 | | 7.712E-14 | 8.869E-11 |
|---|
| response to calcium ion | GO:0051592 | | 7.992E-14 | 6.127E-11 |
|---|
| muscle cell development | GO:0055001 | | 1.63E-13 | 9.372E-11 |
|---|
| cellular component assembly involved in morphogenesis | GO:0010927 | | 3.245E-13 | 1.493E-10 |
|---|
| actomyosin structure organization | GO:0031032 | | 6.139E-13 | 2.353E-10 |
|---|
| response to metal ion | GO:0010038 | | 1.055E-12 | 3.465E-10 |
|---|
| response to inorganic substance | GO:0010035 | | 2.322E-12 | 6.676E-10 |
|---|
| striated muscle cell differentiation | GO:0051146 | | 2.524E-12 | 6.451E-10 |
|---|
| muscle cell differentiation | GO:0042692 | | 9.61E-10 | 2.21E-07 |
|---|
| negative regulation of phosphorylation | GO:0042326 | | 6.897E-09 | 1.442E-06 |
|---|
VanDeVijver file
| Name | Accession Number | Link | P-val | Corrected P-val |
|---|
| positive regulation of epithelial cell proliferation | GO:0050679 | | 1.668E-06 | 3.073E-03 |
|---|
| positive regulation of cell migration | GO:0030335 | | 3.452E-06 | 3.181E-03 |
|---|
| regulation of smooth muscle cell proliferation | GO:0048660 | | 3.907E-06 | 2.4E-03 |
|---|
| pigmentation | GO:0043473 | | 3.907E-06 | 1.8E-03 |
|---|
| positive regulation of cell motion | GO:0051272 | | 5.194E-06 | 1.915E-03 |
|---|
| peptidyl-serine phosphorylation | GO:0018105 | | 5.518E-06 | 1.695E-03 |
|---|
| regulation of cell migration | GO:0030334 | | 6.593E-06 | 1.736E-03 |
|---|
| G1/S transition of mitotic cell cycle | GO:0000082 | | 9.635E-06 | 2.22E-03 |
|---|
| regulation of locomotion | GO:0040012 | | 1.229E-05 | 2.518E-03 |
|---|
| regulation of cell motion | GO:0051270 | | 1.229E-05 | 2.266E-03 |
|---|
| negative regulation of bone remodeling | GO:0046851 | | 1.53E-05 | 2.564E-03 |
|---|
| Name | Accession Number | Link | P-val | Corrected P-val |
|---|
| sarcomere organization | GO:0045214 | | 1.589E-15 | 3.654E-12 |
|---|
| myofibril assembly | GO:0030239 | | 7.712E-14 | 8.869E-11 |
|---|
| response to calcium ion | GO:0051592 | | 7.992E-14 | 6.127E-11 |
|---|
| muscle cell development | GO:0055001 | | 1.63E-13 | 9.372E-11 |
|---|
| cellular component assembly involved in morphogenesis | GO:0010927 | | 3.245E-13 | 1.493E-10 |
|---|
| actomyosin structure organization | GO:0031032 | | 6.139E-13 | 2.353E-10 |
|---|
| response to metal ion | GO:0010038 | | 1.055E-12 | 3.465E-10 |
|---|
| response to inorganic substance | GO:0010035 | | 2.322E-12 | 6.676E-10 |
|---|
| striated muscle cell differentiation | GO:0051146 | | 2.524E-12 | 6.451E-10 |
|---|
| muscle cell differentiation | GO:0042692 | | 9.61E-10 | 2.21E-07 |
|---|
| negative regulation of phosphorylation | GO:0042326 | | 6.897E-09 | 1.442E-06 |
|---|

