Study Desmedt-ER-neg
Study informations
165 subnetworks in total page | file
2310 genes associated page | file
Enriched GO terms page
General informations
General Index page
Study Index page
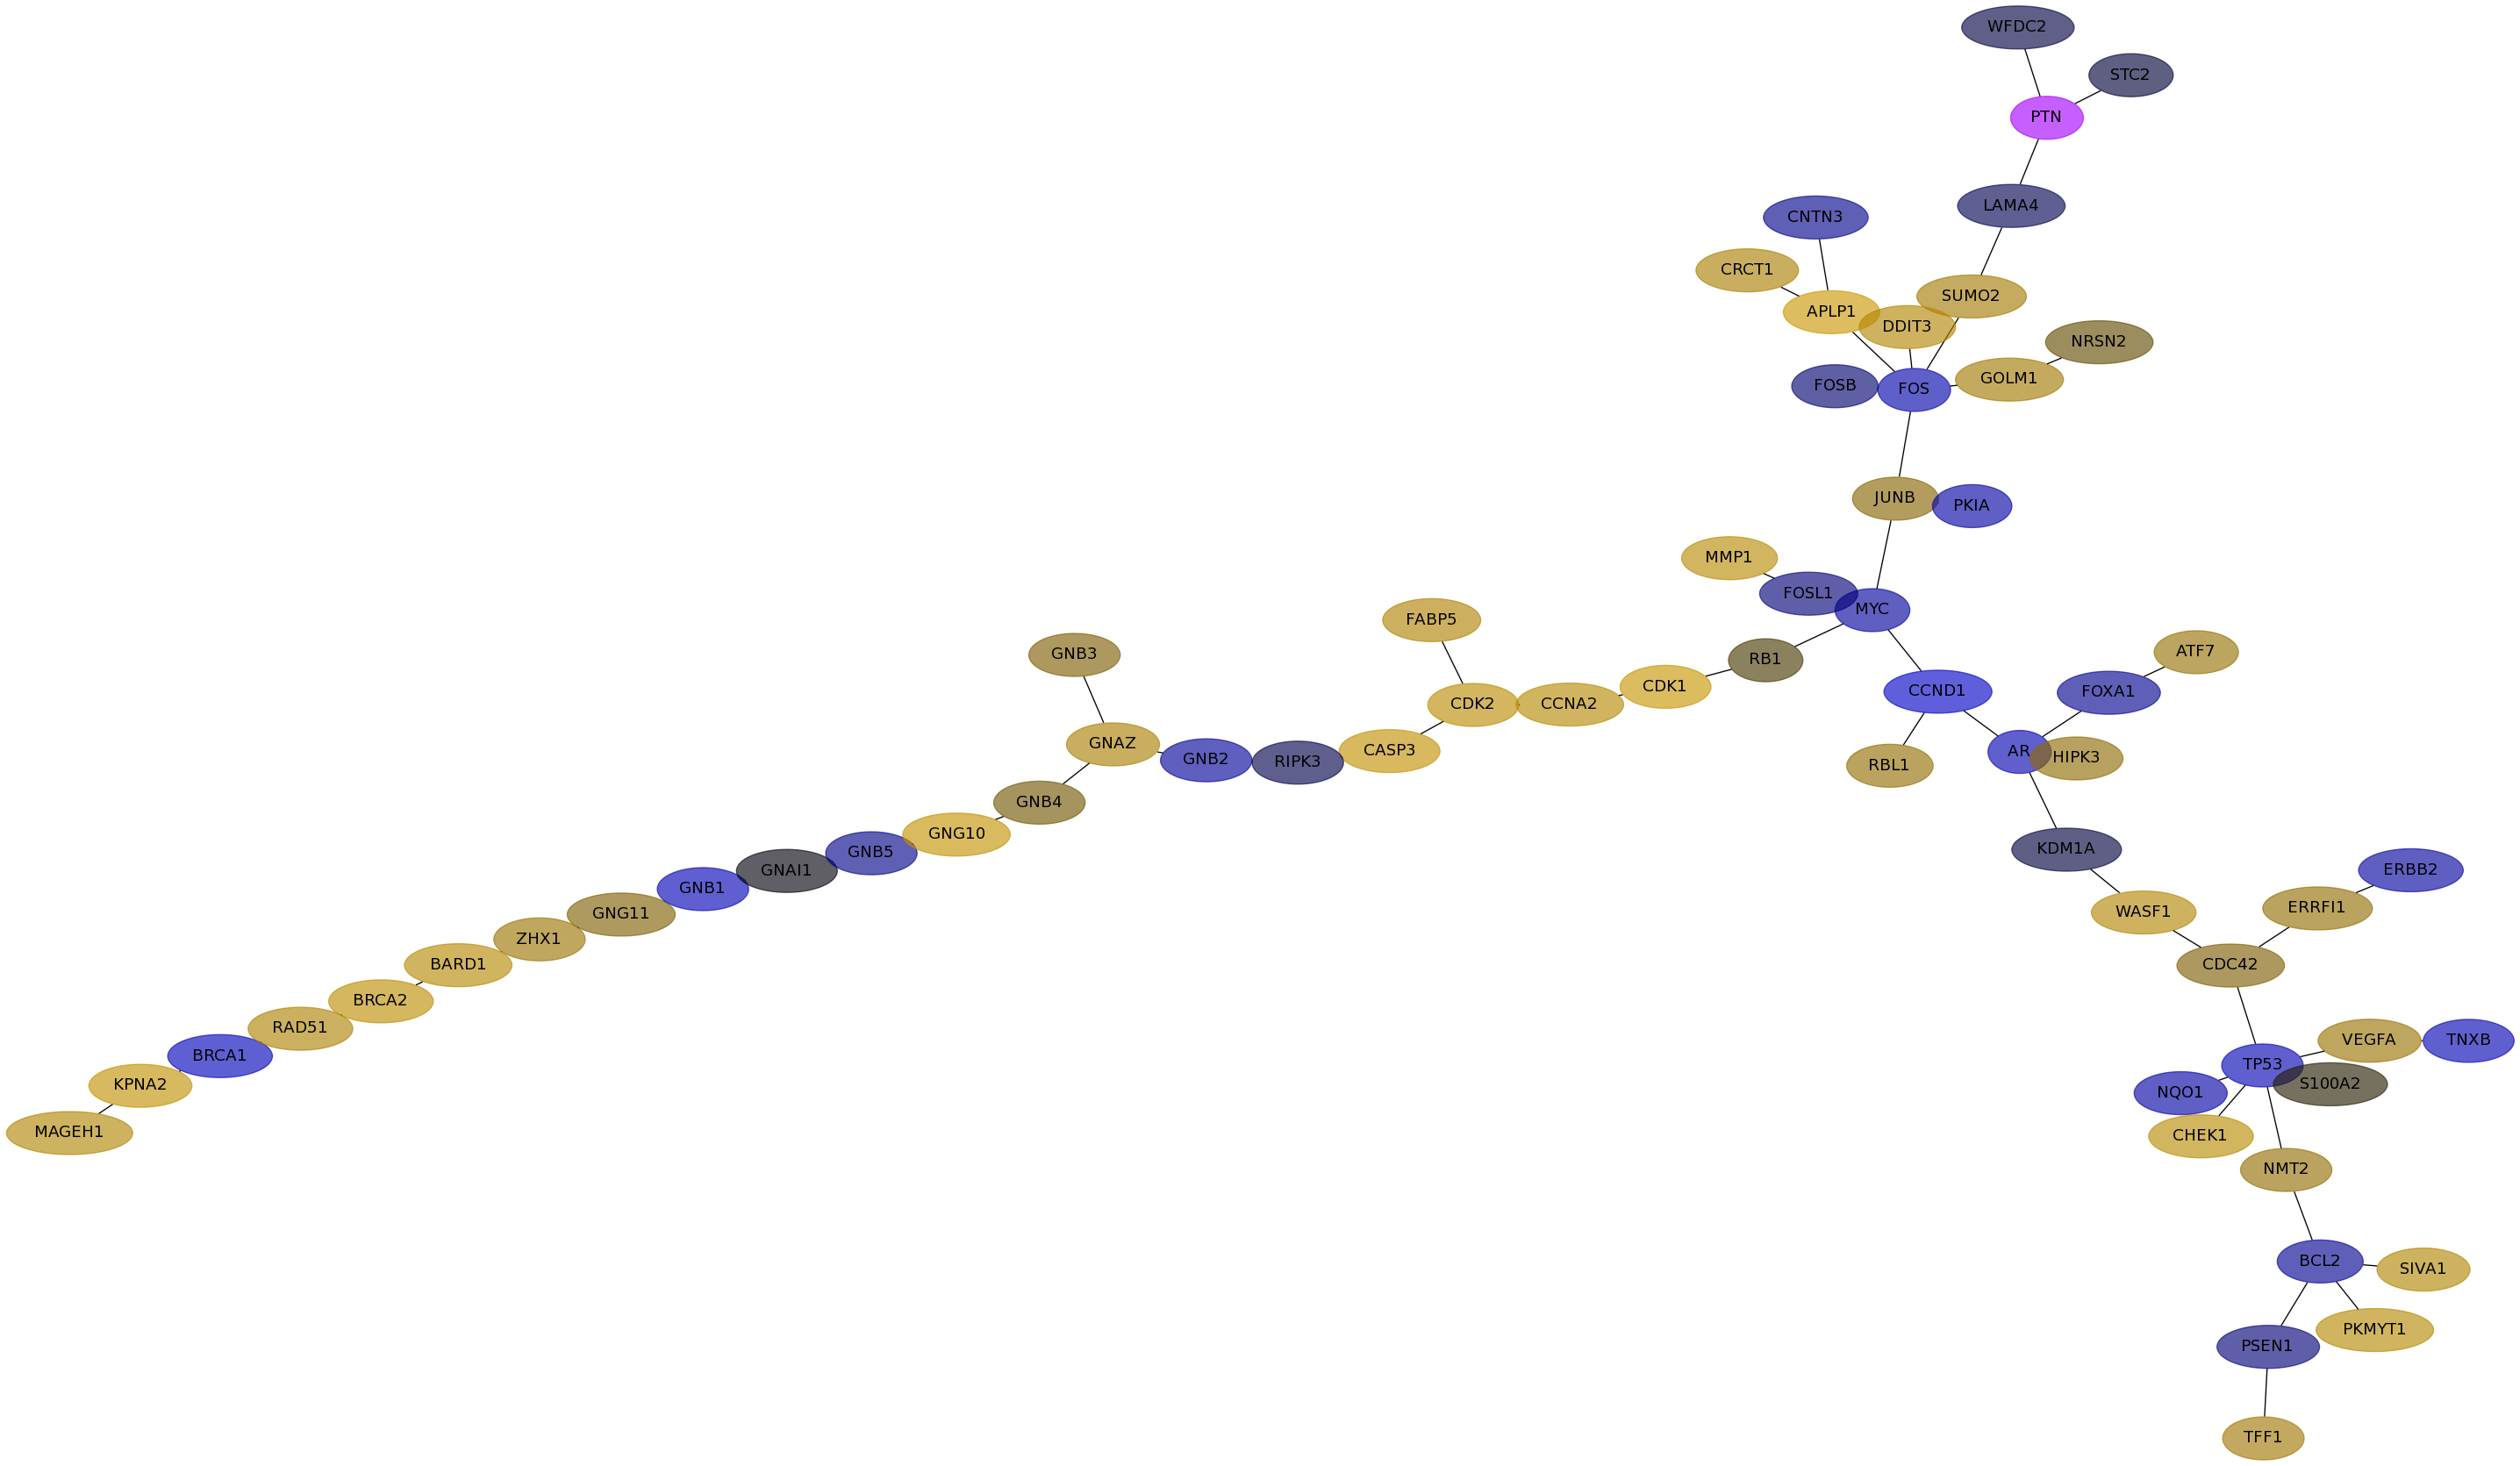
Subnetwork 6557
score
| Dataset | Score | P-val 1 | P-val 2 | P-val 3 | Fisher Score |
|---|
| IPC | 0.7544 | 3.482e-03 | 5.650e-04 | 7.693e-01 | 1.514e-06 |
|---|
| Loi | 0.2307 | 7.969e-02 | 1.121e-02 | 4.268e-01 | 3.812e-04 |
|---|
| Schmidt | 0.6729 | 0.000e+00 | 0.000e+00 | 4.550e-02 | 0.000e+00 |
|---|
| VanDeVijver | 0.7908 | 0.000e+00 | 0.000e+00 | 3.459e-03 | 0.000e+00 |
|---|
| Wang | 0.2617 | 2.659e-03 | 4.364e-02 | 3.955e-01 | 4.589e-05 |
|---|
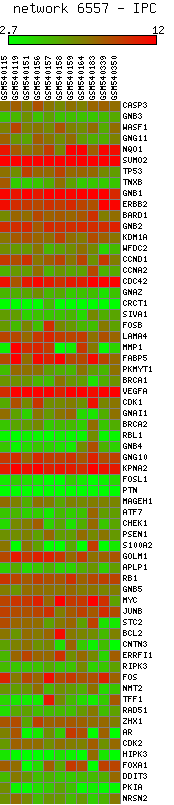
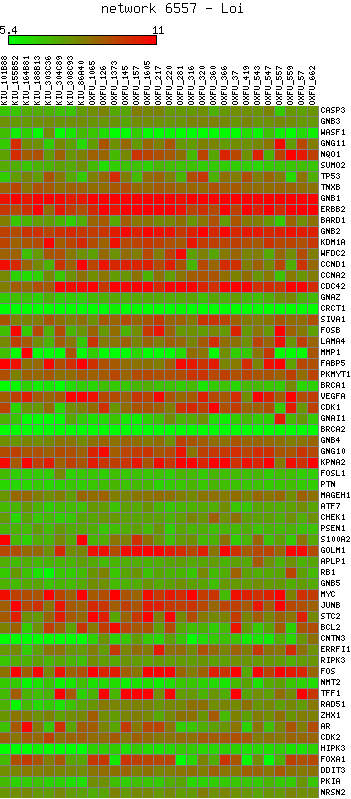
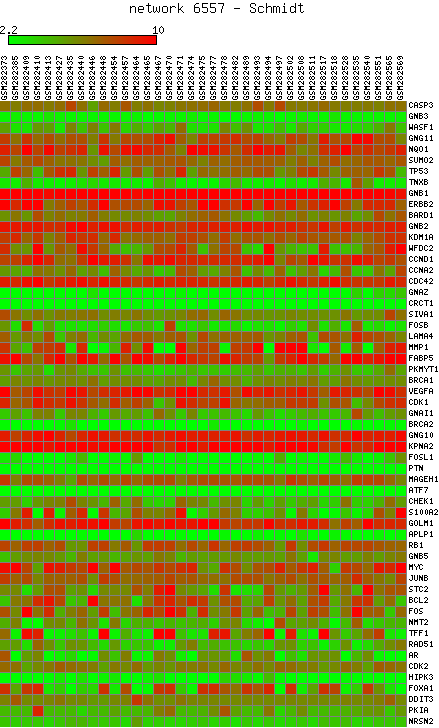
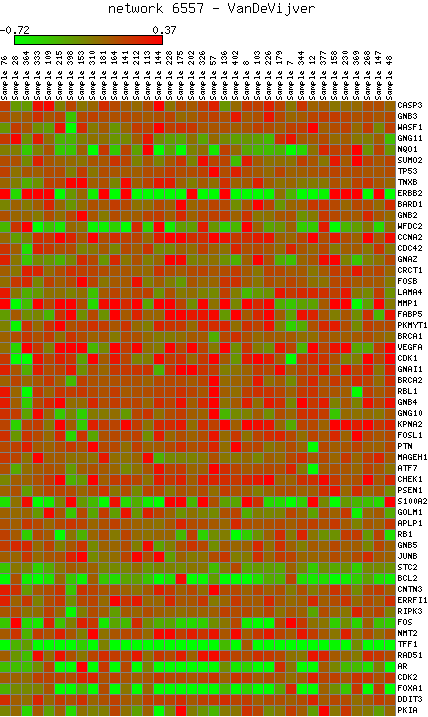
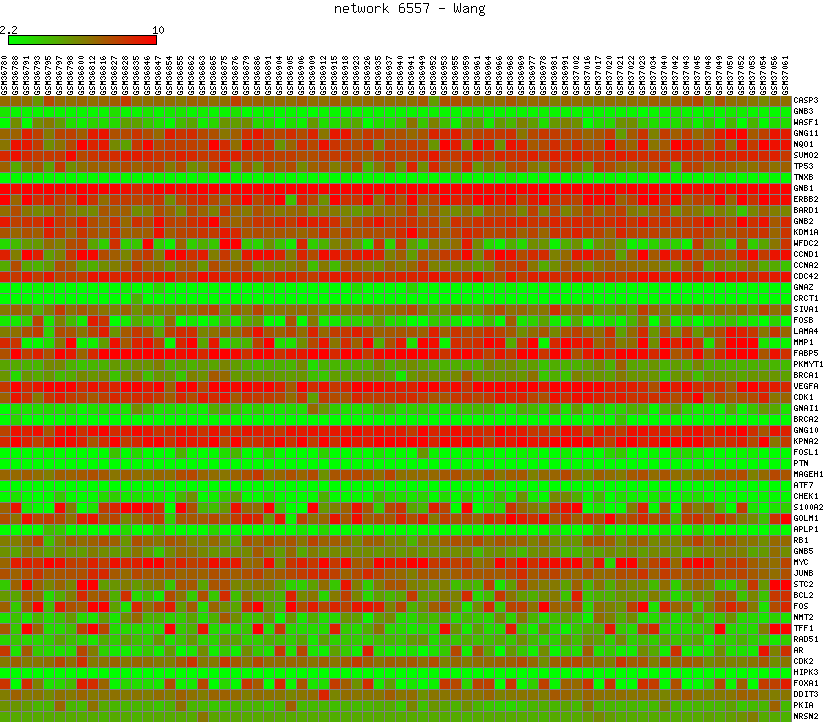
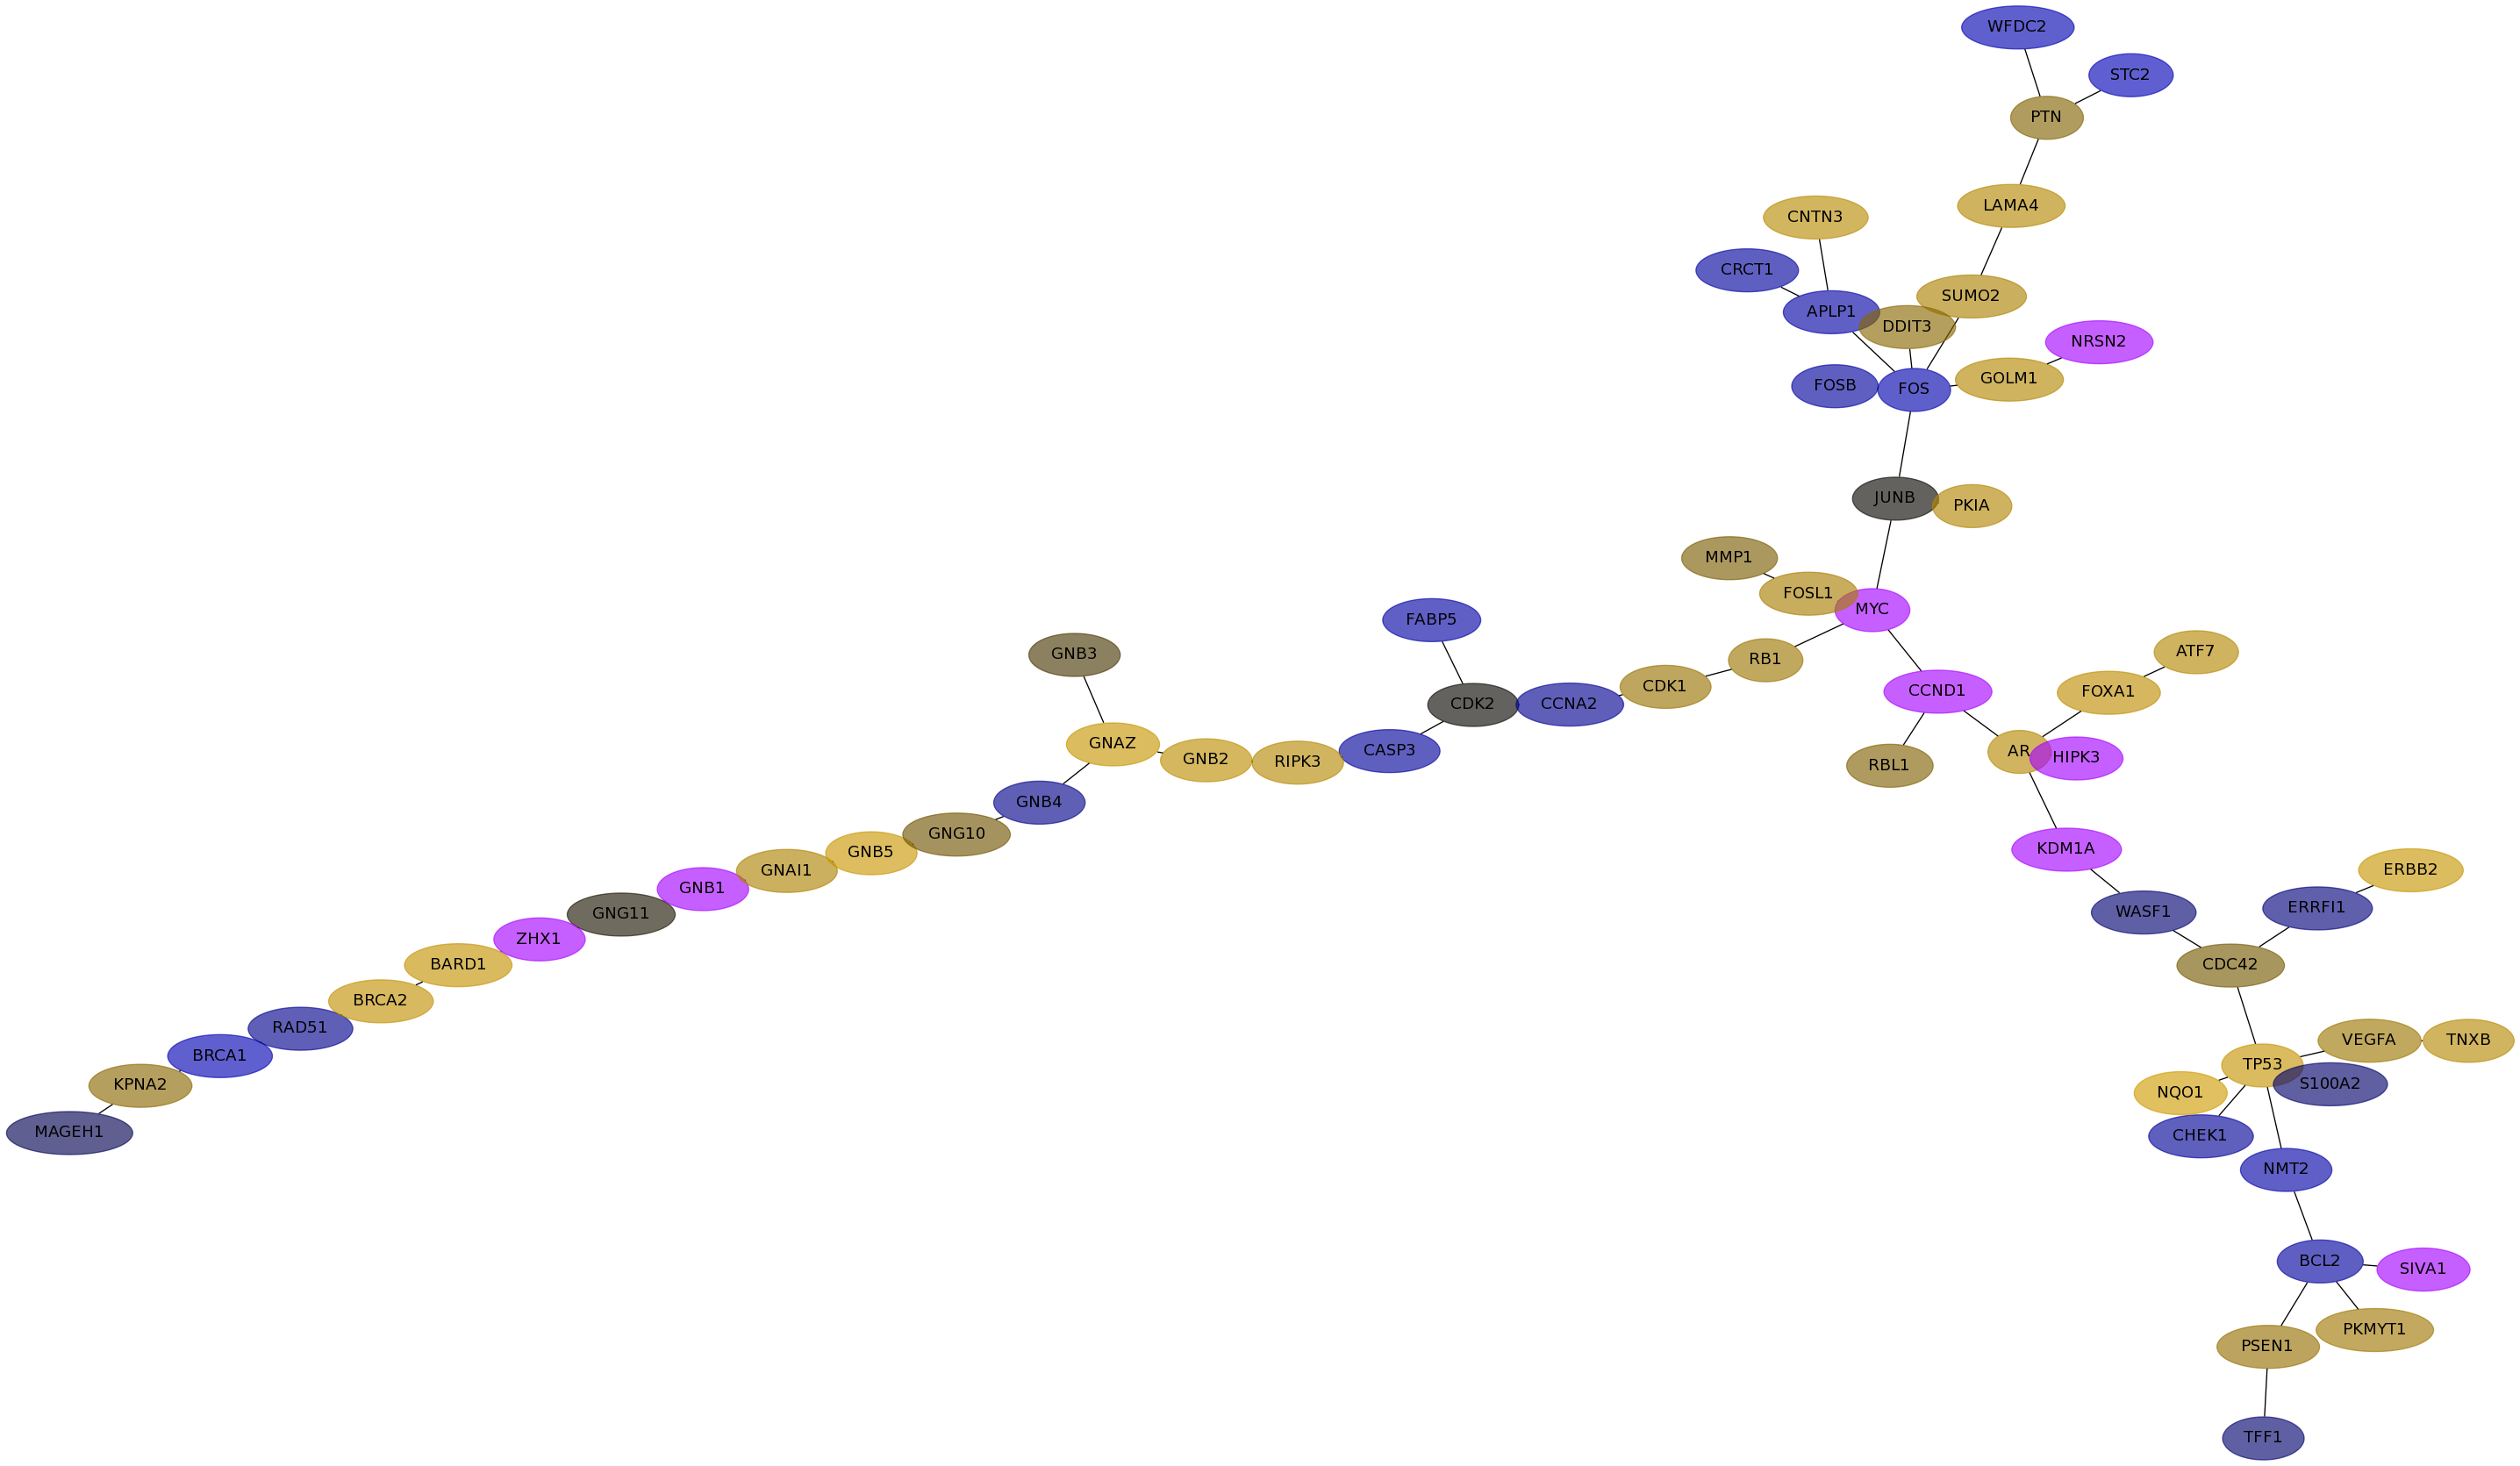
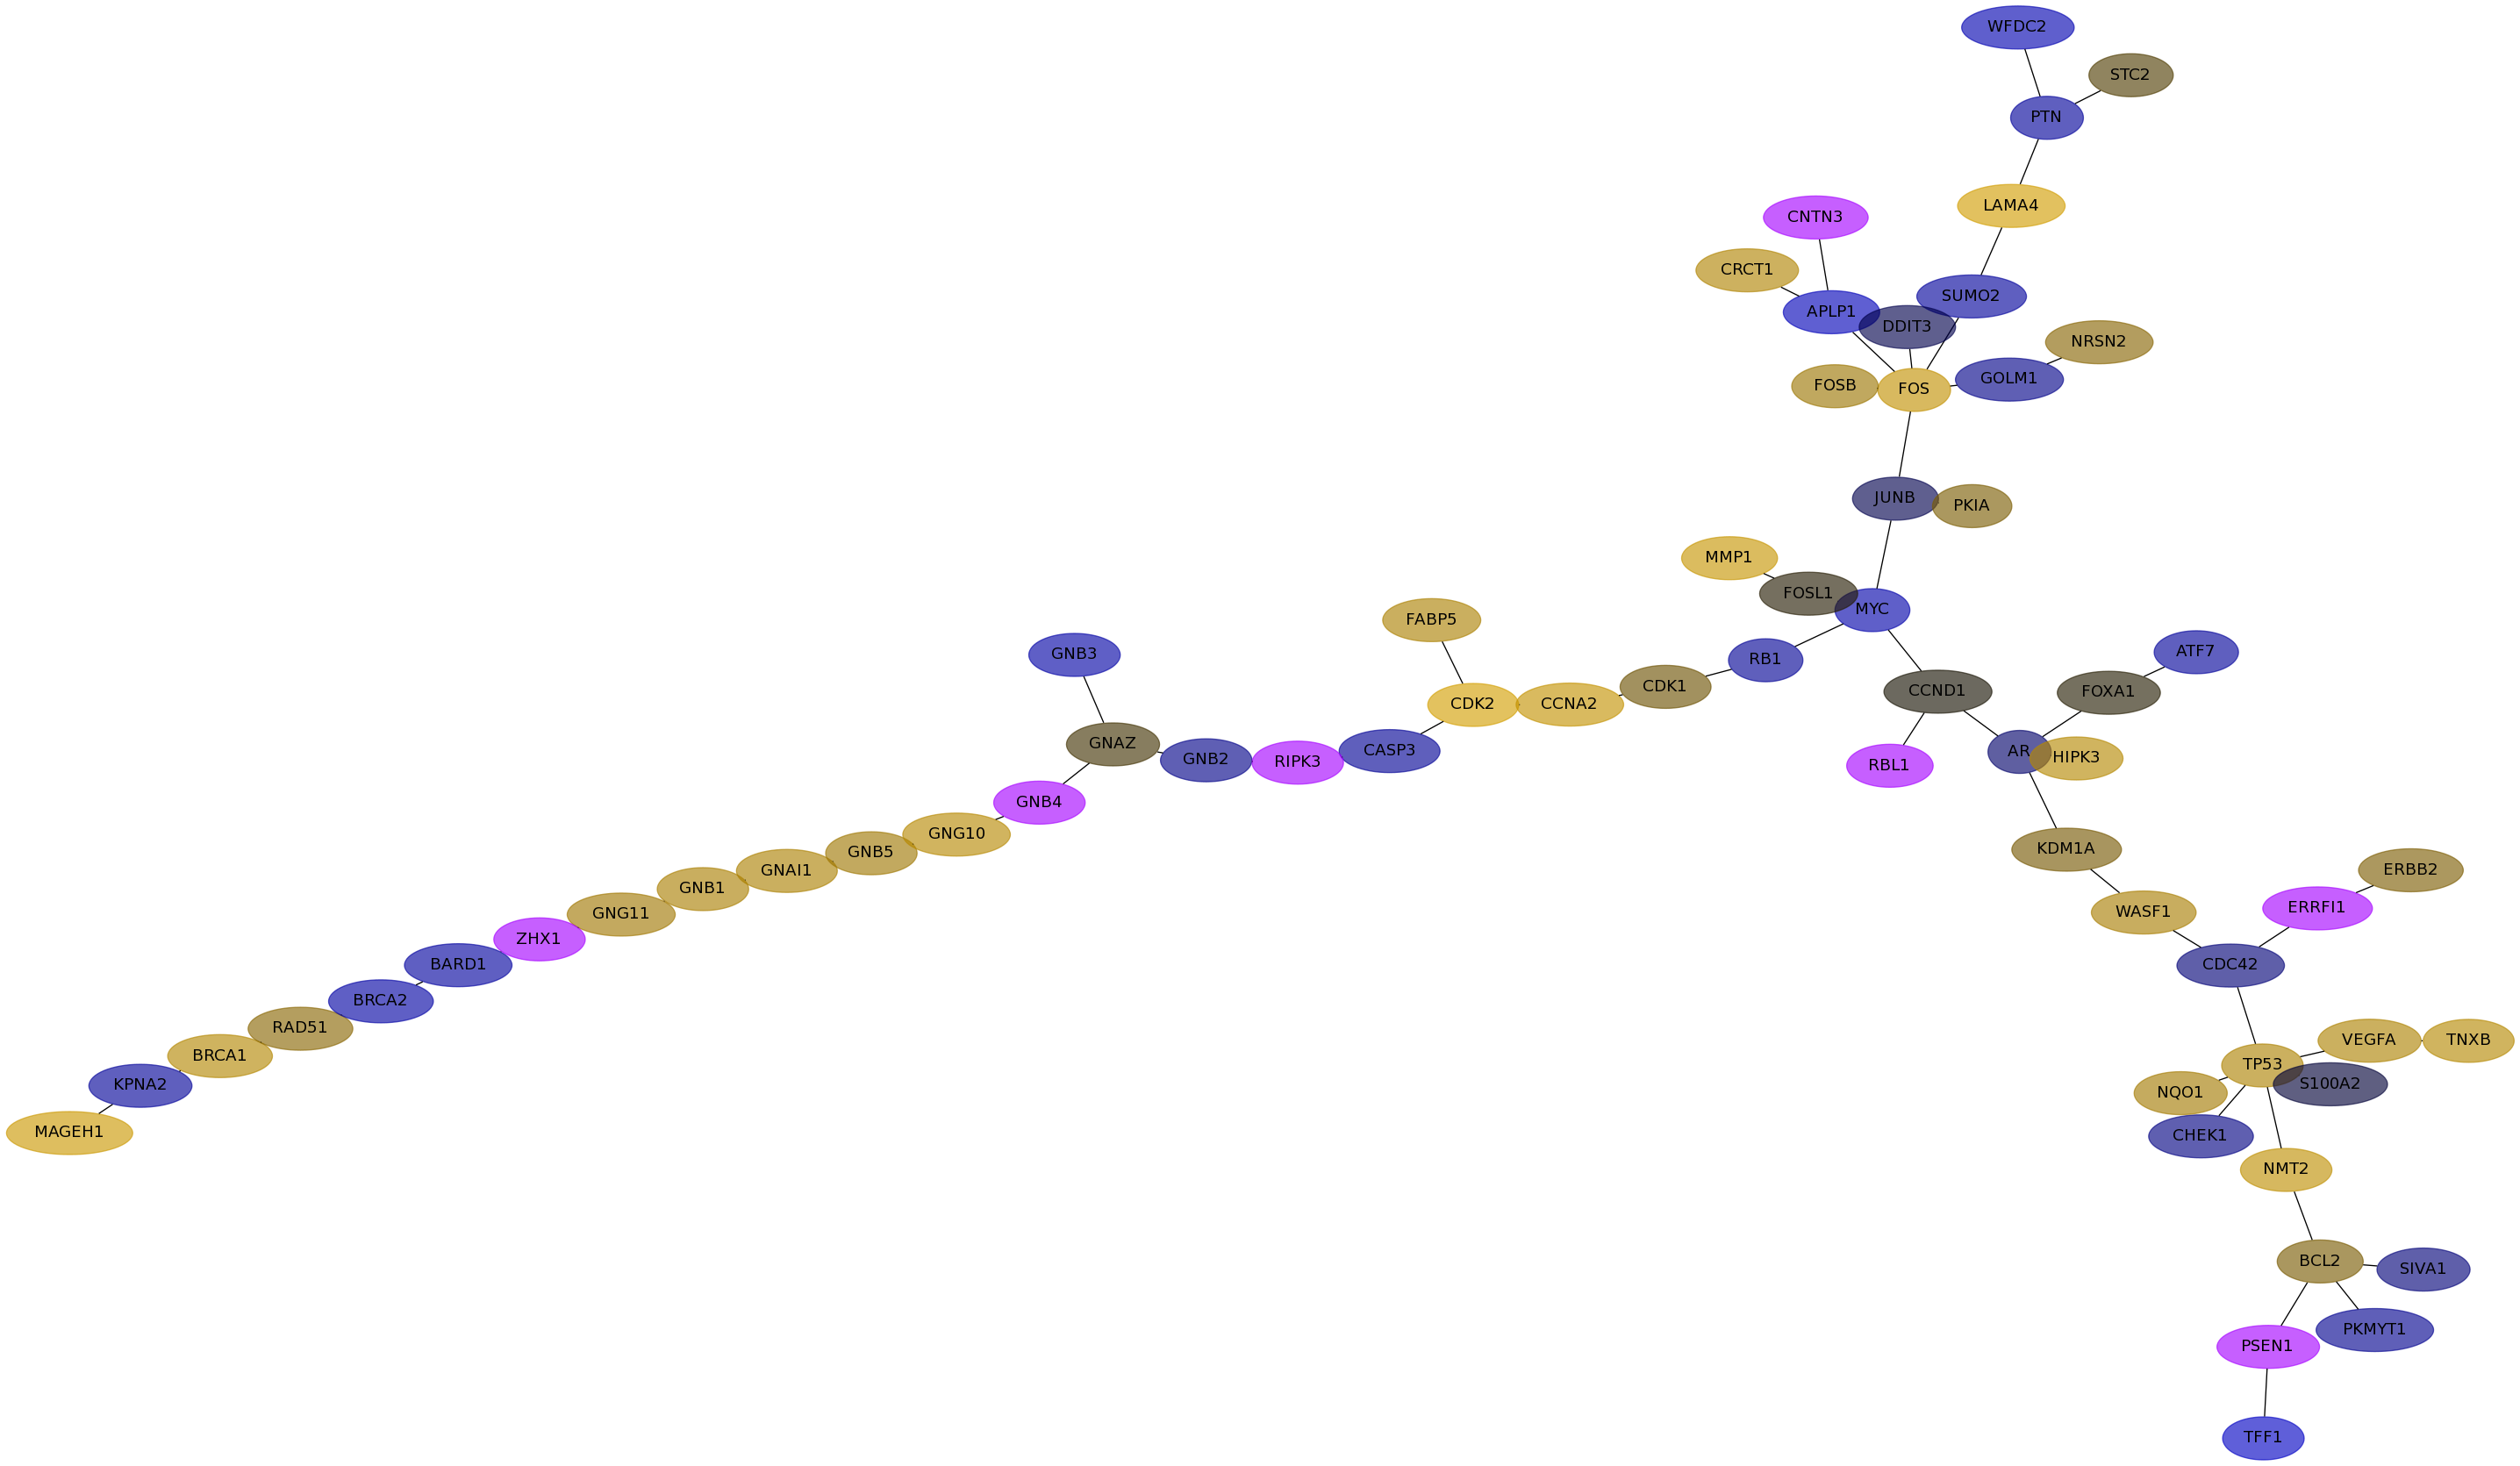
Expression data for subnetwork 6557 in each dataset
IPC |
Loi |
Schmidt |
VanDeVijver |
Wang |
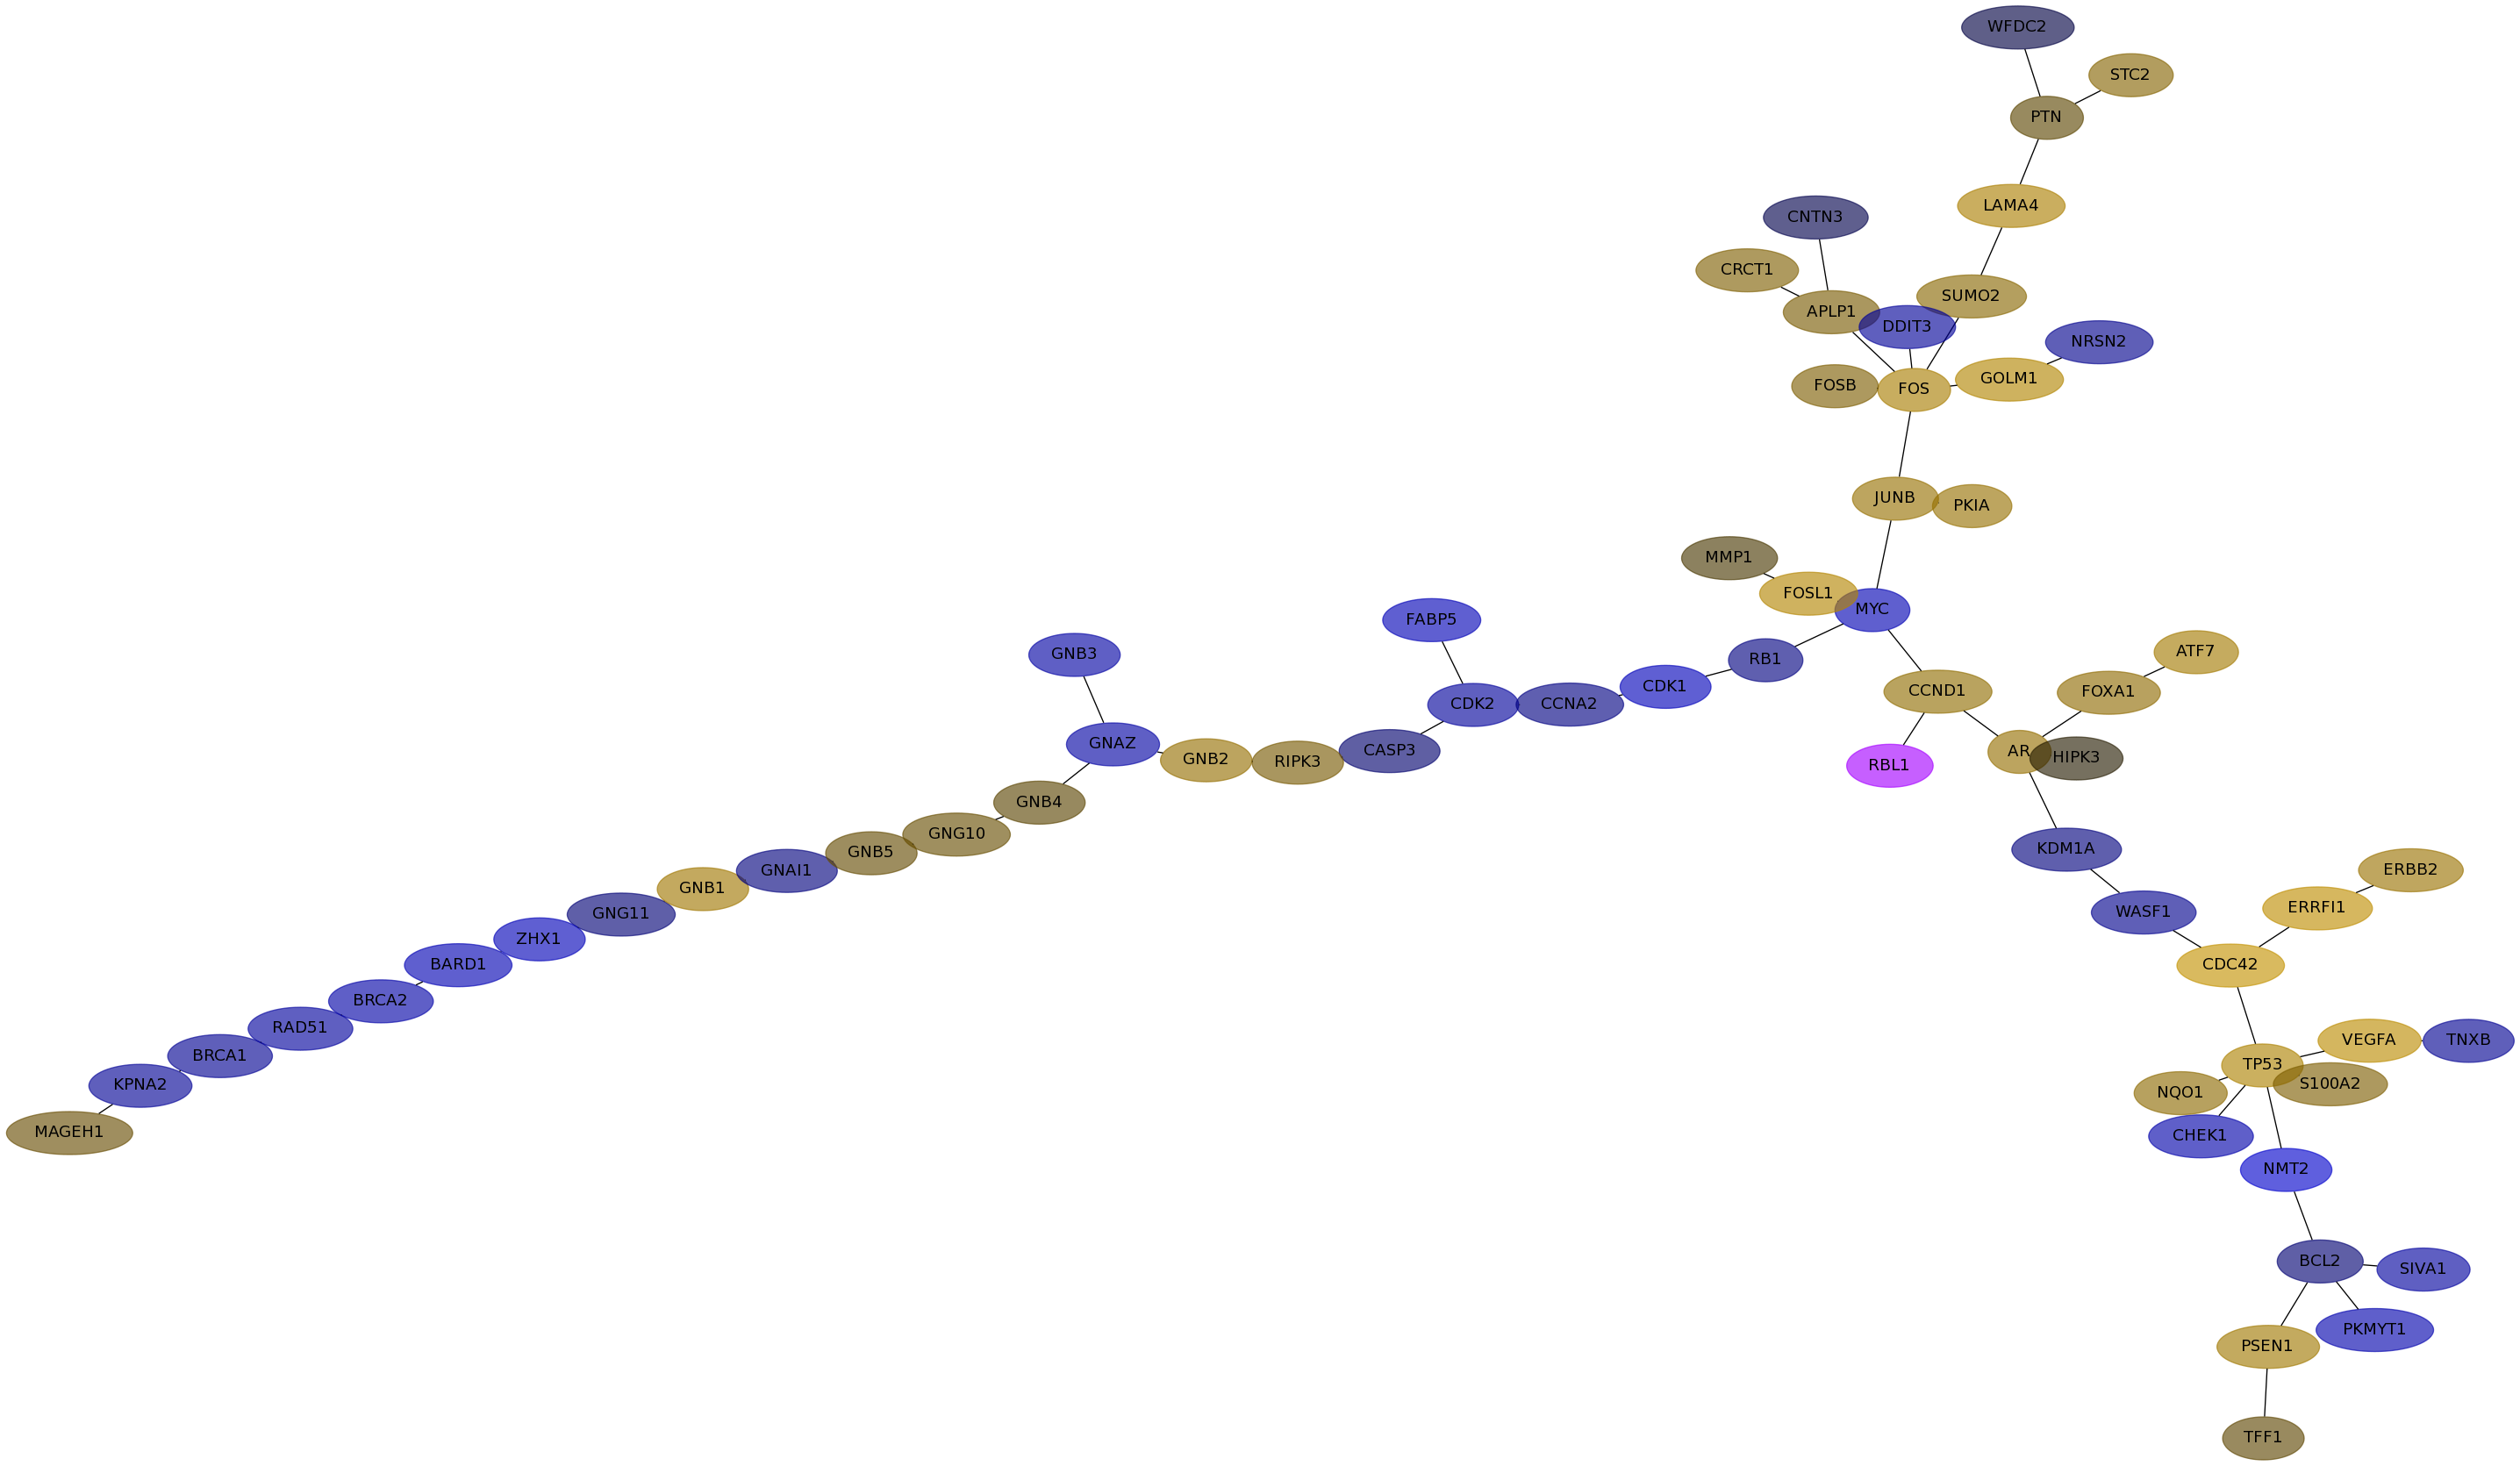
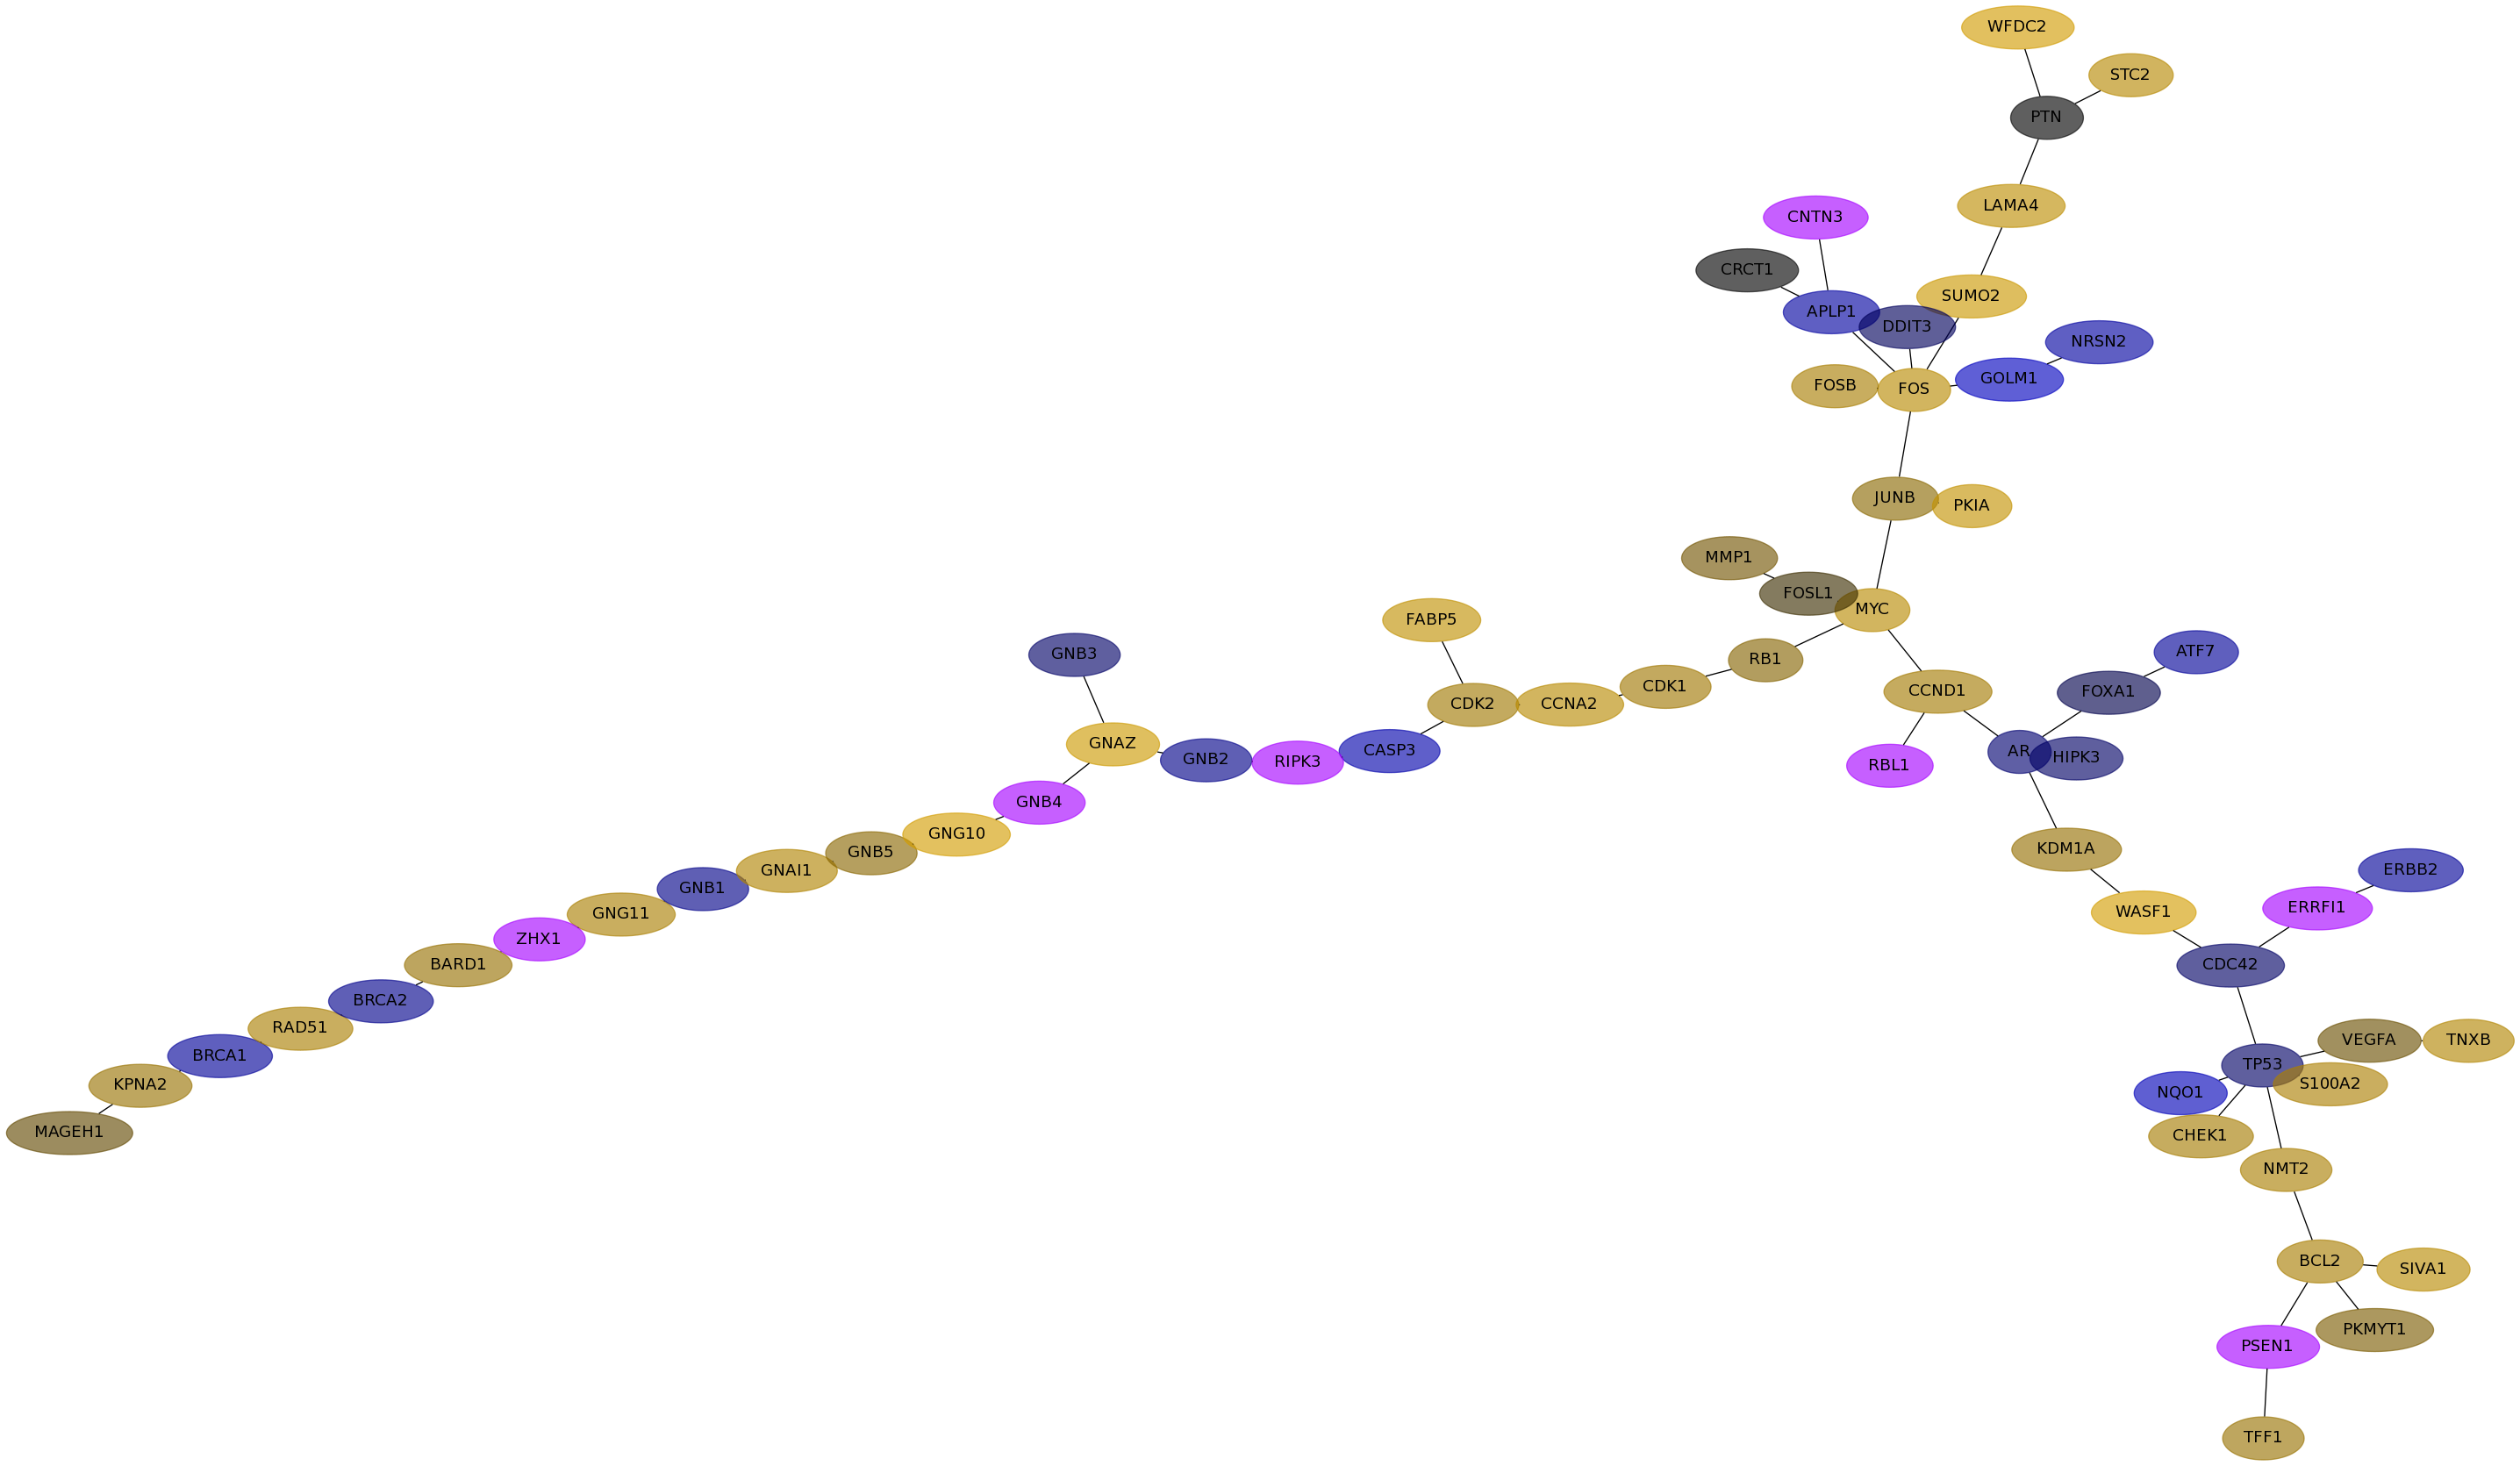
Subnetwork structure for each dataset
- IPC
Score for each gene in subnetwork 6557 in each dataset
| Gene Symbol | Links | Frequency | Frequency Rank | Subnetwork score rank | Global rank |
IPC | Loi | Schmidt | VanDeVijver | Wang |
|---|
| CASP3 |   | 11 | 148 | 141 | 143 | 0.234 | -0.032 | -0.142 | -0.097 | -0.084 |
|---|
| GNB3 | | 2 | 743 | 1364 | 1363 | 0.046 | -0.115 | -0.028 | 0.013 | -0.119 |
|---|
| WASF1 | | 7 | 256 | 1 | 47 | 0.162 | -0.070 | 0.348 | -0.037 | 0.130 |
|---|
| GNG11 | | 3 | 557 | 1364 | 1342 | 0.049 | -0.039 | 0.135 | 0.004 | 0.106 |
|---|
| NQO1 | | 21 | 73 | 366 | 354 | -0.115 | 0.069 | -0.189 | 0.321 | 0.118 |
|---|
| SUMO2 | | 22 | 69 | 366 | 345 | 0.117 | 0.062 | 0.294 | 0.141 | -0.096 |
|---|
| TP53 | | 85 | 7 | 1 | 6 | -0.167 | 0.148 | -0.027 | 0.252 | 0.147 |
|---|
| TNXB | | 4 | 440 | 727 | 723 | -0.169 | -0.076 | 0.160 | 0.182 | 0.173 |
|---|
| GNB1 | | 1 | 1195 | 1534 | 1552 | -0.182 | 0.105 | -0.061 | undef | 0.135 |
|---|
| ERBB2 | | 141 | 1 | 1 | 1 | -0.103 | 0.092 | -0.090 | 0.267 | 0.046 |
|---|
| BARD1 | | 69 | 12 | 141 | 132 | 0.179 | -0.165 | 0.086 | 0.245 | -0.104 |
|---|
| GNB2 | | 11 | 148 | 525 | 505 | -0.091 | 0.082 | -0.062 | 0.208 | -0.062 |
|---|
| KDM1A | | 1 | 1195 | 1534 | 1552 | -0.010 | -0.048 | 0.081 | undef | 0.038 |
|---|
| WFDC2 | | 5 | 360 | 236 | 242 | -0.011 | -0.011 | 0.333 | -0.162 | -0.157 |
|---|
| CCND1 | | 26 | 52 | 1 | 24 | -0.258 | 0.074 | 0.117 | undef | 0.003 |
|---|
| CCNA2 | | 21 | 73 | 179 | 183 | 0.176 | -0.053 | 0.188 | -0.078 | 0.246 |
|---|
| CDC42 | | 26 | 52 | 179 | 177 | 0.047 | 0.242 | -0.027 | 0.040 | -0.042 |
|---|
| GNAZ | | 15 | 111 | 478 | 457 | 0.134 | -0.116 | 0.308 | 0.267 | 0.011 |
|---|
| CRCT1 | | 2 | 743 | 727 | 734 | 0.135 | 0.050 | 0.000 | -0.103 | 0.154 |
|---|
| SIVA1 | | 3 | 557 | 1055 | 1043 | 0.157 | -0.103 | 0.190 | undef | -0.042 |
|---|
| FOSB | | 5 | 360 | 1534 | 1501 | -0.033 | 0.046 | 0.129 | -0.104 | 0.095 |
|---|
| LAMA4 | | 13 | 124 | 696 | 670 | -0.016 | 0.138 | 0.209 | 0.172 | 0.343 |
|---|
| MMP1 | | 11 | 148 | 366 | 360 | 0.192 | 0.014 | 0.036 | 0.044 | 0.260 |
|---|
| FABP5 | | 3 | 557 | 1534 | 1516 | 0.152 | -0.177 | 0.225 | -0.118 | 0.141 |
|---|
| PKMYT1 | | 7 | 256 | 1510 | 1463 | 0.175 | -0.143 | 0.046 | 0.105 | -0.070 |
|---|
| BRCA1 | | 3 | 557 | 1534 | 1516 | -0.201 | -0.078 | -0.087 | -0.166 | 0.168 |
|---|
| VEGFA | | 68 | 14 | 83 | 78 | 0.090 | 0.200 | 0.030 | 0.095 | 0.148 |
|---|
| CDK1 | | 63 | 15 | 83 | 79 | 0.265 | -0.195 | 0.106 | 0.088 | 0.031 |
|---|
| GNAI1 | | 1 | 1195 | 1534 | 1552 | -0.001 | -0.046 | 0.153 | 0.146 | 0.139 |
|---|
| BRCA2 | | 41 | 28 | 236 | 222 | 0.206 | -0.124 | -0.066 | 0.233 | -0.116 |
|---|
| RBL1 | | 21 | 73 | 1 | 27 | 0.078 | undef | undef | 0.051 | undef |
|---|
| GNB4 | | 1 | 1195 | 1534 | 1552 | 0.036 | 0.020 | undef | -0.064 | undef |
|---|
| GNG10 | | 3 | 557 | 1190 | 1182 | 0.239 | 0.028 | 0.350 | 0.035 | 0.183 |
|---|
| KPNA2 | | 1 | 1195 | 1534 | 1552 | 0.233 | -0.081 | 0.087 | 0.064 | -0.090 |
|---|
| FOSL1 | | 11 | 148 | 366 | 360 | -0.040 | 0.164 | 0.010 | 0.128 | 0.005 |
|---|
| PTN | | 24 | 62 | 236 | 225 | undef | 0.022 | 0.000 | 0.054 | -0.092 |
|---|
| MAGEH1 | | 1 | 1195 | 1534 | 1552 | 0.158 | 0.028 | 0.025 | -0.016 | 0.288 |
|---|
| ATF7 | | 28 | 47 | 179 | 175 | 0.085 | 0.115 | -0.088 | 0.172 | -0.092 |
|---|
| CHEK1 | | 18 | 86 | 141 | 136 | 0.189 | -0.134 | 0.119 | -0.088 | -0.054 |
|---|
| PSEN1 | | 10 | 167 | 366 | 362 | -0.041 | 0.110 | undef | 0.083 | undef |
|---|
| S100A2 | | 6 | 301 | 1 | 52 | 0.005 | 0.047 | 0.137 | -0.029 | -0.008 |
|---|
| GOLM1 | | 8 | 222 | 1534 | 1489 | 0.109 | 0.161 | -0.217 | 0.170 | -0.060 |
|---|
| APLP1 | | 8 | 222 | 727 | 703 | 0.284 | 0.043 | -0.105 | -0.121 | -0.190 |
|---|
| RB1 | | 31 | 43 | 1 | 22 | 0.013 | -0.051 | 0.057 | 0.100 | -0.082 |
|---|
| GNB5 | | 9 | 196 | 1131 | 1100 | -0.059 | 0.026 | 0.064 | 0.284 | 0.103 |
|---|
| MYC | | 72 | 10 | 1 | 8 | -0.101 | -0.169 | 0.188 | undef | -0.134 |
|---|
| JUNB | | 20 | 81 | 179 | 185 | 0.057 | 0.086 | 0.065 | 0.001 | -0.015 |
|---|
| STC2 | | 5 | 360 | 236 | 242 | -0.009 | 0.056 | 0.181 | -0.185 | 0.016 |
|---|
| BCL2 | | 37 | 32 | 83 | 82 | -0.077 | -0.035 | 0.128 | -0.106 | 0.043 |
|---|
| CNTN3 | | 1 | 1195 | 1534 | 1552 | -0.064 | -0.015 | undef | 0.185 | undef |
|---|
| ERRFI1 | | 10 | 167 | 412 | 408 | 0.076 | 0.215 | undef | -0.043 | undef |
|---|
| RIPK3 | | 19 | 85 | 179 | 186 | -0.014 | 0.040 | undef | 0.173 | undef |
|---|
| FOS | | 42 | 27 | 1 | 17 | -0.137 | 0.129 | 0.185 | -0.144 | 0.234 |
|---|
| NMT2 | | 7 | 256 | 906 | 876 | 0.077 | -0.296 | 0.134 | -0.124 | 0.217 |
|---|
| TFF1 | | 7 | 256 | 957 | 928 | 0.106 | 0.022 | 0.088 | -0.033 | -0.244 |
|---|
| RAD51 | | 13 | 124 | 727 | 699 | 0.146 | -0.098 | 0.135 | -0.070 | 0.061 |
|---|
| ZHX1 | | 5 | 360 | 1364 | 1328 | 0.094 | -0.187 | undef | undef | undef |
|---|
| AR | | 46 | 24 | 141 | 133 | -0.163 | 0.081 | -0.035 | 0.178 | -0.030 |
|---|
| CDK2 | | 31 | 43 | 179 | 174 | 0.196 | -0.096 | 0.109 | 0.001 | 0.362 |
|---|
| HIPK3 | | 9 | 196 | 1461 | 1417 | 0.069 | 0.005 | -0.027 | undef | 0.175 |
|---|
| FOXA1 | | 27 | 50 | 179 | 176 | -0.072 | 0.071 | -0.015 | 0.214 | 0.005 |
|---|
| DDIT3 | | 1 | 1195 | 1534 | 1552 | 0.166 | -0.089 | -0.021 | 0.062 | -0.015 |
|---|
| PKIA | | 11 | 148 | 780 | 759 | -0.120 | 0.085 | 0.249 | 0.164 | 0.044 |
|---|
| NRSN2 | | 1 | 1195 | 1534 | 1552 | 0.025 | -0.069 | -0.107 | undef | 0.059 |
|---|
GO Enrichment output for subnetwork 6557 in each dataset
| Name | Accession Number | Link | P-val | Corrected P-val |
|---|
| elastic fiber assembly | GO:0048251 |  | 3.333E-18 | 8.143E-15 |
|---|
| collagen metabolic process | GO:0032963 | | 7.601E-15 | 9.285E-12 |
|---|
| multicellular organismal macromolecule metabolic process | GO:0044259 | | 1.893E-14 | 1.542E-11 |
|---|
| aging | GO:0007568 | | 5.062E-14 | 3.092E-11 |
|---|
| multicellular organismal metabolic process | GO:0044236 | | 9.197E-14 | 4.494E-11 |
|---|
| extracellular matrix organization | GO:0030198 | | 1.176E-11 | 4.789E-09 |
|---|
| positive regulation of smooth muscle cell proliferation | GO:0048661 | | 2.718E-11 | 9.487E-09 |
|---|
| regulation of lipid kinase activity | GO:0043550 | | 6.483E-11 | 1.98E-08 |
|---|
| regulation of smooth muscle cell proliferation | GO:0048660 | | 1.744E-10 | 4.734E-08 |
|---|
| response to protein stimulus | GO:0051789 | | 2.804E-10 | 6.85E-08 |
|---|
| hormone-mediated signaling | GO:0009755 | | 5.346E-10 | 1.187E-07 |
|---|
| Name | Accession Number | Link | P-val | Corrected P-val |
|---|
| elastic fiber assembly | GO:0048251 | | 8.473E-16 | 2.039E-12 |
|---|
| collagen metabolic process | GO:0032963 | | 7.031E-13 | 8.459E-10 |
|---|
| multicellular organismal macromolecule metabolic process | GO:0044259 | | 1.601E-12 | 1.284E-09 |
|---|
| multicellular organismal metabolic process | GO:0044236 | | 6.636E-12 | 3.991E-09 |
|---|
| aging | GO:0007568 | | 9.953E-11 | 4.789E-08 |
|---|
| extracellular matrix organization | GO:0030198 | | 4.512E-10 | 1.809E-07 |
|---|
| hormone-mediated signaling | GO:0009755 | | 4.719E-10 | 1.622E-07 |
|---|
| release of cytochrome c from mitochondria | GO:0001836 | | 2.691E-09 | 8.093E-07 |
|---|
| DNA damage response. signal transduction | GO:0042770 | | 7.574E-09 | 2.025E-06 |
|---|
| interphase of mitotic cell cycle | GO:0051329 | | 8.602E-09 | 2.07E-06 |
|---|
| regulation of DNA metabolic process | GO:0051052 | | 1.015E-08 | 2.221E-06 |
|---|
| Name | Accession Number | Link | P-val | Corrected P-val |
|---|
| elastic fiber assembly | GO:0048251 | | 8.204E-15 | 1.887E-11 |
|---|
| collagen metabolic process | GO:0032963 | | 6.775E-12 | 7.792E-09 |
|---|
| multicellular organismal macromolecule metabolic process | GO:0044259 | | 1.584E-11 | 1.214E-08 |
|---|
| multicellular organismal metabolic process | GO:0044236 | | 6.812E-11 | 3.917E-08 |
|---|
| aging | GO:0007568 | | 7.813E-10 | 3.594E-07 |
|---|
| extracellular matrix organization | GO:0030198 | | 2.924E-09 | 1.121E-06 |
|---|
| extracellular structure organization | GO:0043062 | | 7.938E-09 | 2.608E-06 |
|---|
| release of cytochrome c from mitochondria | GO:0001836 | | 1.362E-08 | 3.915E-06 |
|---|
| regulation of lipid kinase activity | GO:0043550 | | 4.241E-08 | 1.084E-05 |
|---|
| regulation of DNA metabolic process | GO:0051052 | | 4.245E-08 | 9.763E-06 |
|---|
| apoptotic mitochondrial changes | GO:0008637 | | 5.717E-08 | 1.195E-05 |
|---|
VanDeVijver file
| Name | Accession Number | Link | P-val | Corrected P-val |
|---|
| hormone-mediated signaling | GO:0009755 | | 6.514E-09 | 1.2E-05 |
|---|
| response to hormone stimulus | GO:0009725 | | 2.555E-08 | 2.354E-05 |
|---|
| release of cytochrome c from mitochondria | GO:0001836 | | 1.557E-07 | 9.565E-05 |
|---|
| cell cycle checkpoint | GO:0000075 | | 3.544E-07 | 1.633E-04 |
|---|
| regulation of mitotic cell cycle | GO:0007346 | | 4.603E-07 | 1.697E-04 |
|---|
| apoptotic mitochondrial changes | GO:0008637 | | 4.622E-07 | 1.42E-04 |
|---|
| cellular response to hormone stimulus | GO:0032870 | | 7.187E-07 | 1.892E-04 |
|---|
| regulation of DNA metabolic process | GO:0051052 | | 1.193E-06 | 2.749E-04 |
|---|
| interphase of mitotic cell cycle | GO:0051329 | | 1.345E-06 | 2.755E-04 |
|---|
| aging | GO:0007568 | | 2.198E-06 | 4.051E-04 |
|---|
| prostate gland development | GO:0030850 | | 3.362E-06 | 5.633E-04 |
|---|
| Name | Accession Number | Link | P-val | Corrected P-val |
|---|
| elastic fiber assembly | GO:0048251 | | 8.204E-15 | 1.887E-11 |
|---|
| collagen metabolic process | GO:0032963 | | 6.775E-12 | 7.792E-09 |
|---|
| multicellular organismal macromolecule metabolic process | GO:0044259 | | 1.584E-11 | 1.214E-08 |
|---|
| multicellular organismal metabolic process | GO:0044236 | | 6.812E-11 | 3.917E-08 |
|---|
| aging | GO:0007568 | | 7.813E-10 | 3.594E-07 |
|---|
| extracellular matrix organization | GO:0030198 | | 2.924E-09 | 1.121E-06 |
|---|
| extracellular structure organization | GO:0043062 | | 7.938E-09 | 2.608E-06 |
|---|
| release of cytochrome c from mitochondria | GO:0001836 | | 1.362E-08 | 3.915E-06 |
|---|
| regulation of lipid kinase activity | GO:0043550 | | 4.241E-08 | 1.084E-05 |
|---|
| regulation of DNA metabolic process | GO:0051052 | | 4.245E-08 | 9.763E-06 |
|---|
| apoptotic mitochondrial changes | GO:0008637 | | 5.717E-08 | 1.195E-05 |
|---|

