Study Desmedt-ER-neg
Study informations
165 subnetworks in total page | file
2310 genes associated page | file
Enriched GO terms page
General informations
General Index page
Study Index page
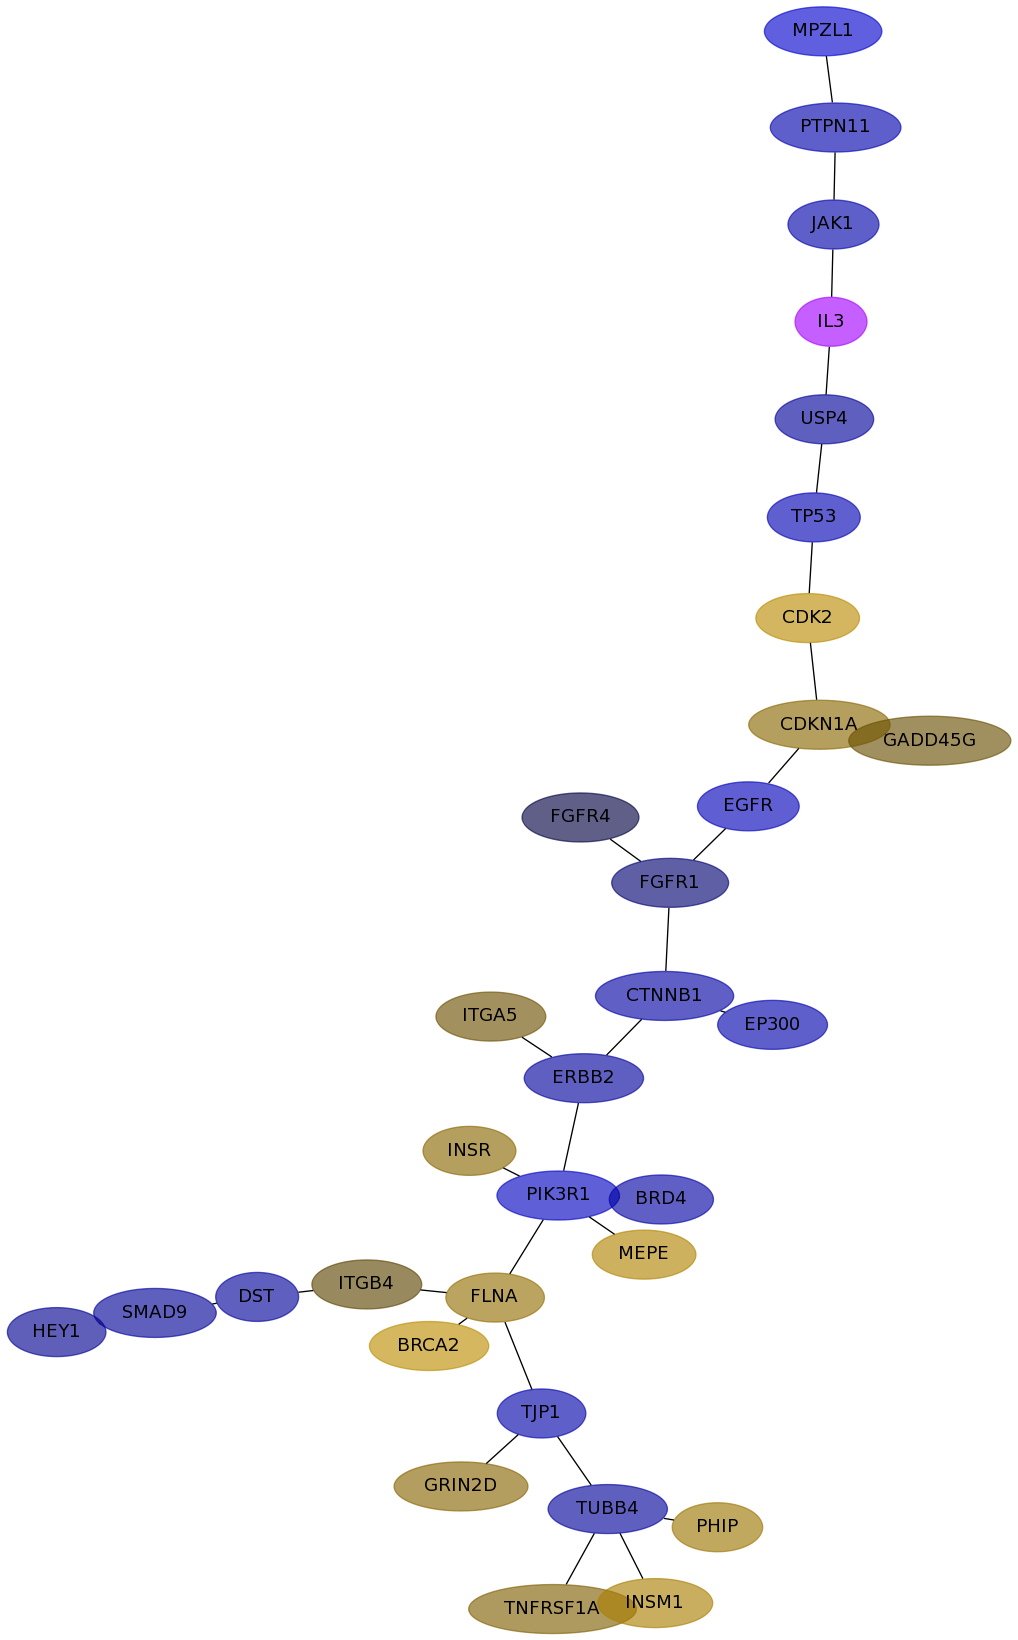
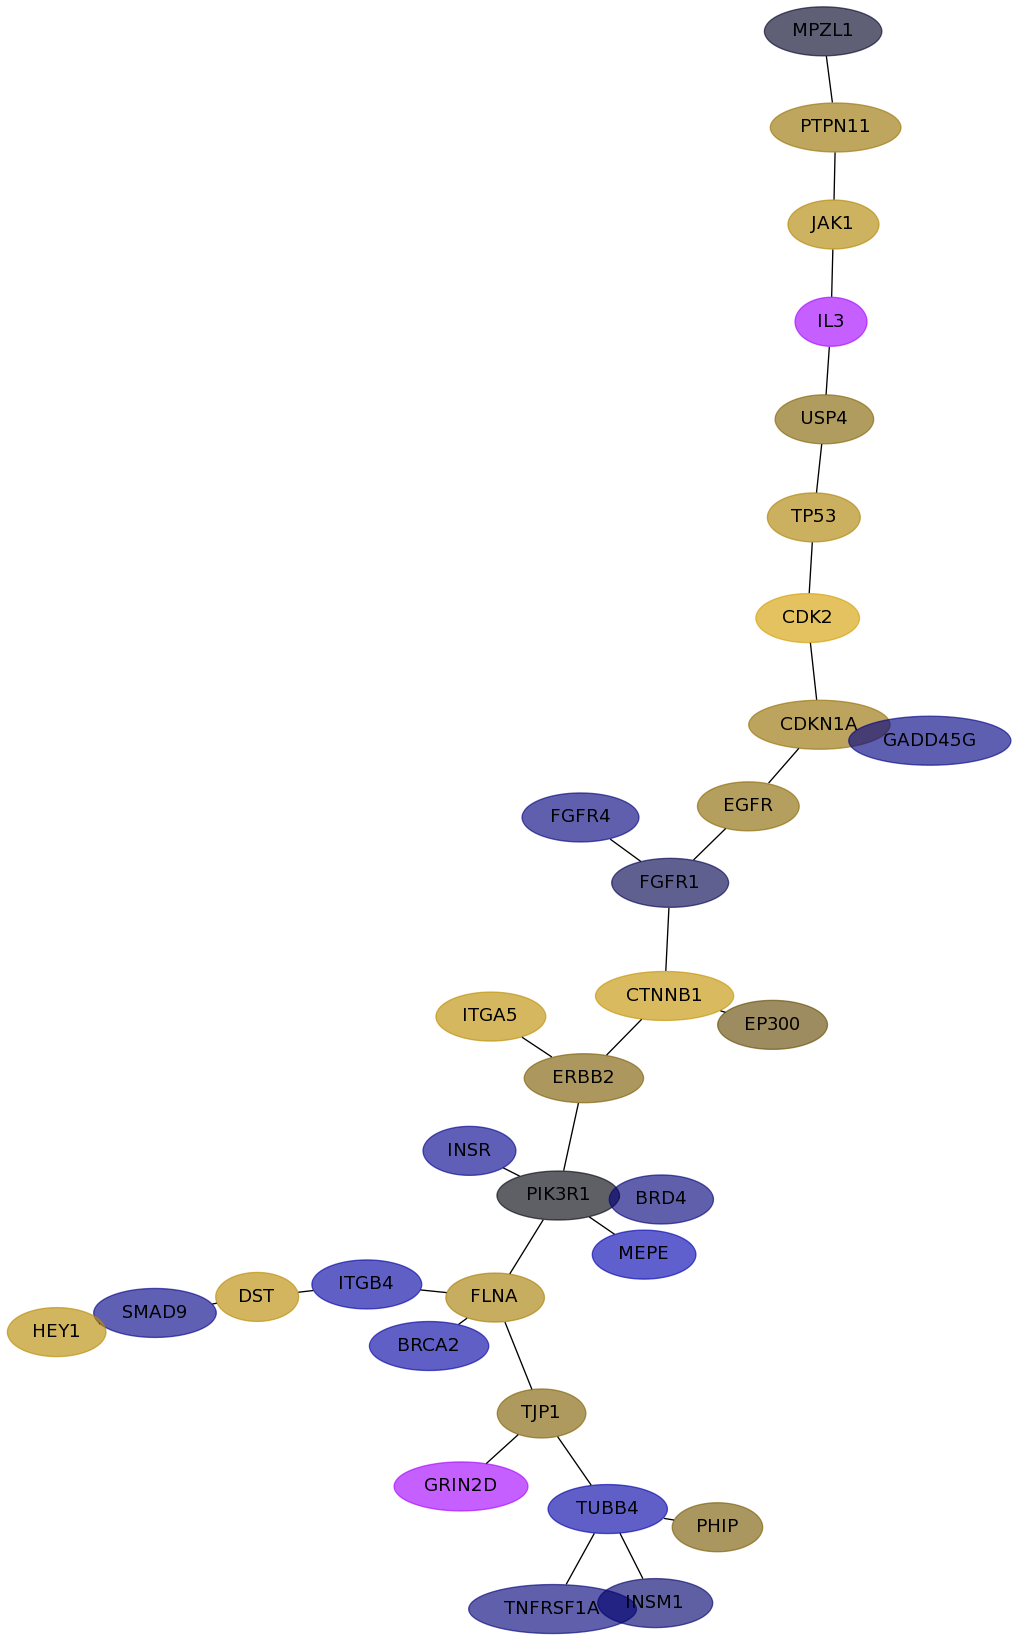
Subnetwork 6495
score
| Dataset | Score | P-val 1 | P-val 2 | P-val 3 | Fisher Score |
|---|
| IPC | 0.7552 | 3.432e-03 | 5.550e-04 | 7.672e-01 | 1.461e-06 |
|---|
| Loi | 0.2301 | 8.055e-02 | 1.144e-02 | 4.289e-01 | 3.951e-04 |
|---|
| Schmidt | 0.6726 | 0.000e+00 | 0.000e+00 | 4.584e-02 | 0.000e+00 |
|---|
| VanDeVijver | 0.7907 | 0.000e+00 | 0.000e+00 | 3.474e-03 | 0.000e+00 |
|---|
| Wang | 0.2612 | 2.723e-03 | 4.422e-02 | 3.982e-01 | 4.795e-05 |
|---|
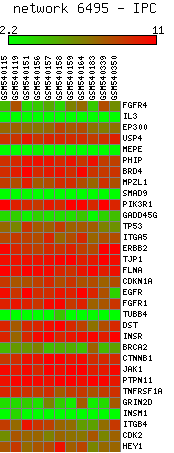
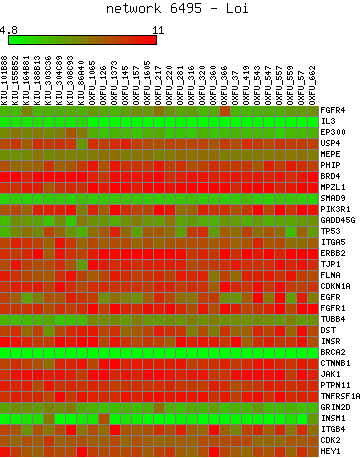
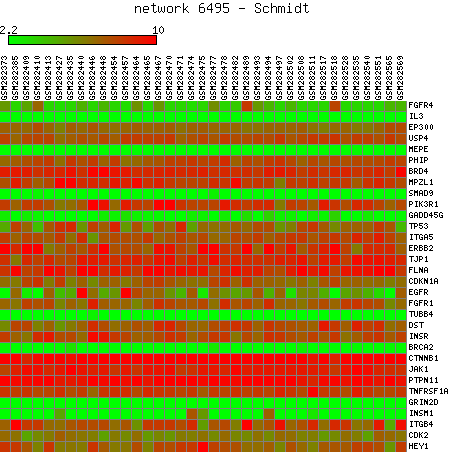
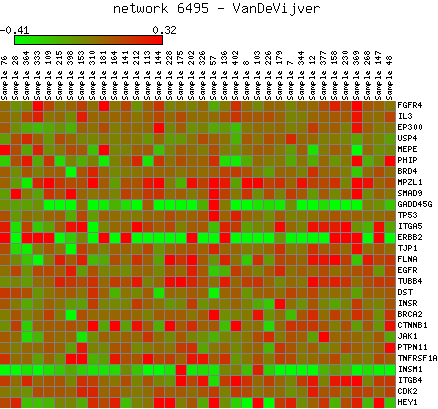
Expression data for subnetwork 6495 in each dataset
IPC |
Loi |
Schmidt |
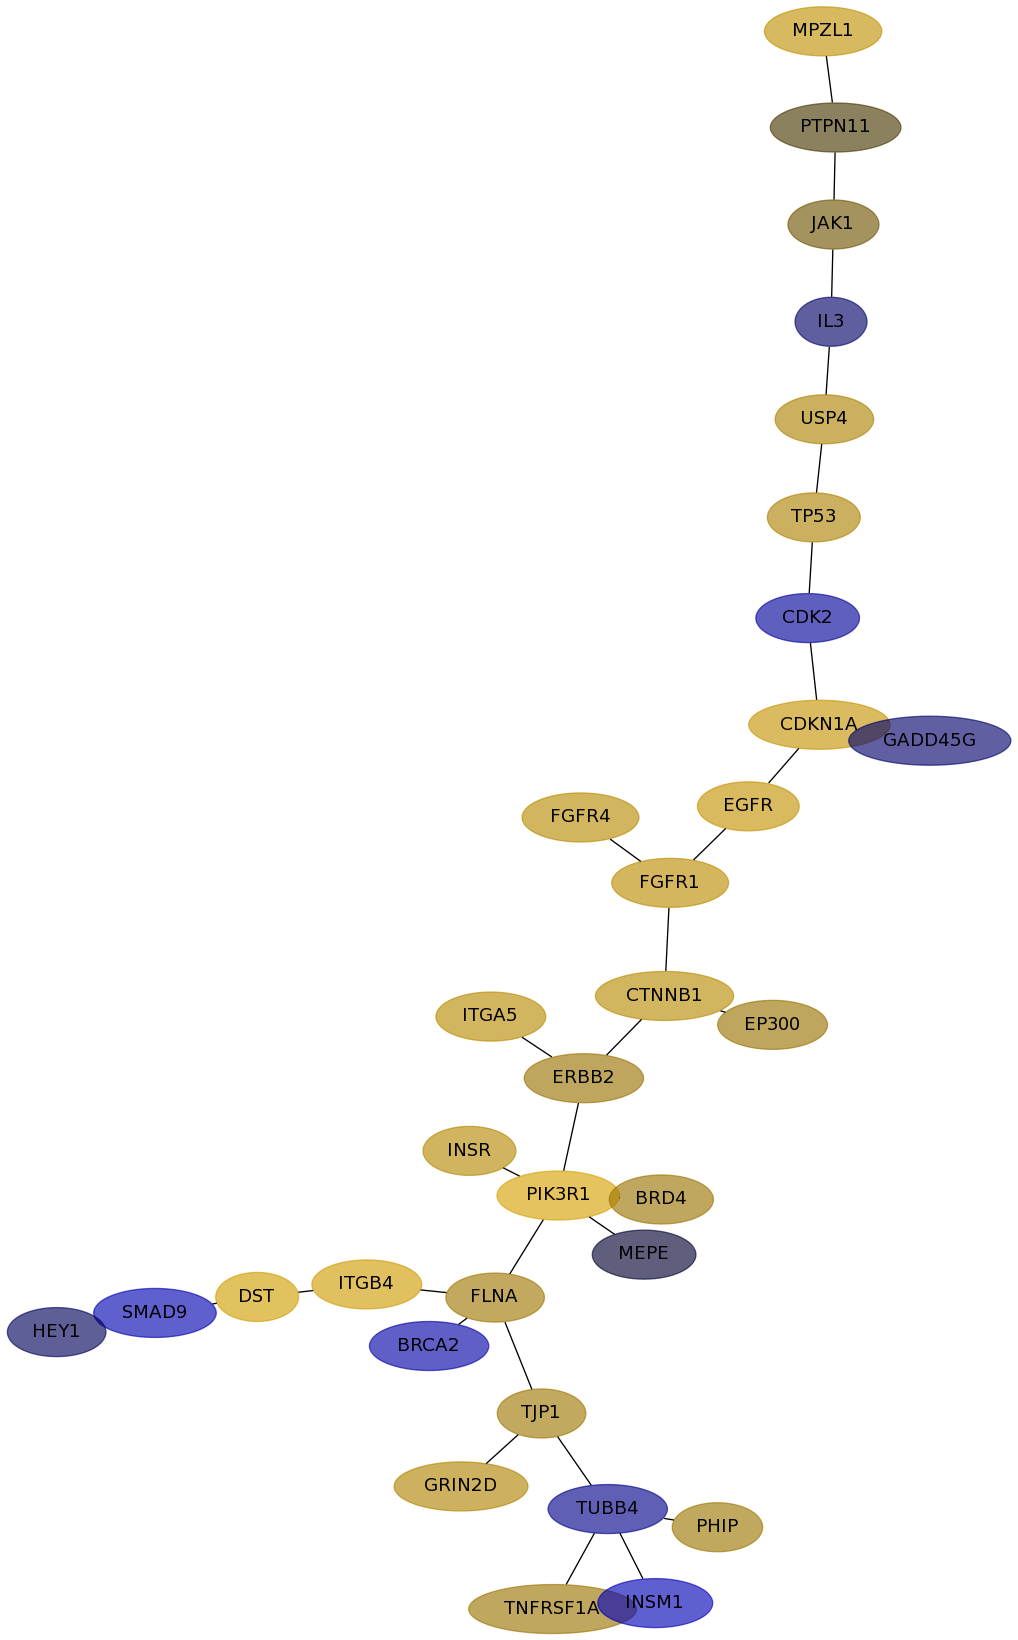
VanDeVijver |
Wang |
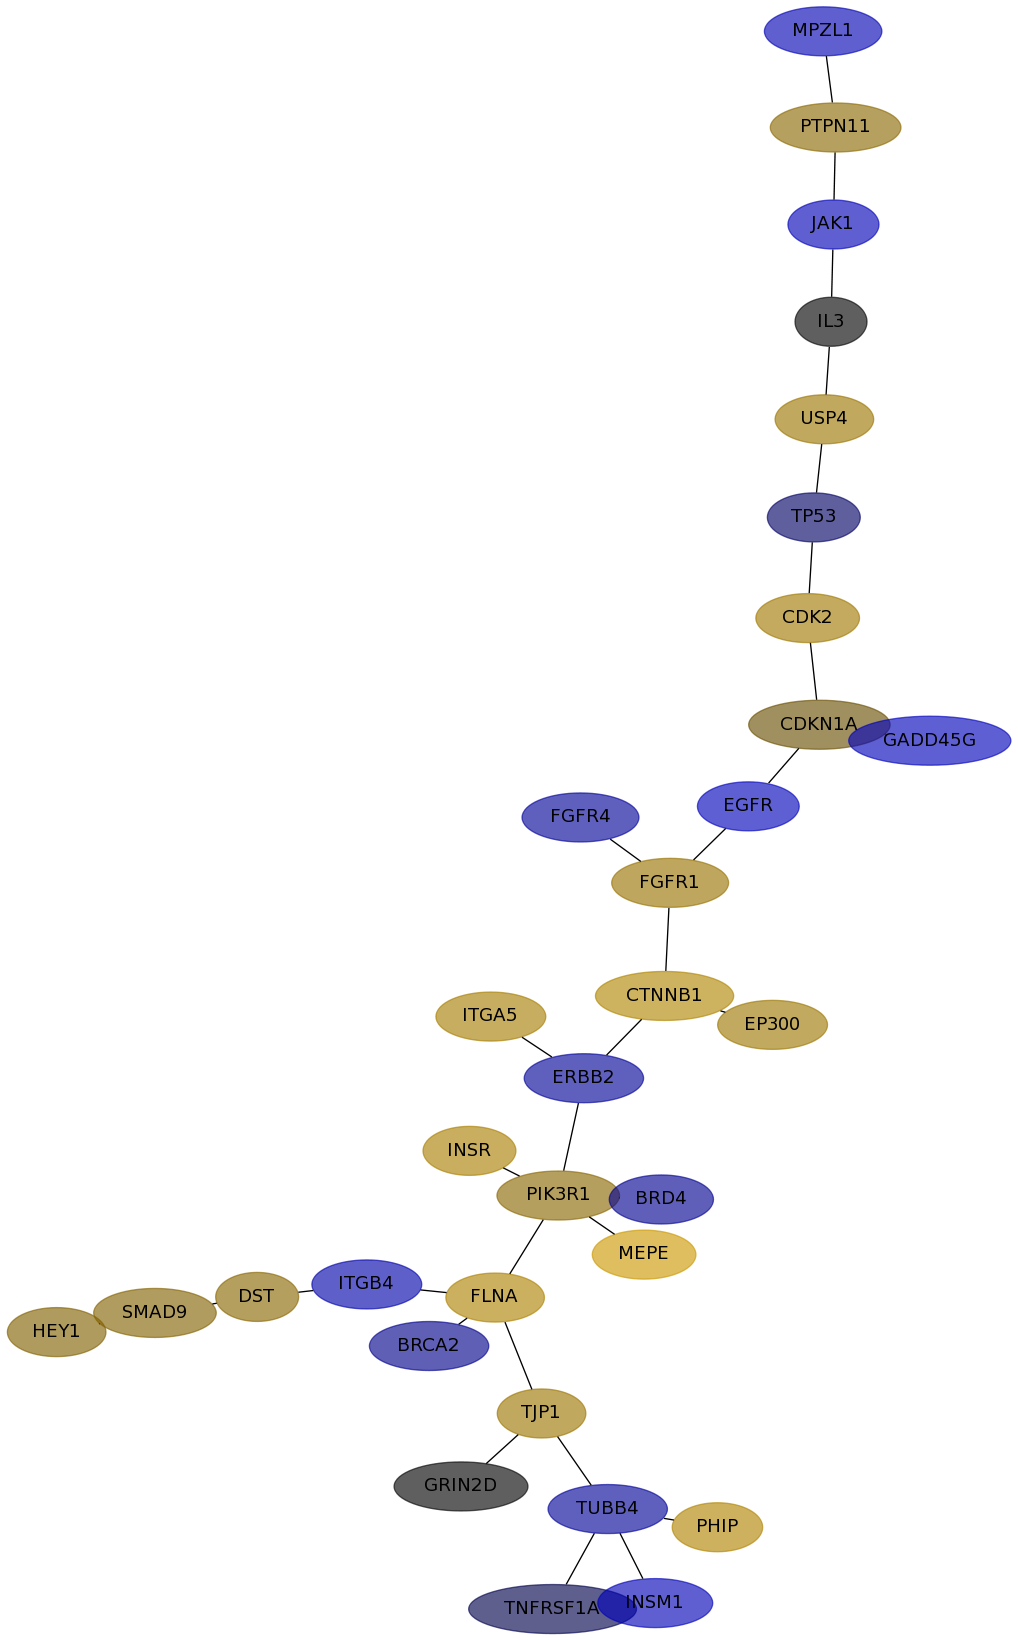
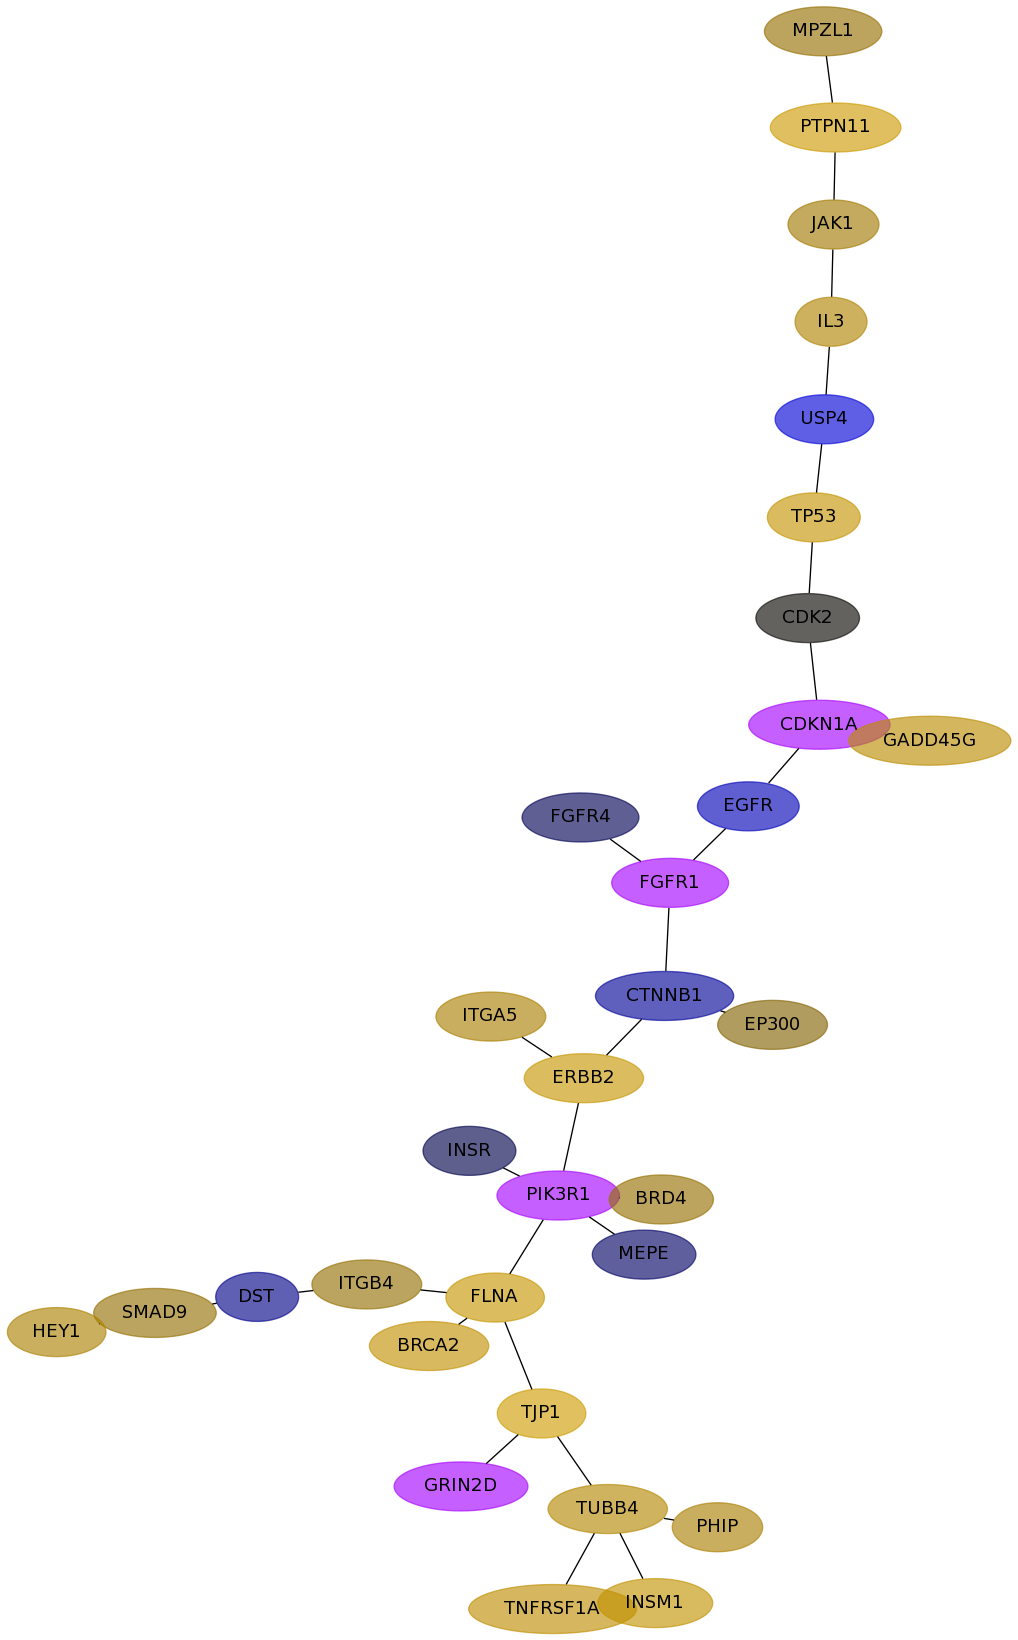
Subnetwork structure for each dataset
- IPC
Score for each gene in subnetwork 6495 in each dataset
| Gene Symbol | Links | Frequency | Frequency Rank | Subnetwork score rank | Global rank |
IPC | Loi | Schmidt | VanDeVijver | Wang |
|---|
| FGFR4 |   | 21 | 73 | 179 | 183 | -0.011 | 0.188 | -0.089 | -0.018 | -0.049 |
|---|
| IL3 | | 2 | 743 | 1867 | 1849 | undef | -0.029 | 0.000 | 0.153 | undef |
|---|
| EP300 | | 113 | 4 | 1 | 4 | -0.149 | 0.087 | 0.102 | 0.052 | 0.025 |
|---|
| USP4 | | 7 | 256 | 1 | 47 | -0.093 | 0.147 | 0.097 | -0.392 | 0.054 |
|---|
| MEPE | | 1 | 1195 | 1867 | 1876 | 0.154 | -0.007 | 0.297 | -0.027 | -0.158 |
|---|
| PHIP | | 4 | 440 | 906 | 902 | 0.099 | 0.100 | 0.156 | 0.136 | 0.042 |
|---|
| BRD4 | | 11 | 148 | 1047 | 1003 | -0.119 | 0.095 | -0.075 | 0.081 | -0.044 |
|---|
| MPZL1 | | 2 | 743 | 1867 | 1849 | -0.311 | 0.226 | -0.168 | 0.081 | -0.005 |
|---|
| SMAD9 | | 9 | 196 | 296 | 285 | -0.090 | -0.153 | 0.055 | 0.081 | -0.059 |
|---|
| PIK3R1 | | 127 | 2 | 1 | 2 | -0.237 | 0.381 | 0.065 | undef | -0.002 |
|---|
| GADD45G | | 43 | 25 | 141 | 134 | 0.030 | -0.029 | -0.207 | 0.201 | -0.055 |
|---|
| TP53 | | 85 | 7 | 1 | 6 | -0.167 | 0.148 | -0.027 | 0.252 | 0.147 |
|---|
| ITGA5 | | 26 | 52 | 179 | 177 | 0.031 | 0.192 | 0.125 | 0.133 | 0.202 |
|---|
| ERBB2 | | 141 | 1 | 1 | 1 | -0.103 | 0.092 | -0.090 | 0.267 | 0.046 |
|---|
| TJP1 | | 8 | 222 | 318 | 325 | -0.139 | 0.102 | 0.099 | 0.319 | 0.049 |
|---|
| FLNA | | 50 | 20 | 1 | 14 | 0.081 | 0.107 | 0.148 | 0.268 | 0.126 |
|---|
| CDKN1A | | 110 | 5 | 1 | 5 | 0.064 | 0.254 | 0.030 | undef | 0.082 |
|---|
| EGFR | | 117 | 3 | 1 | 3 | -0.195 | 0.240 | -0.205 | -0.187 | 0.065 |
|---|
| FGFR1 | | 26 | 52 | 638 | 615 | -0.036 | 0.200 | 0.087 | undef | -0.015 |
|---|
| TUBB4 | | 2 | 743 | 1421 | 1416 | -0.093 | -0.063 | -0.088 | 0.171 | -0.126 |
|---|
| DST | | 22 | 69 | 1 | 25 | -0.094 | 0.343 | 0.065 | -0.062 | 0.194 |
|---|
| INSR | | 96 | 6 | 236 | 221 | 0.063 | 0.173 | 0.135 | -0.014 | -0.072 |
|---|
| BRCA2 | | 41 | 28 | 236 | 222 | 0.206 | -0.124 | -0.066 | 0.233 | -0.116 |
|---|
| CTNNB1 | | 43 | 25 | 83 | 81 | -0.113 | 0.187 | 0.159 | -0.090 | 0.239 |
|---|
| JAK1 | | 5 | 360 | 696 | 680 | -0.140 | 0.034 | -0.176 | 0.111 | 0.159 |
|---|
| PTPN11 | | 20 | 81 | 83 | 94 | -0.152 | 0.014 | 0.066 | 0.304 | 0.089 |
|---|
| TNFRSF1A | | 8 | 222 | 412 | 413 | 0.050 | 0.094 | -0.014 | 0.214 | -0.045 |
|---|
| GRIN2D | | 13 | 124 | 552 | 522 | 0.058 | 0.155 | 0.000 | undef | undef |
|---|
| INSM1 | | 23 | 66 | 570 | 545 | 0.135 | -0.184 | -0.188 | 0.237 | -0.032 |
|---|
| ITGB4 | | 35 | 34 | 1 | 20 | 0.021 | 0.313 | -0.134 | 0.080 | -0.114 |
|---|
| CDK2 | | 31 | 43 | 179 | 174 | 0.196 | -0.096 | 0.109 | 0.001 | 0.362 |
|---|
| HEY1 | | 2 | 743 | 1867 | 1849 | -0.078 | -0.021 | 0.052 | 0.142 | 0.189 |
|---|
GO Enrichment output for subnetwork 6495 in each dataset
| Name | Accession Number | Link | P-val | Corrected P-val |
|---|
| regulation of protein export from nucleus | GO:0046825 |  | 1.969E-09 | 4.81E-06 |
|---|
| organ growth | GO:0035265 | | 1.969E-09 | 2.405E-06 |
|---|
| negative regulation of peptide secretion | GO:0002792 | | 1.969E-09 | 1.603E-06 |
|---|
| regulation of growth hormone secretion | GO:0060123 | | 3.929E-09 | 2.4E-06 |
|---|
| cellular response to hormone stimulus | GO:0032870 | | 4.332E-09 | 2.117E-06 |
|---|
| nerve growth factor receptor signaling pathway | GO:0048011 | | 7.057E-09 | 2.873E-06 |
|---|
| positive regulation of MAP kinase activity | GO:0043406 | | 8.166E-09 | 2.85E-06 |
|---|
| regulation of DNA replication | GO:0006275 | | 1.162E-08 | 3.547E-06 |
|---|
| DNA damage response. signal transduction | GO:0042770 | | 2.17E-08 | 5.89E-06 |
|---|
| DNA damage checkpoint | GO:0000077 | | 4.598E-08 | 1.123E-05 |
|---|
| DNA integrity checkpoint | GO:0031570 | | 7.063E-08 | 1.569E-05 |
|---|
| Name | Accession Number | Link | P-val | Corrected P-val |
|---|
| regulation of protein export from nucleus | GO:0046825 | | 2.477E-09 | 5.959E-06 |
|---|
| organ growth | GO:0035265 | | 2.477E-09 | 2.979E-06 |
|---|
| negative regulation of peptide secretion | GO:0002792 | | 2.477E-09 | 1.986E-06 |
|---|
| cellular response to hormone stimulus | GO:0032870 | | 4.916E-09 | 2.957E-06 |
|---|
| regulation of growth hormone secretion | GO:0060123 | | 4.942E-09 | 2.378E-06 |
|---|
| nerve growth factor receptor signaling pathway | GO:0048011 | | 8.875E-09 | 3.559E-06 |
|---|
| positive regulation of MAP kinase activity | GO:0043406 | | 1.193E-08 | 4.101E-06 |
|---|
| regulation of DNA replication | GO:0006275 | | 1.618E-08 | 4.867E-06 |
|---|
| DNA damage response. signal transduction | GO:0042770 | | 2.472E-08 | 6.608E-06 |
|---|
| DNA damage checkpoint | GO:0000077 | | 4.472E-08 | 1.076E-05 |
|---|
| DNA integrity checkpoint | GO:0031570 | | 7.054E-08 | 1.543E-05 |
|---|
| Name | Accession Number | Link | P-val | Corrected P-val |
|---|
| negative regulation of peptide secretion | GO:0002792 | | 1.044E-09 | 2.4E-06 |
|---|
| regulation of protein export from nucleus | GO:0046825 | | 3.122E-09 | 3.59E-06 |
|---|
| organ growth | GO:0035265 | | 7.262E-09 | 5.568E-06 |
|---|
| regulation of growth hormone secretion | GO:0060123 | | 7.262E-09 | 4.176E-06 |
|---|
| cellular response to hormone stimulus | GO:0032870 | | 1.437E-08 | 6.611E-06 |
|---|
| nerve growth factor receptor signaling pathway | GO:0048011 | | 1.448E-08 | 5.551E-06 |
|---|
| regulation of DNA replication | GO:0006275 | | 2.984E-08 | 9.803E-06 |
|---|
| positive regulation of MAP kinase activity | GO:0043406 | | 3.811E-08 | 1.096E-05 |
|---|
| DNA damage response. signal transduction | GO:0042770 | | 7.704E-08 | 1.969E-05 |
|---|
| DNA damage checkpoint | GO:0000077 | | 1.204E-07 | 2.77E-05 |
|---|
| carbohydrate homeostasis | GO:0033500 | | 1.672E-07 | 3.497E-05 |
|---|
VanDeVijver file
| Name | Accession Number | Link | P-val | Corrected P-val |
|---|
| regulation of DNA replication | GO:0006275 | | 8.154E-08 | 1.503E-04 |
|---|
| positive regulation of protein kinase activity | GO:0045860 | | 6.028E-07 | 5.554E-04 |
|---|
| positive regulation of transferase activity | GO:0051347 | | 6.913E-07 | 4.247E-04 |
|---|
| positive regulation of MAP kinase activity | GO:0043406 | | 8.74E-07 | 4.027E-04 |
|---|
| regulation of DNA metabolic process | GO:0051052 | | 9.687E-07 | 3.571E-04 |
|---|
| protein amino acid autophosphorylation | GO:0046777 | | 3.086E-06 | 9.479E-04 |
|---|
| regulation of MAP kinase activity | GO:0043405 | | 3.922E-06 | 1.033E-03 |
|---|
| positive regulation of nitric oxide biosynthetic process | GO:0045429 | | 7.75E-06 | 1.785E-03 |
|---|
| integrin-mediated signaling pathway | GO:0007229 | | 8.698E-06 | 1.781E-03 |
|---|
| positive regulation of DNA replication | GO:0045740 | | 1.337E-05 | 2.463E-03 |
|---|
| regulation of nitric oxide biosynthetic process | GO:0045428 | | 1.337E-05 | 2.239E-03 |
|---|
| Name | Accession Number | Link | P-val | Corrected P-val |
|---|
| negative regulation of peptide secretion | GO:0002792 | | 1.044E-09 | 2.4E-06 |
|---|
| regulation of protein export from nucleus | GO:0046825 | | 3.122E-09 | 3.59E-06 |
|---|
| organ growth | GO:0035265 | | 7.262E-09 | 5.568E-06 |
|---|
| regulation of growth hormone secretion | GO:0060123 | | 7.262E-09 | 4.176E-06 |
|---|
| cellular response to hormone stimulus | GO:0032870 | | 1.437E-08 | 6.611E-06 |
|---|
| nerve growth factor receptor signaling pathway | GO:0048011 | | 1.448E-08 | 5.551E-06 |
|---|
| regulation of DNA replication | GO:0006275 | | 2.984E-08 | 9.803E-06 |
|---|
| positive regulation of MAP kinase activity | GO:0043406 | | 3.811E-08 | 1.096E-05 |
|---|
| DNA damage response. signal transduction | GO:0042770 | | 7.704E-08 | 1.969E-05 |
|---|
| DNA damage checkpoint | GO:0000077 | | 1.204E-07 | 2.77E-05 |
|---|
| carbohydrate homeostasis | GO:0033500 | | 1.672E-07 | 3.497E-05 |
|---|

