Study Desmedt-ER-neg
Study informations
165 subnetworks in total page | file
2310 genes associated page | file
Enriched GO terms page
General informations
General Index page
Study Index page
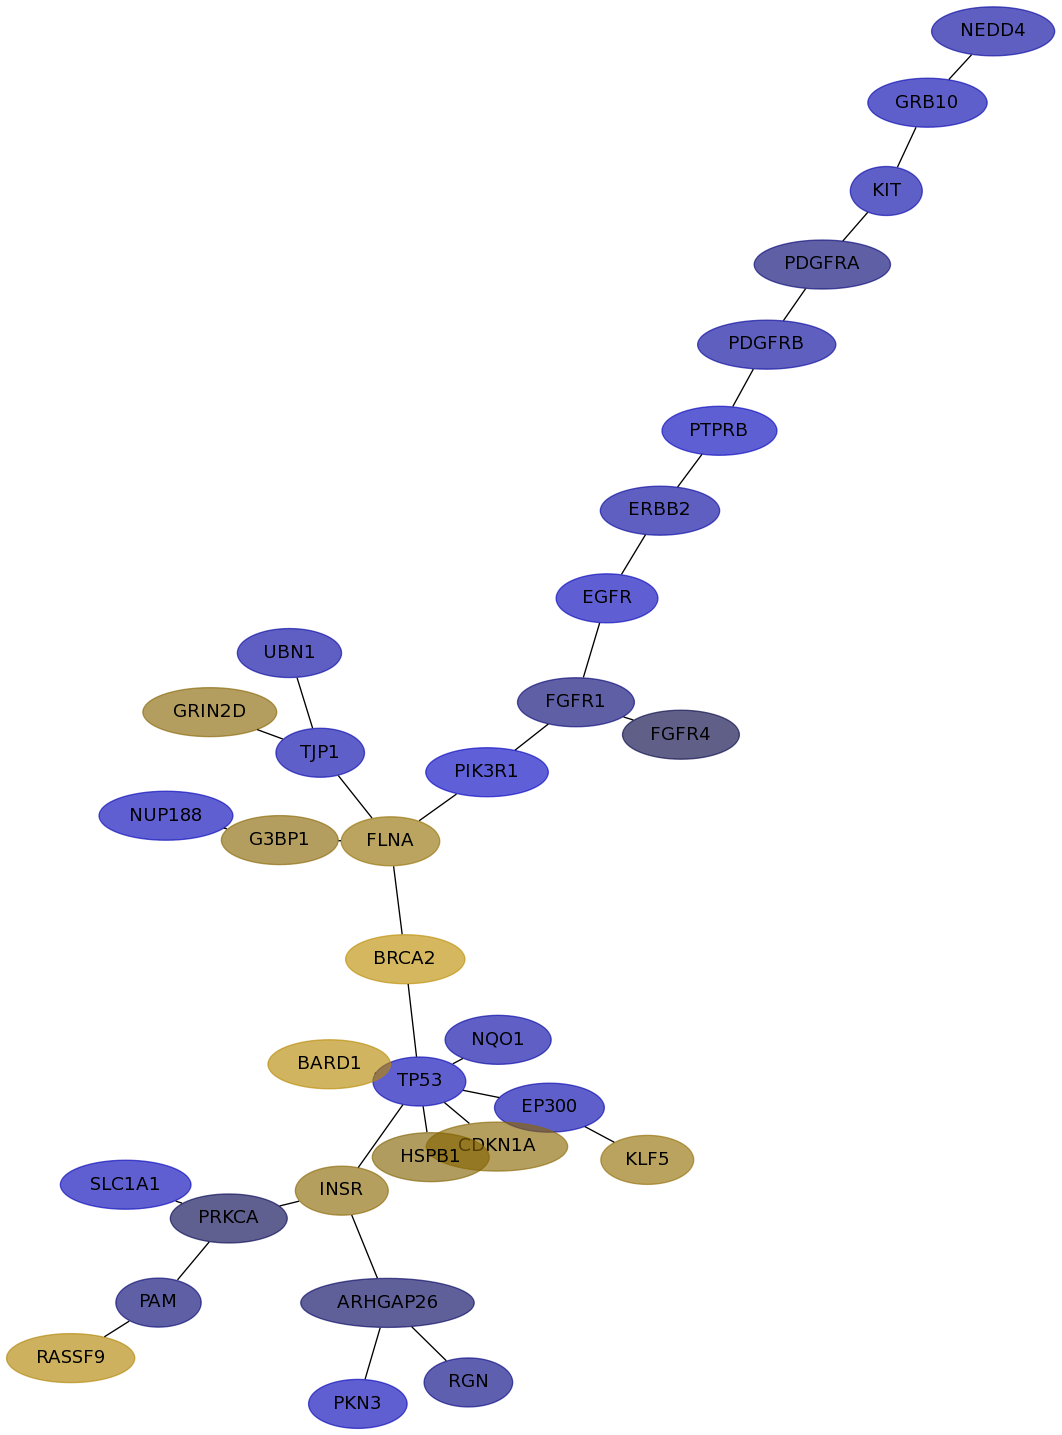
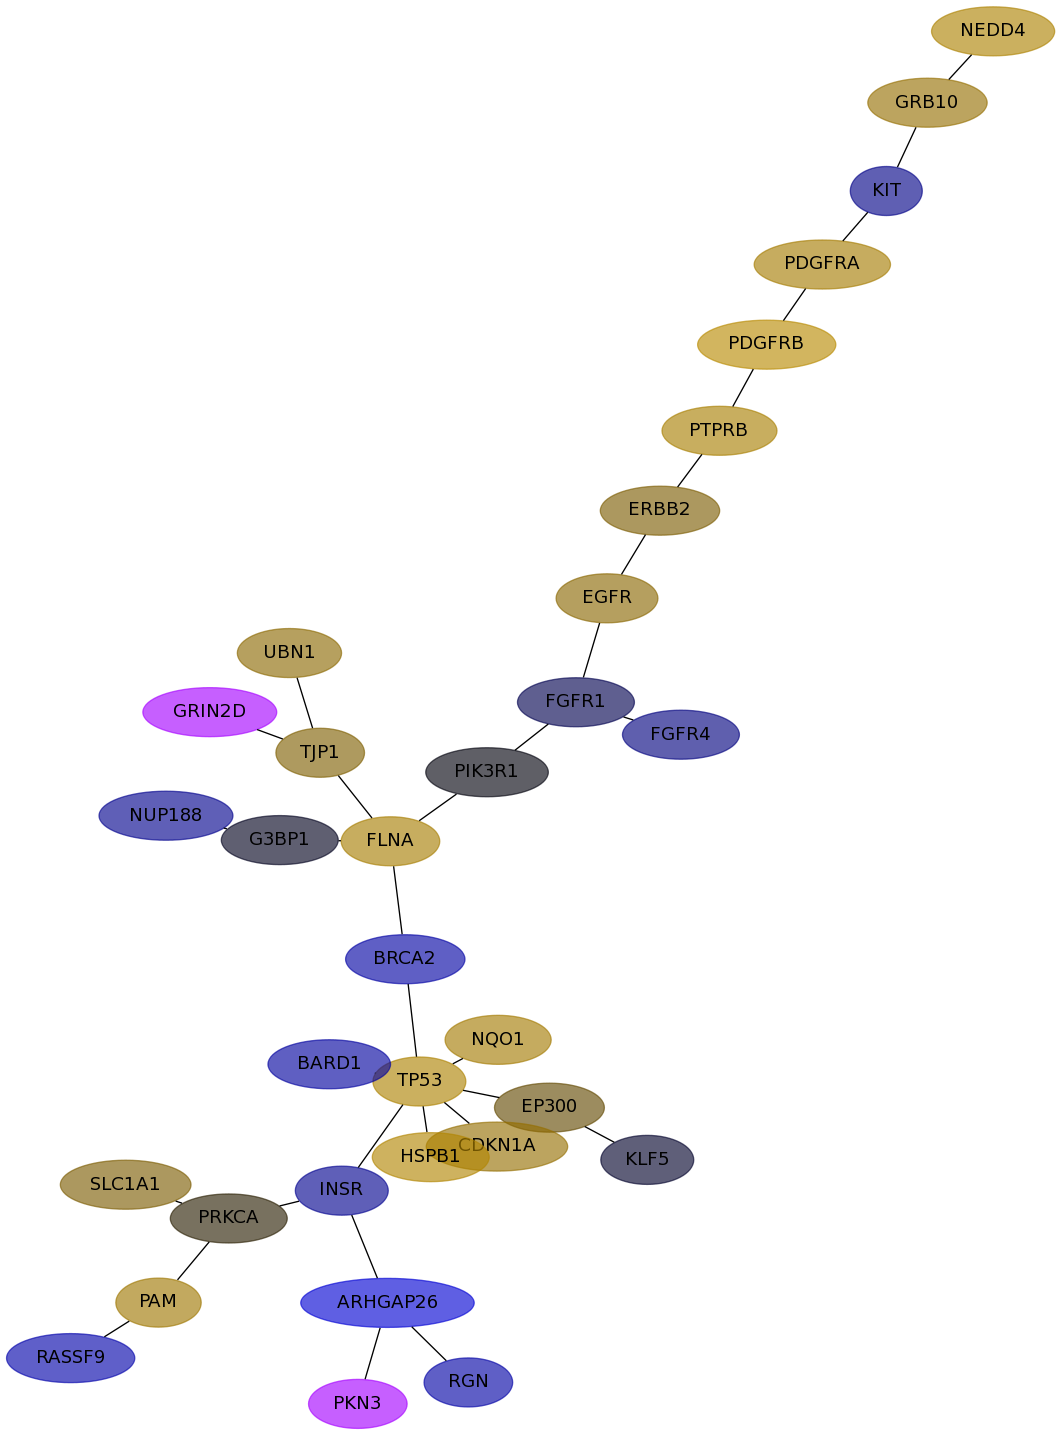
Subnetwork 6376
score
| Dataset | Score | P-val 1 | P-val 2 | P-val 3 | Fisher Score |
|---|
| IPC | 0.7567 | 3.339e-03 | 5.350e-04 | 7.631e-01 | 1.363e-06 |
|---|
| Loi | 0.2293 | 8.178e-02 | 1.176e-02 | 4.319e-01 | 4.154e-04 |
|---|
| Schmidt | 0.6721 | 0.000e+00 | 0.000e+00 | 4.638e-02 | 0.000e+00 |
|---|
| VanDeVijver | 0.7907 | 0.000e+00 | 0.000e+00 | 3.482e-03 | 0.000e+00 |
|---|
| Wang | 0.2604 | 2.840e-03 | 4.527e-02 | 4.031e-01 | 5.182e-05 |
|---|
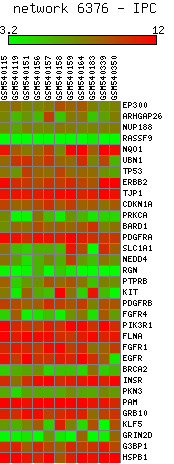
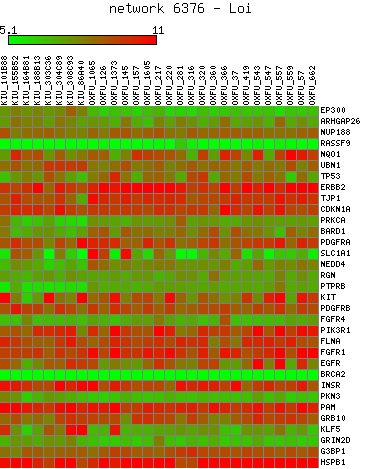
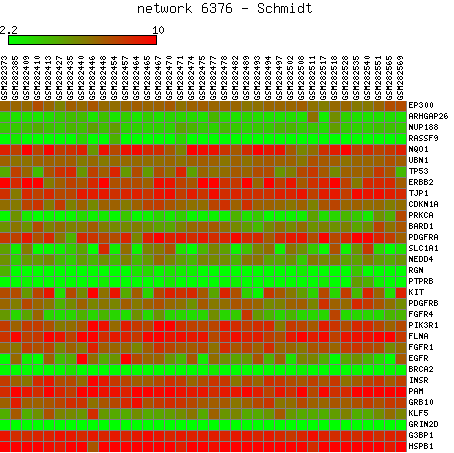
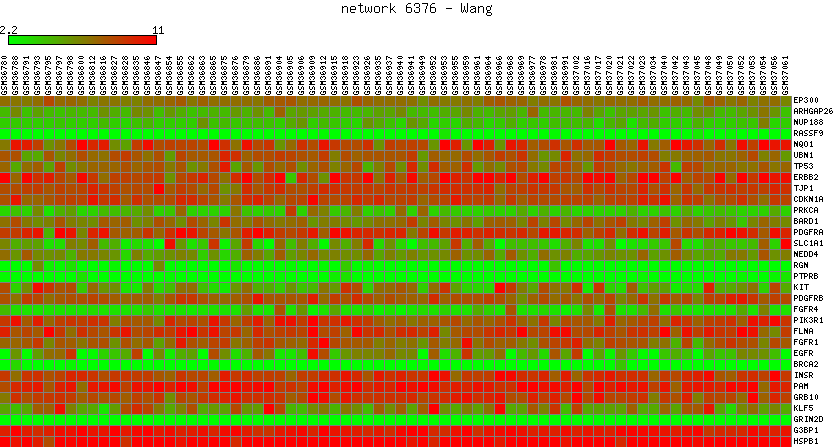
Expression data for subnetwork 6376 in each dataset
IPC |
Loi |
Schmidt |
VanDeVijver |
Wang |
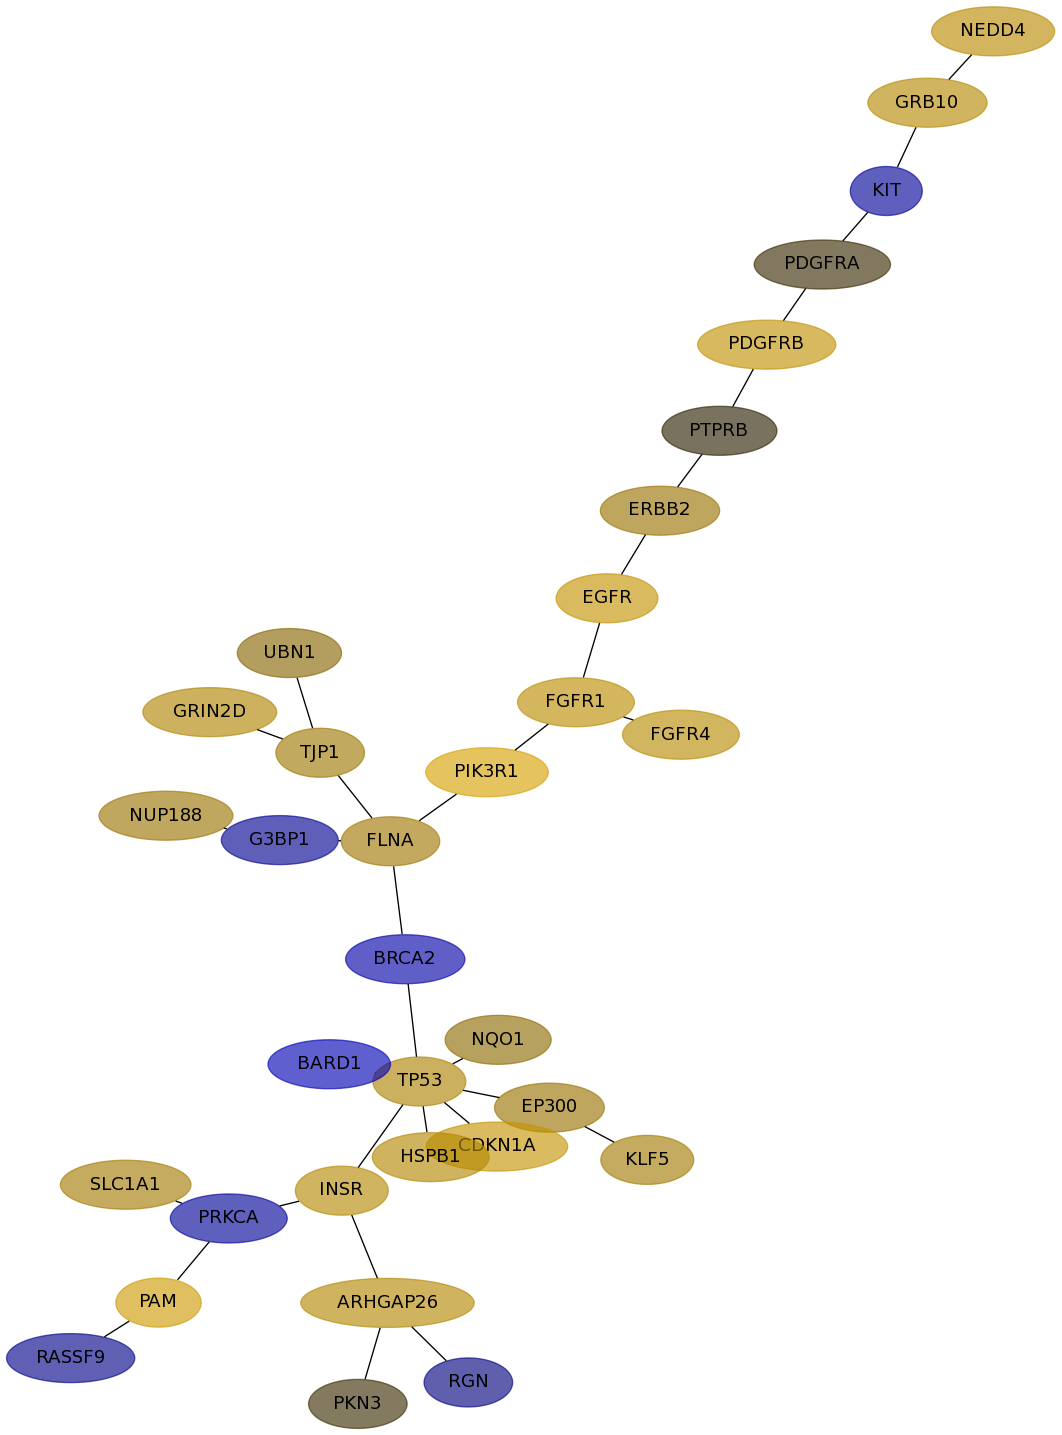
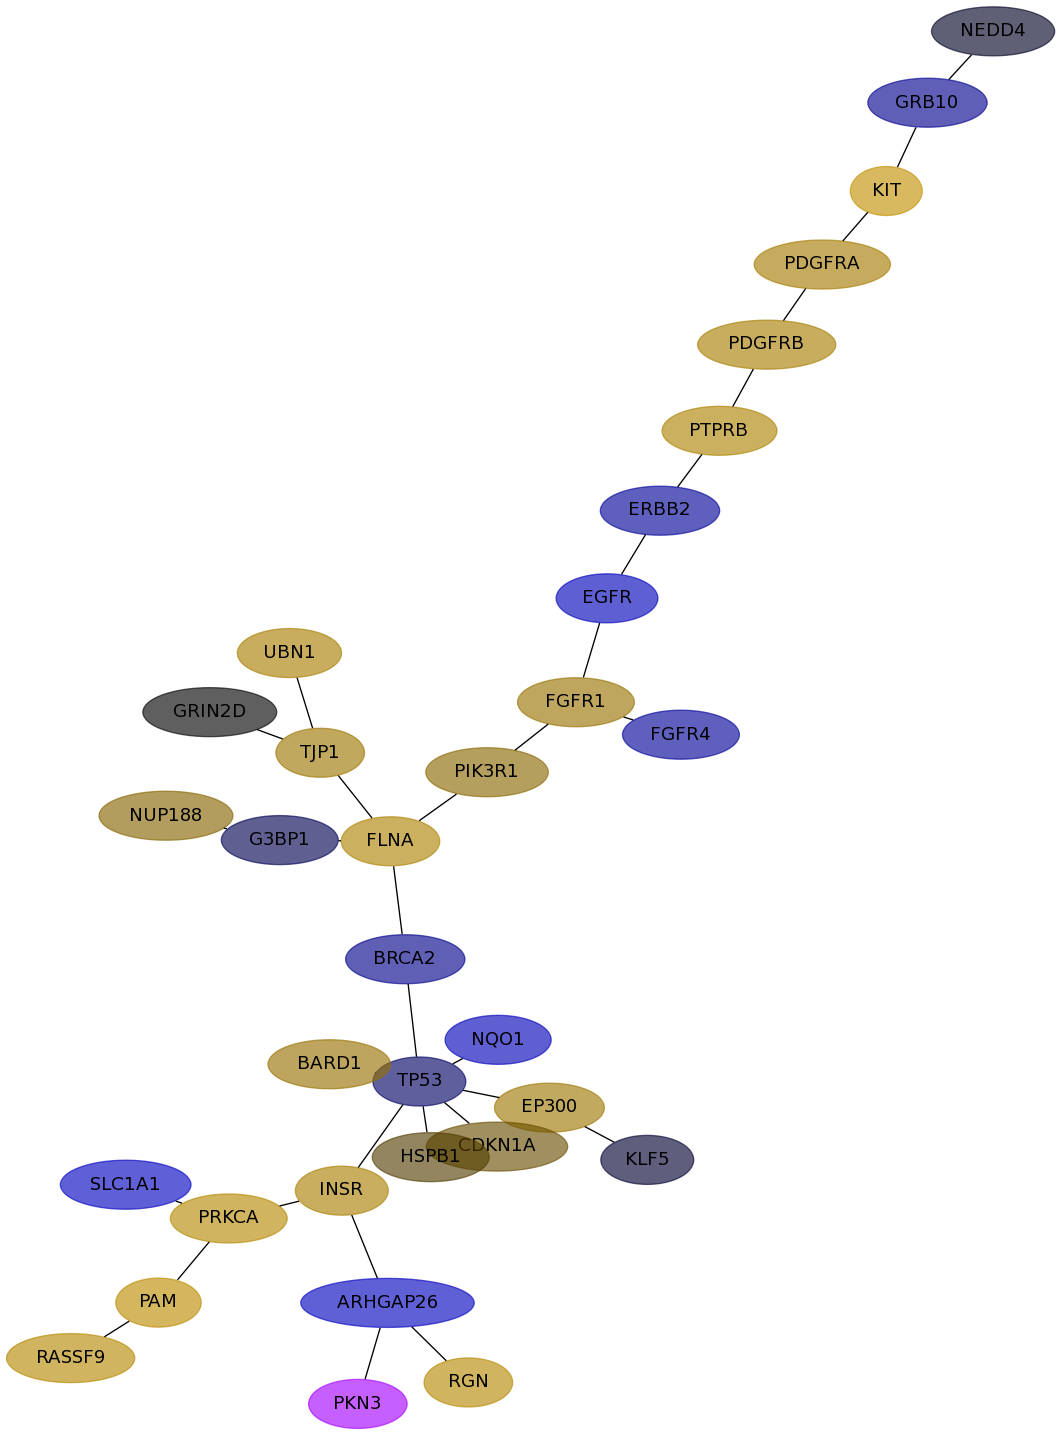
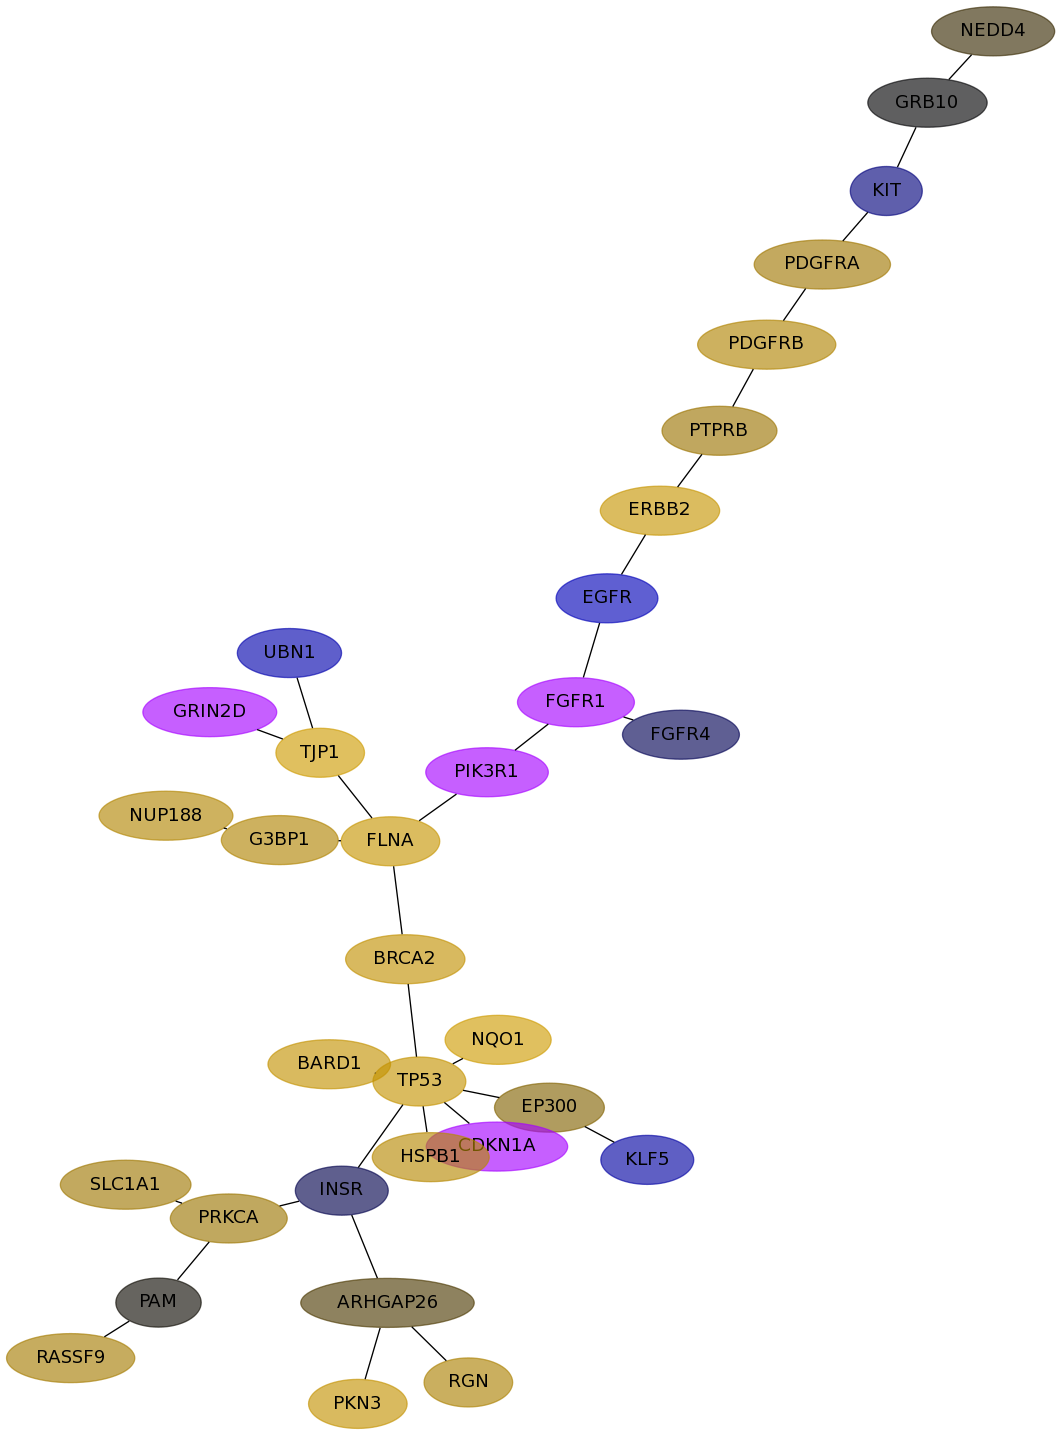
Subnetwork structure for each dataset
- IPC
Score for each gene in subnetwork 6376 in each dataset
| Gene Symbol | Links | Frequency | Frequency Rank | Subnetwork score rank | Global rank |
IPC | Loi | Schmidt | VanDeVijver | Wang |
|---|
| EP300 |   | 113 | 4 | 1 | 4 | -0.149 | 0.087 | 0.102 | 0.052 | 0.025 |
|---|
| ARHGAP26 | | 21 | 73 | 457 | 438 | -0.023 | 0.171 | -0.222 | 0.015 | -0.348 |
|---|
| NUP188 | | 8 | 222 | 1116 | 1079 | -0.187 | 0.094 | 0.058 | 0.161 | -0.070 |
|---|
| RASSF9 | | 4 | 440 | 1102 | 1080 | 0.156 | -0.058 | 0.173 | 0.122 | -0.133 |
|---|
| NQO1 | | 21 | 73 | 366 | 354 | -0.115 | 0.069 | -0.189 | 0.321 | 0.118 |
|---|
| UBN1 | | 3 | 557 | 648 | 647 | -0.106 | 0.059 | 0.130 | -0.144 | 0.066 |
|---|
| TP53 | | 85 | 7 | 1 | 6 | -0.167 | 0.148 | -0.027 | 0.252 | 0.147 |
|---|
| ERBB2 | | 141 | 1 | 1 | 1 | -0.103 | 0.092 | -0.090 | 0.267 | 0.046 |
|---|
| TJP1 | | 8 | 222 | 318 | 325 | -0.139 | 0.102 | 0.099 | 0.319 | 0.049 |
|---|
| CDKN1A | | 110 | 5 | 1 | 5 | 0.064 | 0.254 | 0.030 | undef | 0.082 |
|---|
| PRKCA | | 63 | 15 | 1 | 10 | -0.016 | -0.088 | 0.174 | 0.095 | 0.005 |
|---|
| BARD1 | | 69 | 12 | 141 | 132 | 0.179 | -0.165 | 0.086 | 0.245 | -0.104 |
|---|
| PDGFRA | | 10 | 167 | 141 | 146 | -0.035 | 0.008 | 0.118 | 0.107 | 0.119 |
|---|
| SLC1A1 | | 1 | 1195 | 2299 | 2299 | -0.190 | 0.117 | -0.229 | 0.105 | 0.045 |
|---|
| NEDD4 | | 1 | 1195 | 2299 | 2299 | -0.099 | 0.196 | -0.005 | 0.009 | 0.146 |
|---|
| RGN | | 6 | 301 | 570 | 557 | -0.051 | -0.050 | 0.184 | 0.139 | -0.120 |
|---|
| PTPRB | | 5 | 360 | 991 | 977 | -0.199 | 0.006 | 0.149 | 0.094 | 0.131 |
|---|
| KIT | | 39 | 29 | 1 | 18 | -0.130 | -0.091 | 0.235 | -0.046 | -0.059 |
|---|
| PDGFRB | | 12 | 140 | 141 | 142 | -0.094 | 0.224 | 0.127 | 0.153 | 0.189 |
|---|
| FGFR4 | | 21 | 73 | 179 | 183 | -0.011 | 0.188 | -0.089 | -0.018 | -0.049 |
|---|
| PIK3R1 | | 127 | 2 | 1 | 2 | -0.237 | 0.381 | 0.065 | undef | -0.002 |
|---|
| FLNA | | 50 | 20 | 1 | 14 | 0.081 | 0.107 | 0.148 | 0.268 | 0.126 |
|---|
| FGFR1 | | 26 | 52 | 638 | 615 | -0.036 | 0.200 | 0.087 | undef | -0.015 |
|---|
| EGFR | | 117 | 3 | 1 | 3 | -0.195 | 0.240 | -0.205 | -0.187 | 0.065 |
|---|
| BRCA2 | | 41 | 28 | 236 | 222 | 0.206 | -0.124 | -0.066 | 0.233 | -0.116 |
|---|
| INSR | | 96 | 6 | 236 | 221 | 0.063 | 0.173 | 0.135 | -0.014 | -0.072 |
|---|
| PKN3 | | 18 | 86 | 179 | 187 | -0.181 | 0.009 | undef | 0.239 | undef |
|---|
| PAM | | 10 | 167 | 638 | 621 | -0.035 | 0.307 | 0.200 | 0.002 | 0.104 |
|---|
| GRB10 | | 3 | 557 | 727 | 728 | -0.149 | 0.182 | -0.070 | -0.000 | 0.081 |
|---|
| KLF5 | | 76 | 9 | 1 | 7 | 0.077 | 0.117 | -0.007 | -0.110 | -0.006 |
|---|
| GRIN2D | | 13 | 124 | 552 | 522 | 0.058 | 0.155 | 0.000 | undef | undef |
|---|
| G3BP1 | | 7 | 256 | 1116 | 1082 | 0.060 | -0.077 | -0.017 | 0.155 | -0.004 |
|---|
| HSPB1 | | 22 | 69 | 1 | 25 | 0.053 | 0.169 | 0.017 | 0.179 | 0.161 |
|---|
GO Enrichment output for subnetwork 6376 in each dataset
| Name | Accession Number | Link | P-val | Corrected P-val |
|---|
| induction of apoptosis by intracellular signals | GO:0008629 |  | 2.043E-09 | 4.992E-06 |
|---|
| response to UV | GO:0009411 | | 7.122E-09 | 8.699E-06 |
|---|
| protein amino acid autophosphorylation | GO:0046777 | | 1.807E-08 | 1.472E-05 |
|---|
| negative regulation of transport | GO:0051051 | | 1.009E-07 | 6.162E-05 |
|---|
| regulation of DNA replication | GO:0006275 | | 3.781E-07 | 1.847E-04 |
|---|
| negative regulation of phosphorylation | GO:0042326 | | 4.483E-07 | 1.825E-04 |
|---|
| positive regulation of cell migration | GO:0030335 | | 4.516E-07 | 1.576E-04 |
|---|
| negative regulation of insulin receptor signaling pathway | GO:0046627 | | 6.023E-07 | 1.839E-04 |
|---|
| peptidyl-tyrosine phosphorylation | GO:0018108 | | 6.281E-07 | 1.705E-04 |
|---|
| negative regulation of phosphorus metabolic process | GO:0010563 | | 6.281E-07 | 1.535E-04 |
|---|
| insulin receptor signaling pathway | GO:0008286 | | 7.359E-07 | 1.634E-04 |
|---|
| Name | Accession Number | Link | P-val | Corrected P-val |
|---|
| induction of apoptosis by intracellular signals | GO:0008629 | | 2.724E-09 | 6.555E-06 |
|---|
| response to UV | GO:0009411 | | 7.545E-09 | 9.077E-06 |
|---|
| protein amino acid autophosphorylation | GO:0046777 | | 1.62E-08 | 1.3E-05 |
|---|
| negative regulation of transport | GO:0051051 | | 1.248E-07 | 7.508E-05 |
|---|
| regulation of DNA replication | GO:0006275 | | 4.813E-07 | 2.316E-04 |
|---|
| positive regulation of cell migration | GO:0030335 | | 5.264E-07 | 2.111E-04 |
|---|
| negative regulation of phosphorylation | GO:0042326 | | 5.463E-07 | 1.878E-04 |
|---|
| negative regulation of insulin receptor signaling pathway | GO:0046627 | | 7.008E-07 | 2.108E-04 |
|---|
| insulin receptor signaling pathway | GO:0008286 | | 7.654E-07 | 2.046E-04 |
|---|
| peptidyl-tyrosine phosphorylation | GO:0018108 | | 7.654E-07 | 1.842E-04 |
|---|
| negative regulation of phosphorus metabolic process | GO:0010563 | | 7.654E-07 | 1.674E-04 |
|---|
| Name | Accession Number | Link | P-val | Corrected P-val |
|---|
| induction of apoptosis by intracellular signals | GO:0008629 | | 7.965E-09 | 1.832E-05 |
|---|
| protein amino acid autophosphorylation | GO:0046777 | | 1.665E-08 | 1.915E-05 |
|---|
| response to UV | GO:0009411 | | 1.91E-08 | 1.464E-05 |
|---|
| negative regulation of transport | GO:0051051 | | 3.205E-07 | 1.843E-04 |
|---|
| regulation of DNA replication | GO:0006275 | | 9.929E-07 | 4.567E-04 |
|---|
| regulation of fibroblast proliferation | GO:0048145 | | 1.288E-06 | 4.936E-04 |
|---|
| positive regulation of cell migration | GO:0030335 | | 1.35E-06 | 4.437E-04 |
|---|
| peptidyl-tyrosine phosphorylation | GO:0018108 | | 1.554E-06 | 4.468E-04 |
|---|
| negative regulation of phosphorylation | GO:0042326 | | 1.554E-06 | 3.972E-04 |
|---|
| response to light stimulus | GO:0009416 | | 1.631E-06 | 3.752E-04 |
|---|
| negative regulation of insulin receptor signaling pathway | GO:0046627 | | 1.78E-06 | 3.721E-04 |
|---|
VanDeVijver file
| Name | Accession Number | Link | P-val | Corrected P-val |
|---|
| protein amino acid autophosphorylation | GO:0046777 | | 1.335E-10 | 2.46E-07 |
|---|
| positive regulation of cell migration | GO:0030335 | | 5.631E-08 | 5.189E-05 |
|---|
| positive regulation of cell motion | GO:0051272 | | 8.55E-08 | 5.252E-05 |
|---|
| peptidyl-tyrosine phosphorylation | GO:0018108 | | 2.414E-07 | 1.112E-04 |
|---|
| positive regulation of MAP kinase activity | GO:0043406 | | 2.777E-07 | 1.024E-04 |
|---|
| peptidyl-tyrosine modification | GO:0018212 | | 3.012E-07 | 9.251E-05 |
|---|
| peptidyl-amino acid modification | GO:0018193 | | 7.15E-07 | 1.883E-04 |
|---|
| regulation of MAP kinase activity | GO:0043405 | | 1.259E-06 | 2.901E-04 |
|---|
| regulation of cell migration | GO:0030334 | | 1.817E-06 | 3.72E-04 |
|---|
| regulation of DNA replication | GO:0006275 | | 1.914E-06 | 3.527E-04 |
|---|
| platelet-derived growth factor receptor signaling pathway | GO:0048008 | | 2.035E-06 | 3.41E-04 |
|---|
| Name | Accession Number | Link | P-val | Corrected P-val |
|---|
| induction of apoptosis by intracellular signals | GO:0008629 | | 7.965E-09 | 1.832E-05 |
|---|
| protein amino acid autophosphorylation | GO:0046777 | | 1.665E-08 | 1.915E-05 |
|---|
| response to UV | GO:0009411 | | 1.91E-08 | 1.464E-05 |
|---|
| negative regulation of transport | GO:0051051 | | 3.205E-07 | 1.843E-04 |
|---|
| regulation of DNA replication | GO:0006275 | | 9.929E-07 | 4.567E-04 |
|---|
| regulation of fibroblast proliferation | GO:0048145 | | 1.288E-06 | 4.936E-04 |
|---|
| positive regulation of cell migration | GO:0030335 | | 1.35E-06 | 4.437E-04 |
|---|
| peptidyl-tyrosine phosphorylation | GO:0018108 | | 1.554E-06 | 4.468E-04 |
|---|
| negative regulation of phosphorylation | GO:0042326 | | 1.554E-06 | 3.972E-04 |
|---|
| response to light stimulus | GO:0009416 | | 1.631E-06 | 3.752E-04 |
|---|
| negative regulation of insulin receptor signaling pathway | GO:0046627 | | 1.78E-06 | 3.721E-04 |
|---|

