Study Desmedt-ER-neg
Study informations
165 subnetworks in total page | file
2310 genes associated page | file
Enriched GO terms page
General informations
General Index page
Study Index page
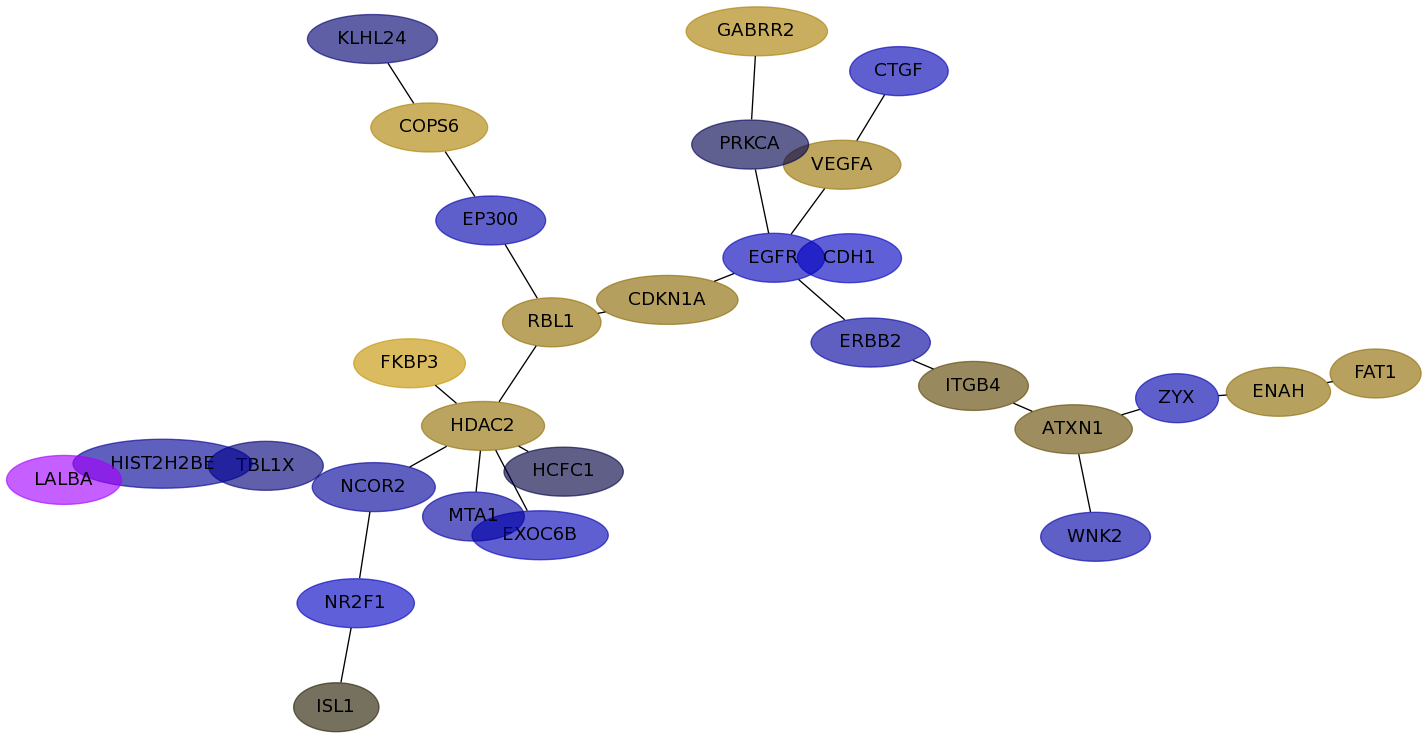
Subnetwork 6286
score
| Dataset | Score | P-val 1 | P-val 2 | P-val 3 | Fisher Score |
|---|
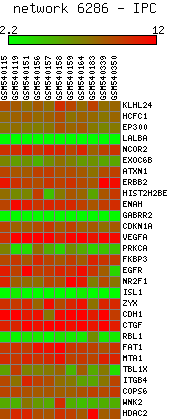
| IPC | 0.7587 | 3.223e-03 | 5.120e-04 | 7.578e-01 | 1.250e-06 |
|---|
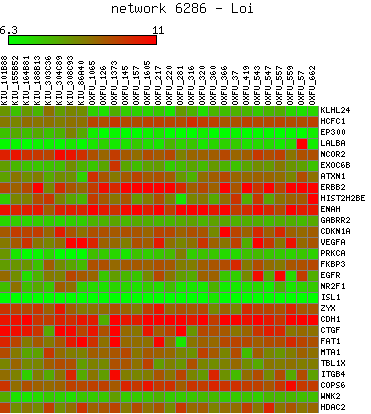
| Loi | 0.2290 | 8.230e-02 | 1.190e-02 | 4.331e-01 | 4.243e-04 |
|---|
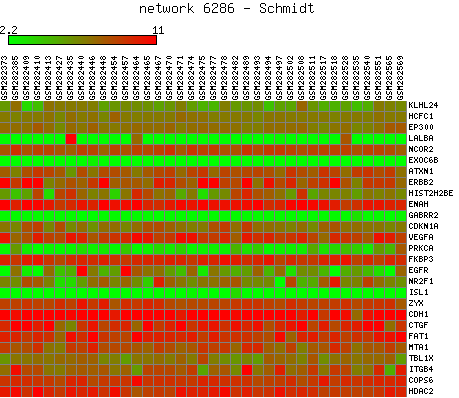
| Schmidt | 0.6714 | 0.000e+00 | 0.000e+00 | 4.709e-02 | 0.000e+00 |
|---|
| VanDeVijver | 0.7906 | 0.000e+00 | 0.000e+00 | 3.493e-03 | 0.000e+00 |
|---|
| Wang | 0.2598 | 2.921e-03 | 4.599e-02 | 4.063e-01 | 5.459e-05 |
|---|
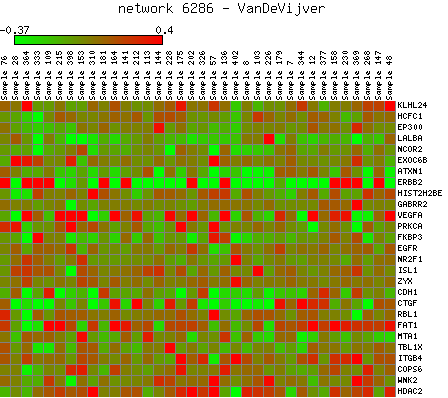
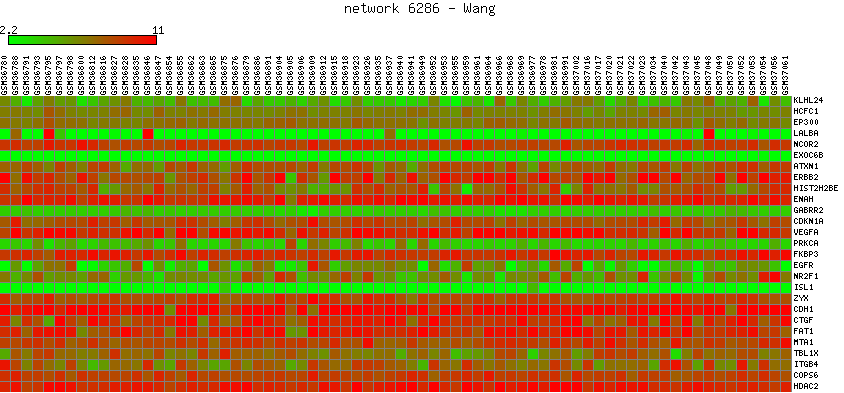
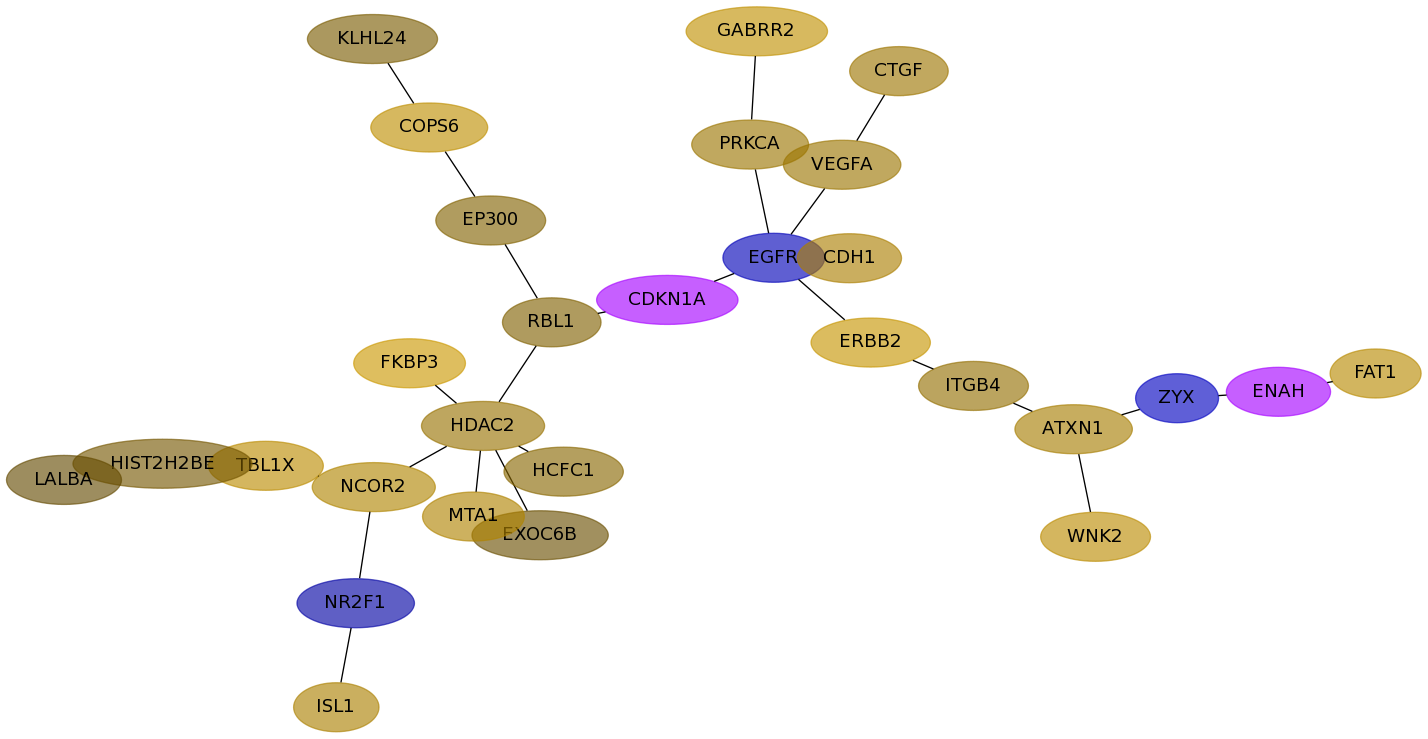
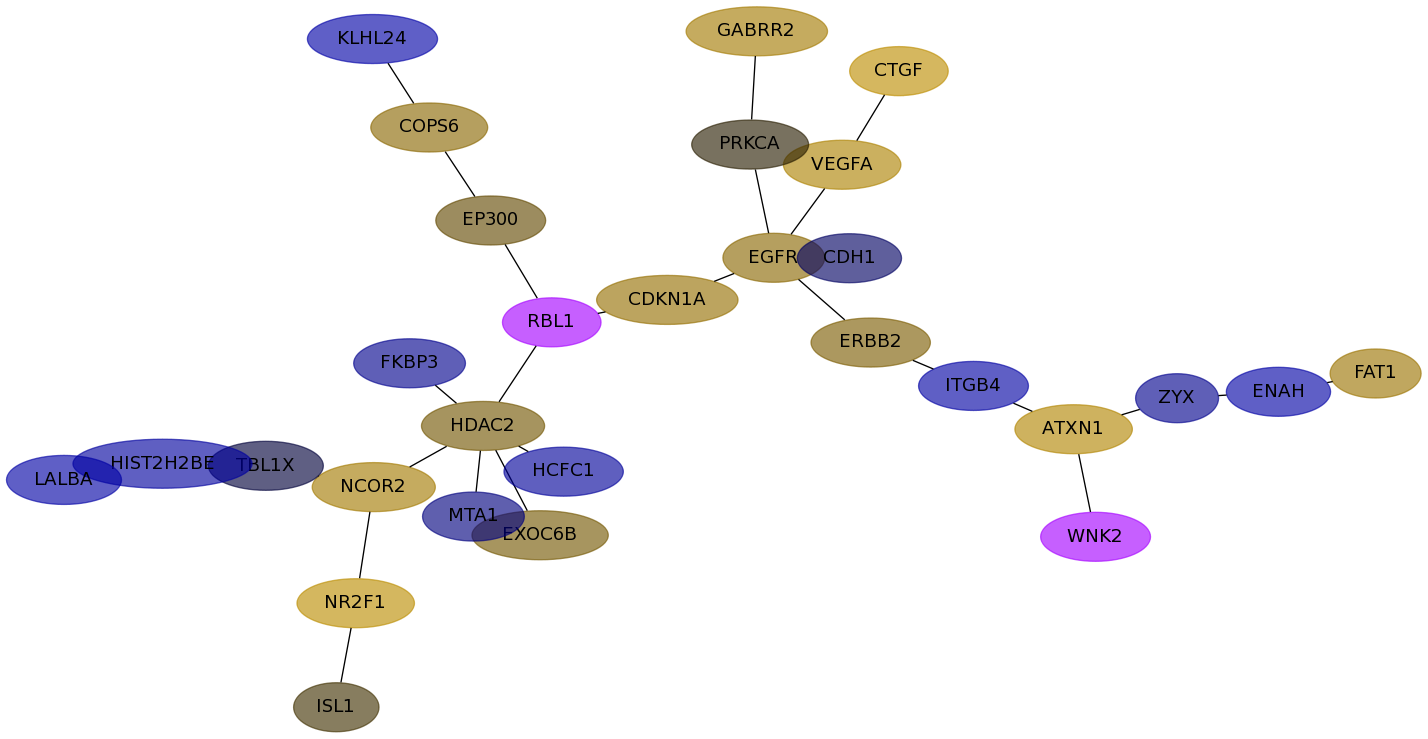
Expression data for subnetwork 6286 in each dataset
IPC |
Loi |
Schmidt |
VanDeVijver |
Wang |
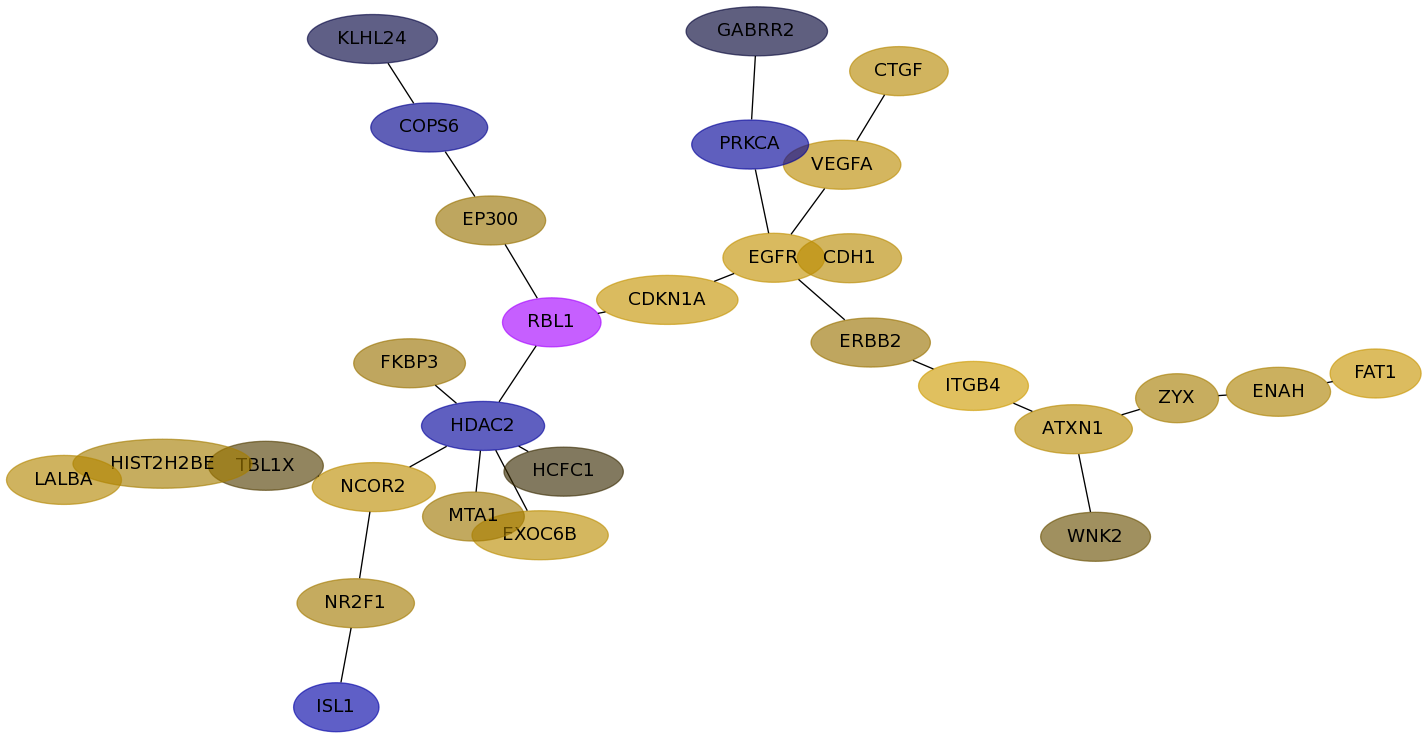
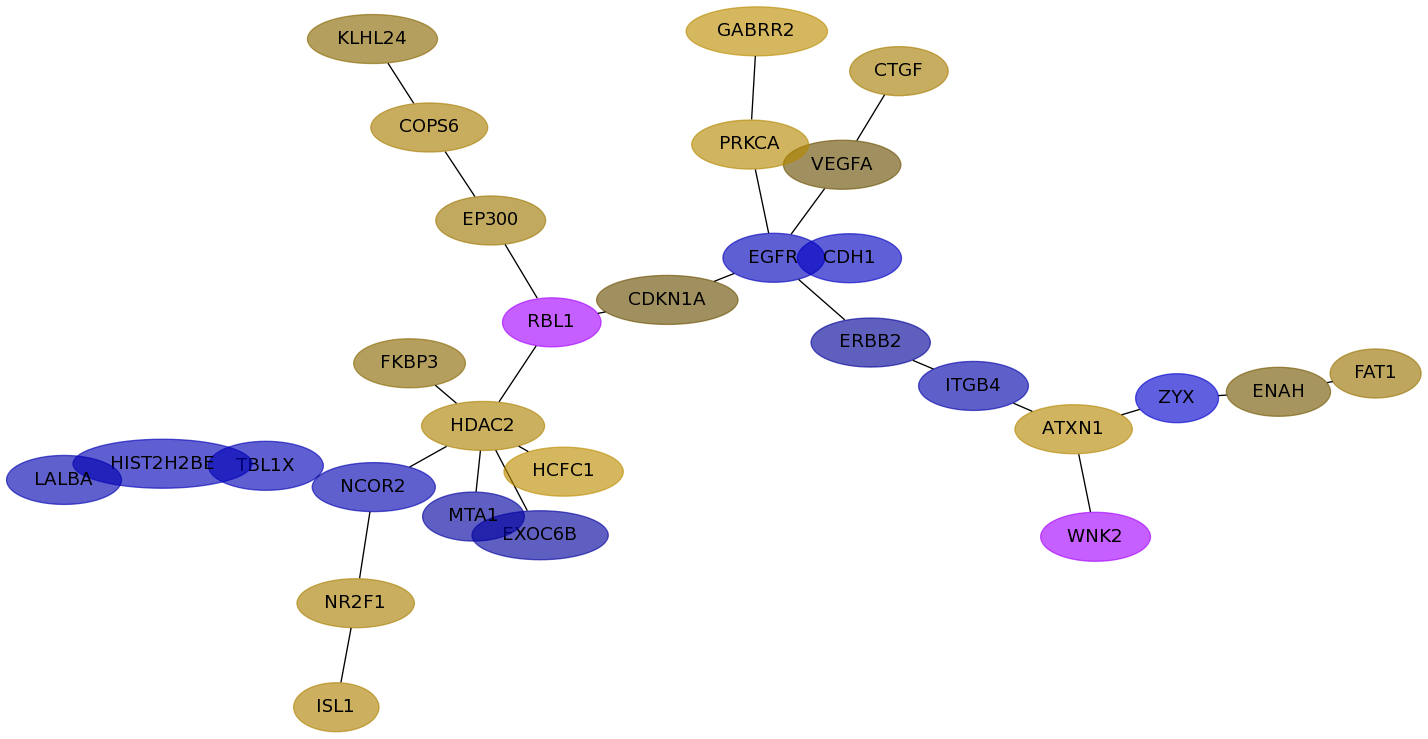
Subnetwork structure for each dataset
- IPC
Score for each gene in subnetwork 6286 in each dataset
| Gene Symbol | Links | Frequency | Frequency Rank | Subnetwork score rank | Global rank |
IPC | Loi | Schmidt | VanDeVijver | Wang |
|---|
| KLHL24 |   | 4 | 440 | 682 | 678 | -0.036 | -0.011 | 0.062 | 0.044 | -0.125 |
|---|
| HCFC1 | | 4 | 440 | 648 | 645 | -0.011 | 0.009 | 0.209 | 0.061 | -0.093 |
|---|
| EP300 | | 113 | 4 | 1 | 4 | -0.149 | 0.087 | 0.102 | 0.052 | 0.025 |
|---|
| LALBA | | 1 | 1195 | 2047 | 2050 | undef | 0.170 | -0.155 | 0.026 | -0.118 |
|---|
| NCOR2 | | 32 | 40 | 318 | 290 | -0.096 | 0.211 | -0.163 | 0.158 | 0.114 |
|---|
| EXOC6B | | 6 | 301 | 318 | 330 | -0.183 | 0.205 | -0.104 | 0.030 | 0.037 |
|---|
| ATXN1 | | 17 | 95 | 1 | 29 | 0.026 | 0.192 | 0.175 | 0.125 | 0.163 |
|---|
| ERBB2 | | 141 | 1 | 1 | 1 | -0.103 | 0.092 | -0.090 | 0.267 | 0.046 |
|---|
| HIST2H2BE | | 1 | 1195 | 2047 | 2050 | -0.086 | 0.123 | -0.180 | 0.039 | -0.104 |
|---|
| ENAH | | 1 | 1195 | 2047 | 2050 | 0.069 | 0.146 | 0.038 | undef | -0.123 |
|---|
| GABRR2 | | 3 | 557 | 882 | 871 | 0.135 | -0.008 | 0.204 | 0.225 | 0.115 |
|---|
| CDKN1A | | 110 | 5 | 1 | 5 | 0.064 | 0.254 | 0.030 | undef | 0.082 |
|---|
| VEGFA | | 68 | 14 | 83 | 78 | 0.090 | 0.200 | 0.030 | 0.095 | 0.148 |
|---|
| PRKCA | | 63 | 15 | 1 | 10 | -0.016 | -0.088 | 0.174 | 0.095 | 0.005 |
|---|
| FKBP3 | | 2 | 743 | 2038 | 2020 | 0.255 | 0.091 | 0.062 | 0.299 | -0.068 |
|---|
| EGFR | | 117 | 3 | 1 | 3 | -0.195 | 0.240 | -0.205 | -0.187 | 0.065 |
|---|
| NR2F1 | | 25 | 59 | 83 | 92 | -0.252 | 0.113 | 0.133 | -0.116 | 0.207 |
|---|
| ISL1 | | 1 | 1195 | 2047 | 2050 | 0.005 | -0.124 | 0.149 | 0.142 | 0.011 |
|---|
| ZYX | | 1 | 1195 | 2047 | 2050 | -0.147 | 0.125 | -0.320 | -0.230 | -0.070 |
|---|
| CDH1 | | 37 | 32 | 296 | 278 | -0.227 | 0.187 | -0.236 | 0.137 | -0.024 |
|---|
| CTGF | | 32 | 40 | 318 | 290 | -0.169 | 0.181 | 0.126 | 0.101 | 0.209 |
|---|
| RBL1 | | 21 | 73 | 1 | 27 | 0.078 | undef | undef | 0.051 | undef |
|---|
| FAT1 | | 2 | 743 | 1735 | 1721 | 0.071 | 0.269 | 0.087 | 0.186 | 0.094 |
|---|
| MTA1 | | 2 | 743 | 2038 | 2020 | -0.112 | 0.103 | -0.107 | 0.155 | -0.048 |
|---|
| TBL1X | | 4 | 440 | 1735 | 1699 | -0.044 | 0.017 | -0.192 | 0.198 | -0.009 |
|---|
| ITGB4 | | 35 | 34 | 1 | 20 | 0.021 | 0.313 | -0.134 | 0.080 | -0.114 |
|---|
| COPS6 | | 16 | 104 | 1 | 31 | 0.147 | -0.068 | 0.128 | 0.216 | 0.065 |
|---|
| WNK2 | | 7 | 256 | 1 | 47 | -0.127 | 0.029 | undef | 0.201 | undef |
|---|
| HDAC2 | | 13 | 124 | 318 | 316 | 0.079 | -0.094 | 0.148 | 0.089 | 0.037 |
|---|
GO Enrichment output for subnetwork 6286 in each dataset
| Name | Accession Number | Link | P-val | Corrected P-val |
|---|
| induction of positive chemotaxis | GO:0050930 |  | 5.477E-09 | 1.338E-05 |
|---|
| regulation of positive chemotaxis | GO:0050926 | | 2.139E-08 | 2.613E-05 |
|---|
| positive regulation of locomotion | GO:0040017 | | 3.098E-07 | 2.523E-04 |
|---|
| regulation of chemotaxis | GO:0050920 | | 3.743E-07 | 2.286E-04 |
|---|
| negative regulation of phosphorylation | GO:0042326 | | 4.483E-07 | 2.19E-04 |
|---|
| regulation of behavior | GO:0050795 | | 5.326E-07 | 2.168E-04 |
|---|
| negative regulation of insulin receptor signaling pathway | GO:0046627 | | 6.023E-07 | 2.102E-04 |
|---|
| vesicle docking during exocytosis | GO:0006904 | | 6.281E-07 | 1.918E-04 |
|---|
| negative regulation of phosphorus metabolic process | GO:0010563 | | 6.281E-07 | 1.705E-04 |
|---|
| vesicle docking | GO:0048278 | | 8.568E-07 | 2.093E-04 |
|---|
| regulation of insulin receptor signaling pathway | GO:0046626 | | 2.053E-06 | 4.56E-04 |
|---|
| Name | Accession Number | Link | P-val | Corrected P-val |
|---|
| induction of positive chemotaxis | GO:0050930 | | 3.965E-09 | 9.54E-06 |
|---|
| regulation of positive chemotaxis | GO:0050926 | | 1.549E-08 | 1.864E-05 |
|---|
| positive regulation of locomotion | GO:0040017 | | 1.842E-07 | 1.478E-04 |
|---|
| regulation of chemotaxis | GO:0050920 | | 2.248E-07 | 1.352E-04 |
|---|
| regulation of behavior | GO:0050795 | | 3.253E-07 | 1.565E-04 |
|---|
| negative regulation of phosphorylation | GO:0042326 | | 3.253E-07 | 1.304E-04 |
|---|
| negative regulation of phosphorus metabolic process | GO:0010563 | | 4.56E-07 | 1.567E-04 |
|---|
| negative regulation of insulin receptor signaling pathway | GO:0046627 | | 4.749E-07 | 1.428E-04 |
|---|
| regulation of insulin receptor signaling pathway | GO:0046626 | | 1.62E-06 | 4.33E-04 |
|---|
| chondrocyte differentiation | GO:0002062 | | 2.223E-06 | 5.349E-04 |
|---|
| negative regulation of glucose import | GO:0046325 | | 2.223E-06 | 4.862E-04 |
|---|
| Name | Accession Number | Link | P-val | Corrected P-val |
|---|
| induction of positive chemotaxis | GO:0050930 | | 6.546E-09 | 1.506E-05 |
|---|
| regulation of positive chemotaxis | GO:0050926 | | 3.064E-08 | 3.523E-05 |
|---|
| positive regulation of locomotion | GO:0040017 | | 4.403E-07 | 3.376E-04 |
|---|
| regulation of chemotaxis | GO:0050920 | | 5.426E-07 | 3.12E-04 |
|---|
| regulation of behavior | GO:0050795 | | 6.616E-07 | 3.043E-04 |
|---|
| negative regulation of phosphorylation | GO:0042326 | | 7.99E-07 | 3.063E-04 |
|---|
| negative regulation of insulin receptor signaling pathway | GO:0046627 | | 1.08E-06 | 3.548E-04 |
|---|
| negative regulation of phosphorus metabolic process | GO:0010563 | | 1.136E-06 | 3.266E-04 |
|---|
| regulation of insulin receptor signaling pathway | GO:0046626 | | 2.58E-06 | 6.593E-04 |
|---|
| chondrocyte differentiation | GO:0002062 | | 5.045E-06 | 1.16E-03 |
|---|
| negative regulation of glucose import | GO:0046325 | | 5.045E-06 | 1.055E-03 |
|---|
VanDeVijver file
| Name | Accession Number | Link | P-val | Corrected P-val |
|---|
| positive regulation of epithelial cell proliferation | GO:0050679 | | 1.324E-05 | 0.024404 |
|---|
| defense response to bacterium | GO:0042742 | | 1.033E-04 | 0.09517409 |
|---|
| histone modification | GO:0016570 | | 1.154E-04 | 0.07090072 |
|---|
| protein amino acid autophosphorylation | GO:0046777 | | 1.154E-04 | 0.05317554 |
|---|
| mRNA stabilization | GO:0048255 | | 1.159E-04 | 0.04271691 |
|---|
| regulation of phospholipase A2 activity | GO:0032429 | | 1.159E-04 | 0.03559743 |
|---|
| spinal cord motor neuron differentiation | GO:0021522 | | 1.159E-04 | 0.03051208 |
|---|
| peptidyl-lysine modification | GO:0018205 | | 1.159E-04 | 0.02669807 |
|---|
| positive regulation of blood vessel endothelial cell migration | GO:0043536 | | 1.159E-04 | 0.02373162 |
|---|
| positive regulation of cell cycle | GO:0045787 | | 1.284E-04 | 0.02367019 |
|---|
| regulation of epithelial cell proliferation | GO:0050678 | | 1.284E-04 | 0.02151835 |
|---|
| Name | Accession Number | Link | P-val | Corrected P-val |
|---|
| induction of positive chemotaxis | GO:0050930 | | 6.546E-09 | 1.506E-05 |
|---|
| regulation of positive chemotaxis | GO:0050926 | | 3.064E-08 | 3.523E-05 |
|---|
| positive regulation of locomotion | GO:0040017 | | 4.403E-07 | 3.376E-04 |
|---|
| regulation of chemotaxis | GO:0050920 | | 5.426E-07 | 3.12E-04 |
|---|
| regulation of behavior | GO:0050795 | | 6.616E-07 | 3.043E-04 |
|---|
| negative regulation of phosphorylation | GO:0042326 | | 7.99E-07 | 3.063E-04 |
|---|
| negative regulation of insulin receptor signaling pathway | GO:0046627 | | 1.08E-06 | 3.548E-04 |
|---|
| negative regulation of phosphorus metabolic process | GO:0010563 | | 1.136E-06 | 3.266E-04 |
|---|
| regulation of insulin receptor signaling pathway | GO:0046626 | | 2.58E-06 | 6.593E-04 |
|---|
| chondrocyte differentiation | GO:0002062 | | 5.045E-06 | 1.16E-03 |
|---|
| negative regulation of glucose import | GO:0046325 | | 5.045E-06 | 1.055E-03 |
|---|

