Study VanDeVijver-ER-neg
Study informations
122 subnetworks in total page | file
1481 genes associated page | file
Enriched GO terms page
General informations
General Index page
Study Index page
Subnetwork 1130
score
| Dataset | Score | P-val 1 | P-val 2 | P-val 3 | Fisher Score |
|---|
| Desmedt | 0.3328 | 1.542e-03 | 2.700e-05 | 1.639e-01 | 6.826e-09 |
|---|
| IPC | 0.3385 | 3.526e-01 | 1.818e-01 | 9.364e-01 | 6.002e-02 |
|---|
| Loi | 0.4739 | 6.200e-05 | 0.000e+00 | 5.468e-02 | 0.000e+00 |
|---|
| Schmidt | 0.5992 | 1.000e-06 | 0.000e+00 | 1.145e-01 | 0.000e+00 |
|---|
| Wang | 0.2582 | 7.376e-03 | 6.485e-02 | 2.261e-01 | 1.082e-04 |
|---|
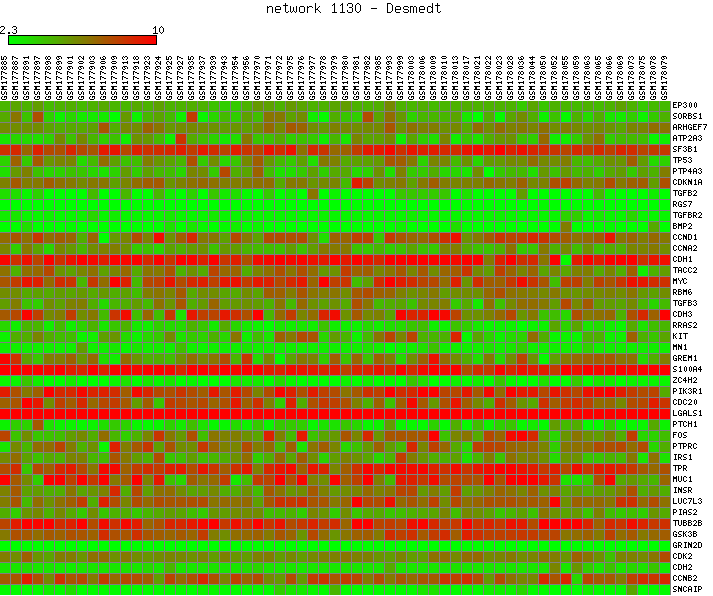
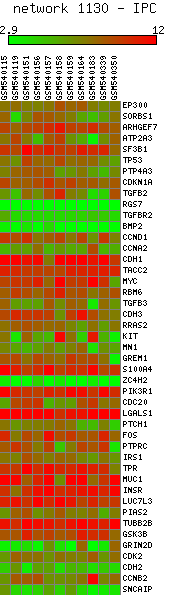
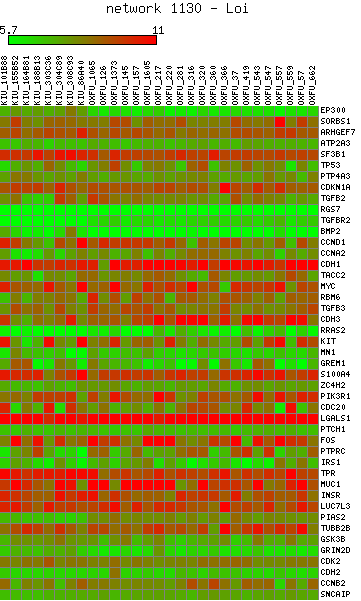
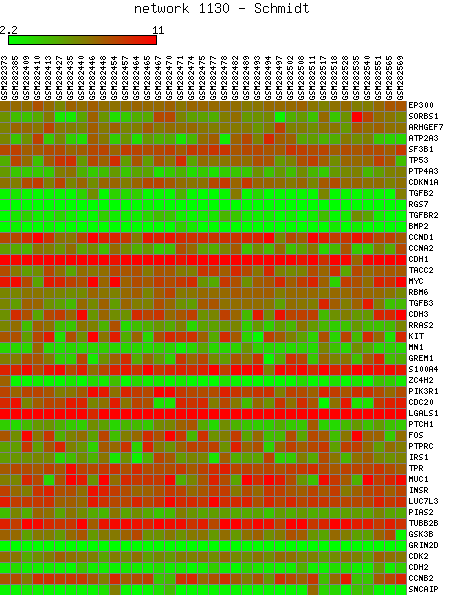
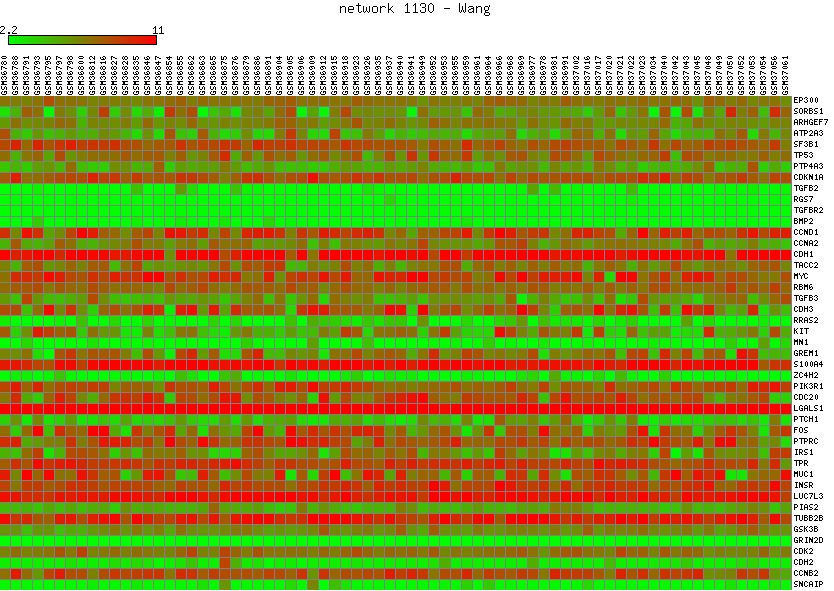
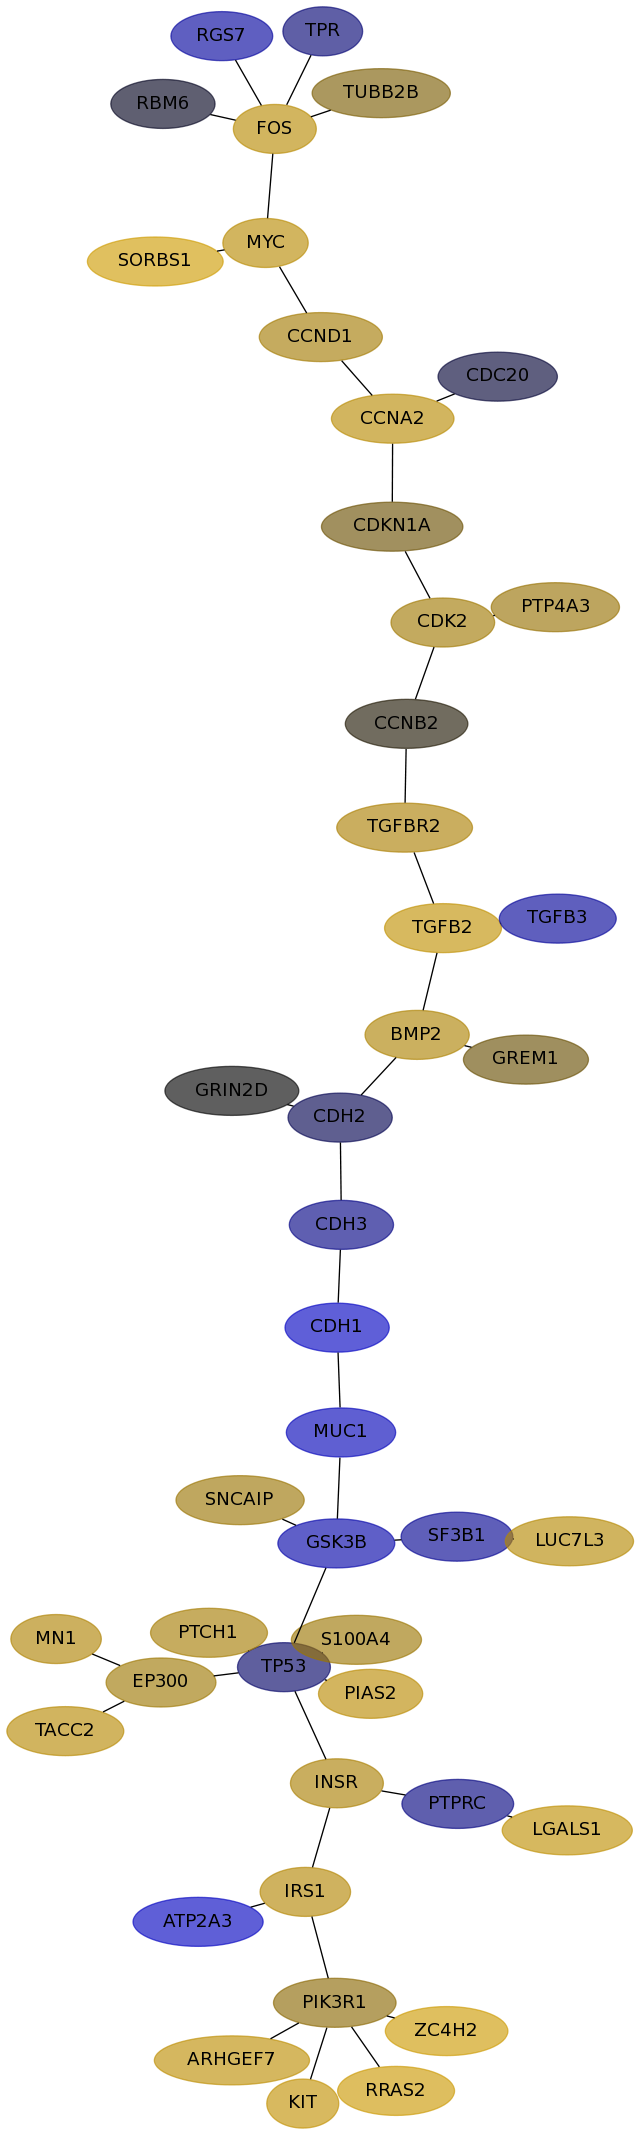
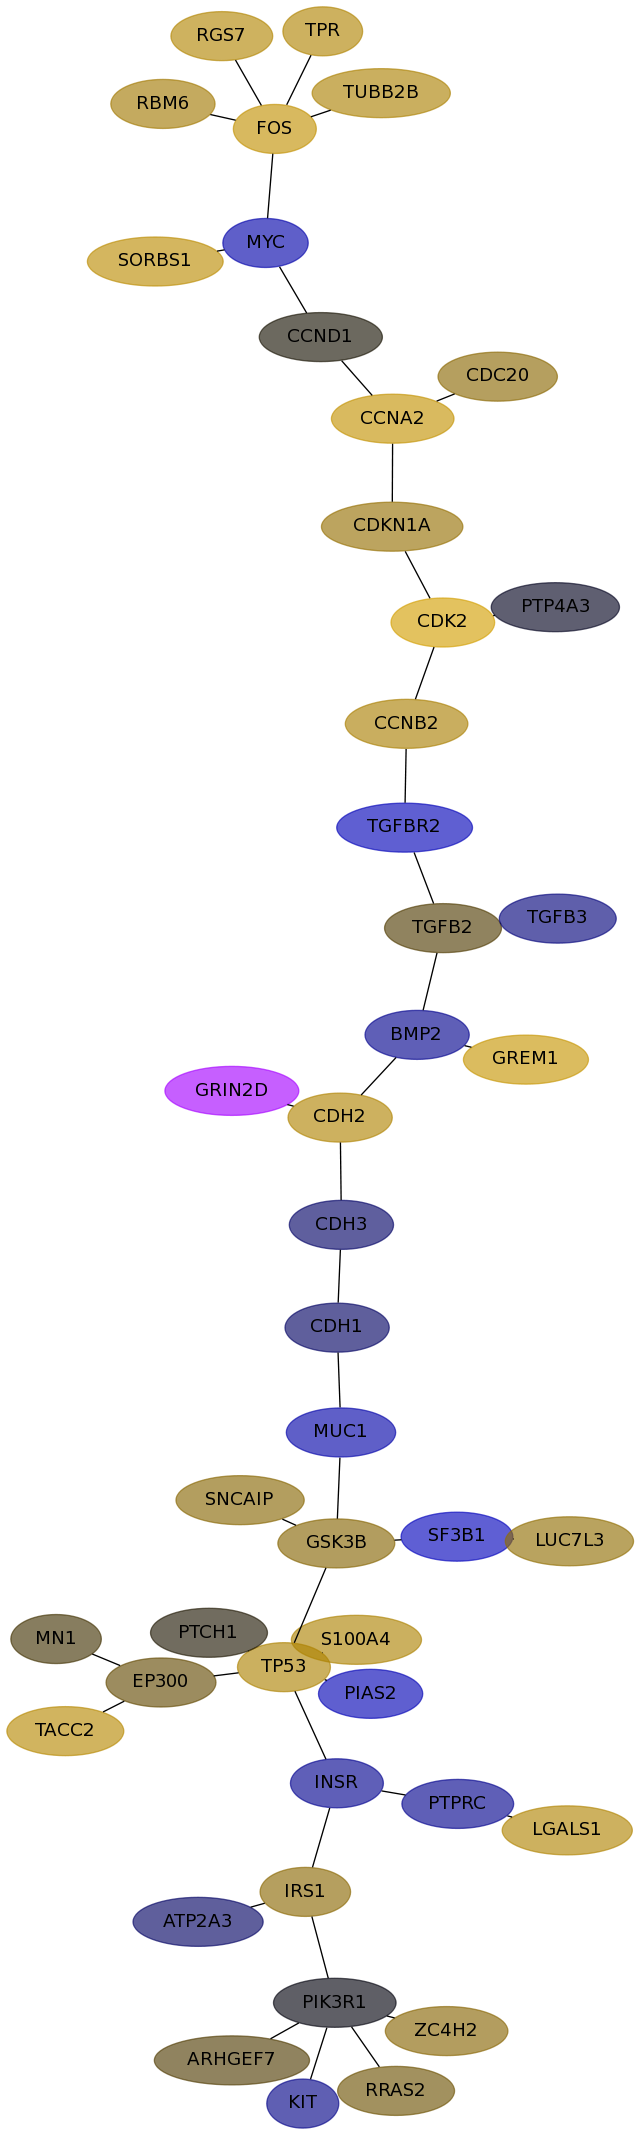
Expression data for subnetwork 1130 in each dataset
Desmedt |
IPC |
Loi |
Schmidt |
Wang |
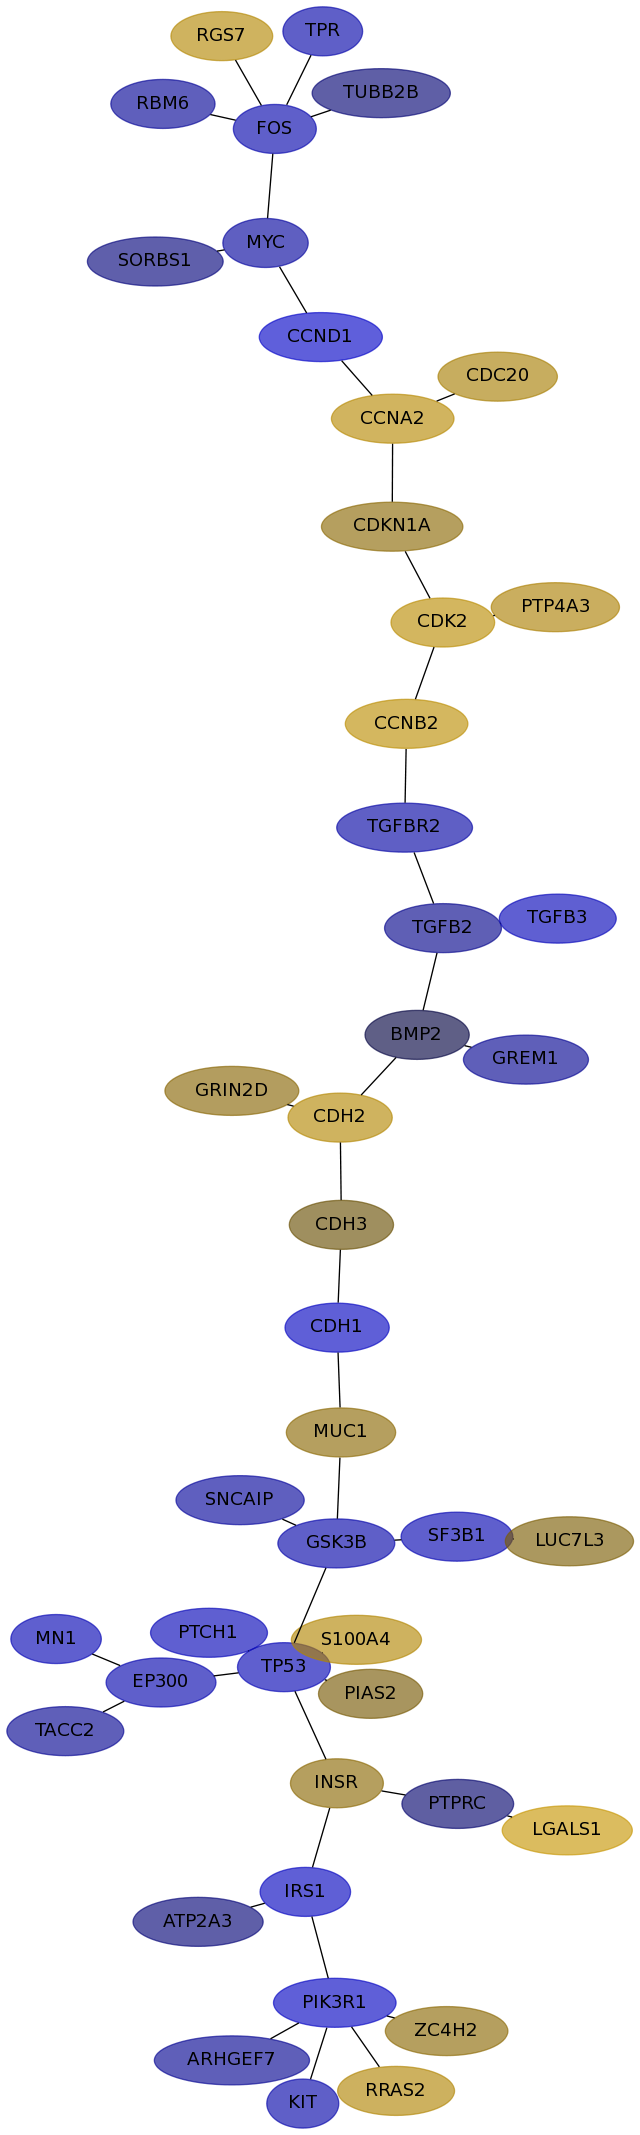
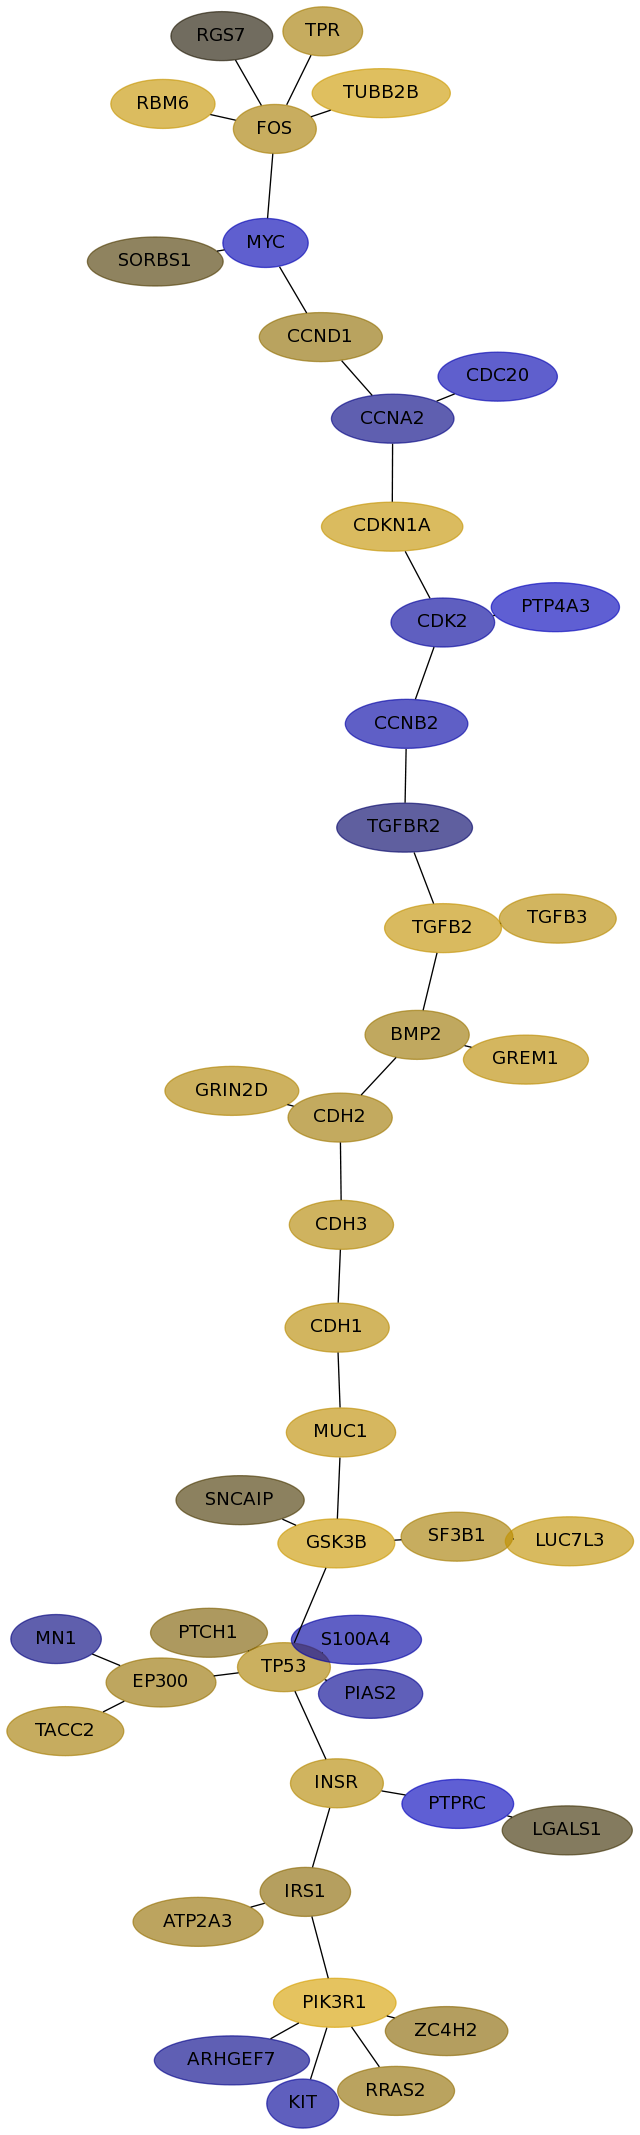
Subnetwork structure for each dataset
- Desmedt
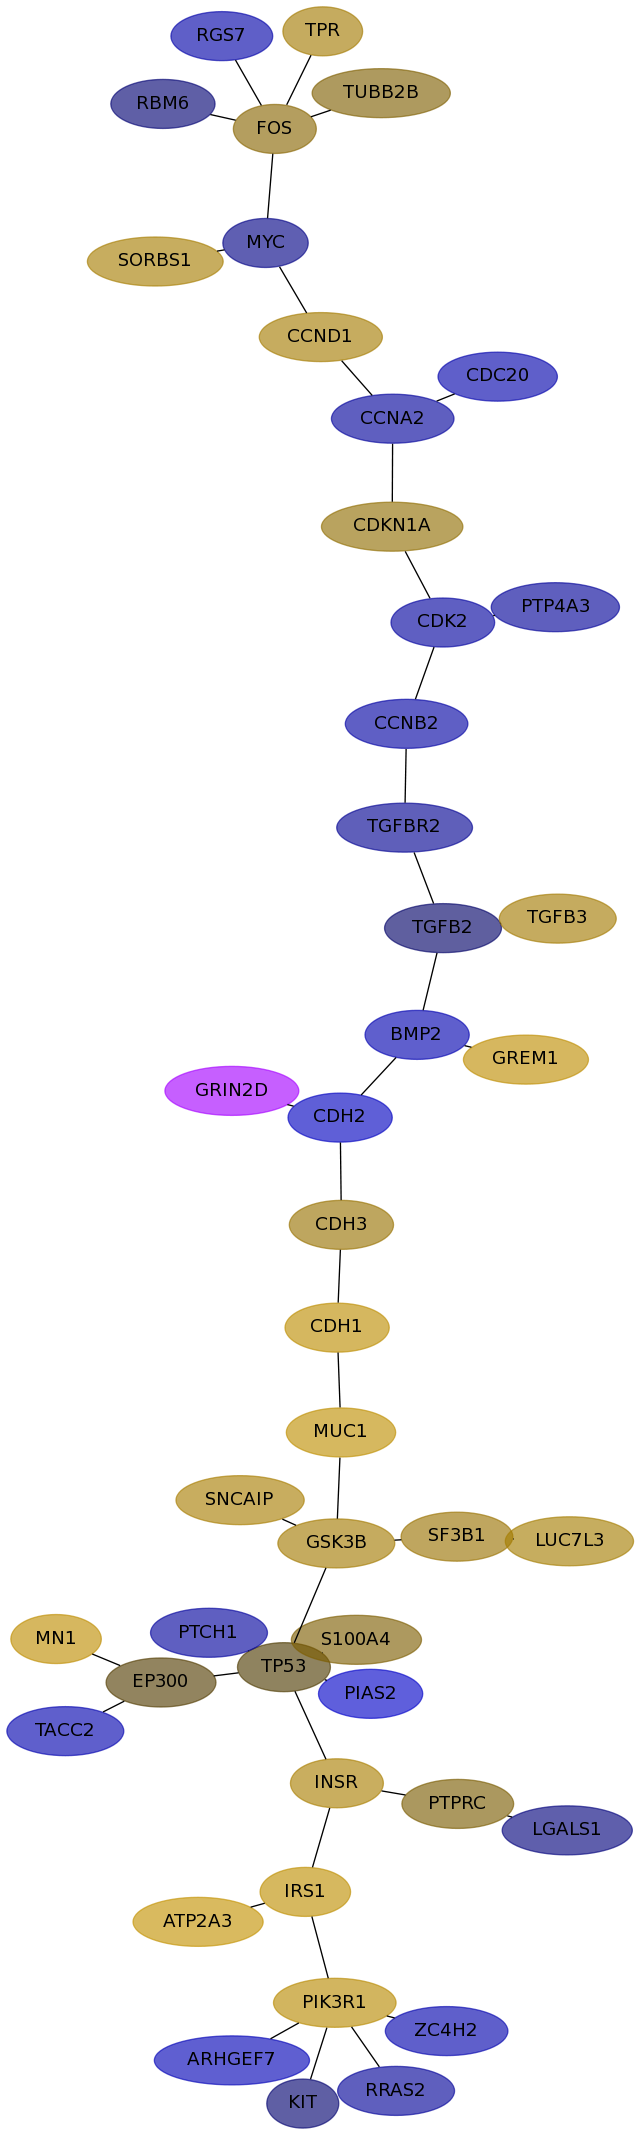
Score for each gene in subnetwork 1130 in each dataset
| Gene Symbol | Links | Frequency | Frequency Rank | Subnetwork score rank | Global rank |
Desmedt | IPC | Loi | Schmidt | Wang |
|---|
| EP300 |   | 71 | 3 | 1 | 2 | 0.016 | -0.149 | 0.087 | 0.102 | 0.025 |
|---|
| SORBS1 | | 17 | 30 | 182 | 178 | 0.124 | -0.043 | 0.015 | 0.314 | 0.200 |
|---|
| ARHGEF7 | | 12 | 55 | 492 | 475 | -0.180 | -0.074 | -0.061 | 0.208 | 0.015 |
|---|
| ATP2A3 | | 9 | 77 | 1 | 18 | 0.240 | -0.040 | 0.082 | -0.229 | -0.025 |
|---|
| SF3B1 | | 15 | 40 | 148 | 144 | 0.091 | -0.154 | 0.126 | -0.073 | -0.204 |
|---|
| TP53 | | 28 | 15 | 1 | 9 | 0.015 | -0.167 | 0.148 | -0.027 | 0.147 |
|---|
| PTP4A3 | | 3 | 265 | 364 | 362 | -0.090 | 0.137 | -0.196 | 0.085 | -0.004 |
|---|
| CDKN1A | | 56 | 4 | 1 | 3 | 0.075 | 0.064 | 0.254 | 0.030 | 0.082 |
|---|
| TGFB2 | | 7 | 100 | 57 | 60 | -0.028 | -0.063 | 0.244 | 0.226 | 0.015 |
|---|
| RGS7 | | 1 | 652 | 1003 | 1009 | -0.132 | 0.172 | 0.004 | -0.099 | 0.161 |
|---|
| TGFBR2 | | 1 | 652 | 1003 | 1009 | -0.078 | -0.115 | -0.028 | 0.136 | -0.190 |
|---|
| BMP2 | | 7 | 100 | 33 | 37 | -0.155 | -0.011 | 0.097 | 0.148 | -0.069 |
|---|
| CCND1 | | 12 | 55 | 148 | 150 | 0.122 | -0.258 | 0.074 | 0.117 | 0.003 |
|---|
| CCNA2 | | 15 | 40 | 148 | 144 | -0.097 | 0.176 | -0.053 | 0.188 | 0.246 |
|---|
| CDH1 | | 54 | 5 | 1 | 4 | 0.211 | -0.227 | 0.187 | -0.236 | -0.024 |
|---|
| TACC2 | | 9 | 77 | 148 | 154 | -0.151 | -0.073 | 0.122 | 0.181 | 0.180 |
|---|
| MYC | | 24 | 21 | 148 | 137 | -0.056 | -0.101 | -0.169 | 0.188 | -0.134 |
|---|
| RBM6 | | 10 | 67 | 148 | 152 | -0.036 | -0.082 | 0.265 | -0.004 | 0.111 |
|---|
| TGFB3 | | 2 | 391 | 1003 | 998 | 0.116 | -0.190 | 0.191 | -0.088 | -0.043 |
|---|
| CDH3 | | 10 | 67 | 1 | 16 | 0.088 | 0.028 | 0.169 | -0.055 | -0.027 |
|---|
| RRAS2 | | 6 | 120 | 563 | 549 | -0.089 | 0.155 | 0.076 | 0.289 | 0.031 |
|---|
| KIT | | 13 | 47 | 339 | 335 | -0.034 | -0.130 | -0.091 | 0.235 | -0.059 |
|---|
| MN1 | | 6 | 120 | 148 | 156 | 0.213 | -0.166 | -0.047 | 0.150 | 0.011 |
|---|
| GREM1 | | 5 | 148 | 57 | 63 | 0.213 | -0.073 | 0.200 | 0.028 | 0.261 |
|---|
| S100A4 | | 6 | 120 | 283 | 282 | 0.047 | 0.163 | -0.116 | 0.096 | 0.148 |
|---|
| ZC4H2 | | 16 | 34 | 339 | 332 | -0.145 | 0.065 | 0.061 | 0.304 | 0.059 |
|---|
| PIK3R1 | | 91 | 1 | 1 | 1 | 0.189 | -0.237 | 0.381 | 0.065 | -0.002 |
|---|
| CDC20 | | 1 | 652 | 1003 | 1009 | -0.138 | 0.125 | -0.156 | -0.008 | 0.063 |
|---|
| LGALS1 | | 3 | 265 | 696 | 686 | -0.045 | 0.267 | 0.010 | 0.218 | 0.156 |
|---|
| PTCH1 | | 4 | 198 | 339 | 341 | -0.102 | -0.184 | 0.047 | 0.121 | 0.004 |
|---|
| FOS | | 20 | 24 | 148 | 138 | 0.060 | -0.137 | 0.129 | 0.185 | 0.234 |
|---|
| PTPRC | | 5 | 148 | 715 | 697 | 0.043 | -0.031 | -0.204 | -0.050 | -0.068 |
|---|
| IRS1 | | 14 | 42 | 1 | 14 | 0.217 | -0.219 | 0.065 | 0.165 | 0.064 |
|---|
| TPR | | 10 | 67 | 148 | 152 | 0.118 | -0.130 | 0.120 | -0.036 | 0.156 |
|---|
| MUC1 | | 39 | 11 | 1 | 7 | 0.215 | 0.063 | 0.214 | -0.190 | -0.132 |
|---|
| INSR | | 47 | 7 | 1 | 5 | 0.135 | 0.063 | 0.173 | 0.135 | -0.072 |
|---|
| LUC7L3 | | 13 | 47 | 148 | 148 | 0.123 | 0.043 | 0.237 | 0.175 | 0.074 |
|---|
| PIAS2 | | 3 | 265 | 620 | 613 | -0.270 | 0.039 | -0.072 | 0.194 | -0.172 |
|---|
| TUBB2B | | 5 | 148 | 148 | 161 | 0.048 | -0.036 | 0.304 | 0.045 | 0.139 |
|---|
| GSK3B | | 47 | 7 | 33 | 28 | 0.117 | -0.130 | 0.292 | -0.129 | 0.057 |
|---|
| GRIN2D | | 18 | 26 | 33 | 32 | undef | 0.058 | 0.155 | 0.000 | undef |
|---|
| CDK2 | | 16 | 34 | 129 | 124 | -0.104 | 0.196 | -0.096 | 0.109 | 0.362 |
|---|
| CDH2 | | 7 | 100 | 33 | 37 | -0.228 | 0.169 | 0.109 | -0.016 | 0.155 |
|---|
| CCNB2 | | 1 | 652 | 1003 | 1009 | -0.118 | 0.206 | -0.119 | 0.004 | 0.134 |
|---|
| SNCAIP | | 4 | 198 | 283 | 289 | 0.127 | -0.091 | 0.013 | 0.092 | 0.059 |
|---|
GO Enrichment output for subnetwork 1130 in each dataset
| Name | Accession Number | Link | P-val | Corrected P-val |
|---|
| epithelial to mesenchymal transition | GO:0001837 |  | 3.427E-09 | 7.881E-06 |
|---|
| insulin receptor signaling pathway | GO:0008286 | | 7.019E-08 | 8.072E-05 |
|---|
| cellular response to insulin stimulus | GO:0032869 | | 4.434E-07 | 3.399E-04 |
|---|
| mesenchymal cell development | GO:0014031 | | 7.884E-07 | 4.533E-04 |
|---|
| response to insulin stimulus | GO:0032868 | | 1.485E-06 | 6.832E-04 |
|---|
| positive regulation of ossification | GO:0045778 | | 1.495E-06 | 5.733E-04 |
|---|
| ER overload response | GO:0006983 | | 1.827E-06 | 6.004E-04 |
|---|
| salivary gland morphogenesis | GO:0007435 | | 1.827E-06 | 5.254E-04 |
|---|
| positive regulation of bone remodeling | GO:0046852 | | 2.293E-06 | 5.86E-04 |
|---|
| response to endoplasmic reticulum stress | GO:0034976 | | 2.293E-06 | 5.274E-04 |
|---|
| regulation of DNA metabolic process | GO:0051052 | | 2.49E-06 | 5.207E-04 |
|---|
| Name | Accession Number | Link | P-val | Corrected P-val |
|---|
| epithelial to mesenchymal transition | GO:0001837 | | 1.391E-09 | 3.399E-06 |
|---|
| insulin receptor signaling pathway | GO:0008286 | | 3.617E-08 | 4.418E-05 |
|---|
| cellular response to insulin stimulus | GO:0032869 | | 2.181E-07 | 1.776E-04 |
|---|
| mesenchymal cell development | GO:0014031 | | 3.229E-07 | 1.972E-04 |
|---|
| response to insulin stimulus | GO:0032868 | | 6.499E-07 | 3.175E-04 |
|---|
| positive regulation of ossification | GO:0045778 | | 6.546E-07 | 2.665E-04 |
|---|
| salivary gland morphogenesis | GO:0007435 | | 8.225E-07 | 2.87E-04 |
|---|
| positive regulation of bone remodeling | GO:0046852 | | 9.83E-07 | 3.002E-04 |
|---|
| regulation of DNA metabolic process | GO:0051052 | | 1.217E-06 | 3.303E-04 |
|---|
| protein import into nucleus. translocation | GO:0000060 | | 1.686E-06 | 4.12E-04 |
|---|
| positive regulation of cell migration | GO:0030335 | | 1.883E-06 | 4.181E-04 |
|---|
| Name | Accession Number | Link | P-val | Corrected P-val |
|---|
| epithelial to mesenchymal transition | GO:0001837 | | 1.504E-09 | 3.618E-06 |
|---|
| insulin receptor signaling pathway | GO:0008286 | | 3.193E-08 | 3.841E-05 |
|---|
| cellular response to insulin stimulus | GO:0032869 | | 2.051E-07 | 1.645E-04 |
|---|
| mesenchymal cell development | GO:0014031 | | 3.07E-07 | 1.847E-04 |
|---|
| response to insulin stimulus | GO:0032868 | | 6.288E-07 | 3.026E-04 |
|---|
| positive regulation of ossification | GO:0045778 | | 6.983E-07 | 2.8E-04 |
|---|
| salivary gland morphogenesis | GO:0007435 | | 8.652E-07 | 2.974E-04 |
|---|
| positive regulation of bone remodeling | GO:0046852 | | 1.048E-06 | 3.153E-04 |
|---|
| regulation of DNA metabolic process | GO:0051052 | | 1.327E-06 | 3.548E-04 |
|---|
| protein import into nucleus. translocation | GO:0000060 | | 1.515E-06 | 3.644E-04 |
|---|
| response to endoplasmic reticulum stress | GO:0034976 | | 1.798E-06 | 3.933E-04 |
|---|
| Name | Accession Number | Link | P-val | Corrected P-val |
|---|
| epithelial to mesenchymal transition | GO:0001837 | | 3.427E-09 | 7.881E-06 |
|---|
| insulin receptor signaling pathway | GO:0008286 | | 7.019E-08 | 8.072E-05 |
|---|
| cellular response to insulin stimulus | GO:0032869 | | 4.434E-07 | 3.399E-04 |
|---|
| mesenchymal cell development | GO:0014031 | | 7.884E-07 | 4.533E-04 |
|---|
| response to insulin stimulus | GO:0032868 | | 1.485E-06 | 6.832E-04 |
|---|
| positive regulation of ossification | GO:0045778 | | 1.495E-06 | 5.733E-04 |
|---|
| ER overload response | GO:0006983 | | 1.827E-06 | 6.004E-04 |
|---|
| salivary gland morphogenesis | GO:0007435 | | 1.827E-06 | 5.254E-04 |
|---|
| positive regulation of bone remodeling | GO:0046852 | | 2.293E-06 | 5.86E-04 |
|---|
| response to endoplasmic reticulum stress | GO:0034976 | | 2.293E-06 | 5.274E-04 |
|---|
| regulation of DNA metabolic process | GO:0051052 | | 2.49E-06 | 5.207E-04 |
|---|
| Name | Accession Number | Link | P-val | Corrected P-val |
|---|
| epithelial to mesenchymal transition | GO:0001837 | | 3.427E-09 | 7.881E-06 |
|---|
| insulin receptor signaling pathway | GO:0008286 | | 7.019E-08 | 8.072E-05 |
|---|
| cellular response to insulin stimulus | GO:0032869 | | 4.434E-07 | 3.399E-04 |
|---|
| mesenchymal cell development | GO:0014031 | | 7.884E-07 | 4.533E-04 |
|---|
| response to insulin stimulus | GO:0032868 | | 1.485E-06 | 6.832E-04 |
|---|
| positive regulation of ossification | GO:0045778 | | 1.495E-06 | 5.733E-04 |
|---|
| ER overload response | GO:0006983 | | 1.827E-06 | 6.004E-04 |
|---|
| salivary gland morphogenesis | GO:0007435 | | 1.827E-06 | 5.254E-04 |
|---|
| positive regulation of bone remodeling | GO:0046852 | | 2.293E-06 | 5.86E-04 |
|---|
| response to endoplasmic reticulum stress | GO:0034976 | | 2.293E-06 | 5.274E-04 |
|---|
| regulation of DNA metabolic process | GO:0051052 | | 2.49E-06 | 5.207E-04 |
|---|

