Study Desmedt-ER-pos
Study informations
6 subnetworks in total page | file
175 genes associated page | file
Enriched GO terms page
General informations
General Index page
Study Index page
Subnetwork 75
score
| Dataset | Score | P-val 1 | P-val 2 | P-val 3 | Fisher Score |
|---|
| IPC | 0.6166 | 2.947e-02 | 9.010e-03 | 8.765e-01 | 2.328e-04 |
|---|
| Loi | 0.4862 | 5.000e-06 | 0.000e+00 | 3.539e-02 | 0.000e+00 |
|---|
| Schmidt | 0.4554 | 6.480e-04 | 3.000e-05 | 7.434e-01 | 1.445e-08 |
|---|
| VanDeVijver | 0.5989 | 1.000e-06 | 3.000e-06 | 3.510e-01 | 1.053e-12 |
|---|
| Wang | 0.2753 | 1.308e-03 | 2.933e-02 | 3.197e-01 | 1.227e-05 |
|---|
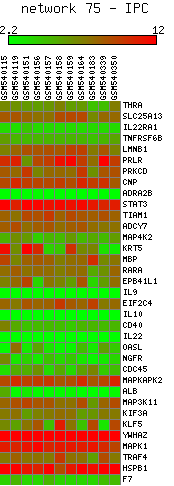
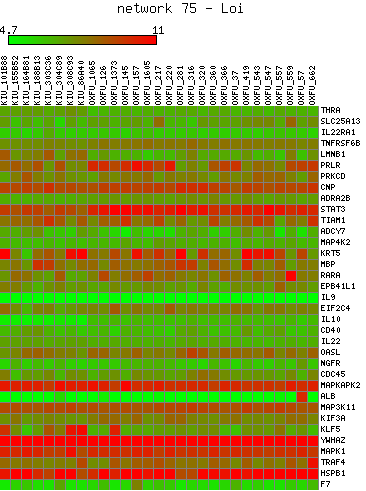
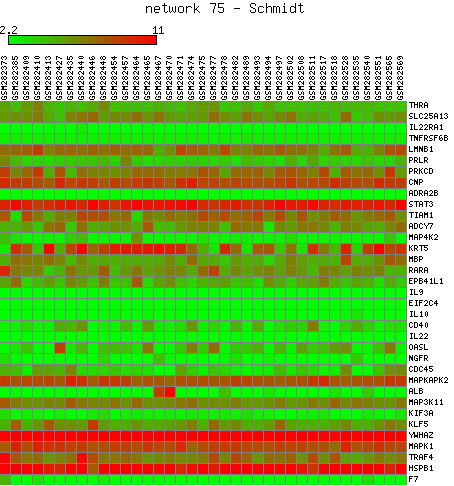
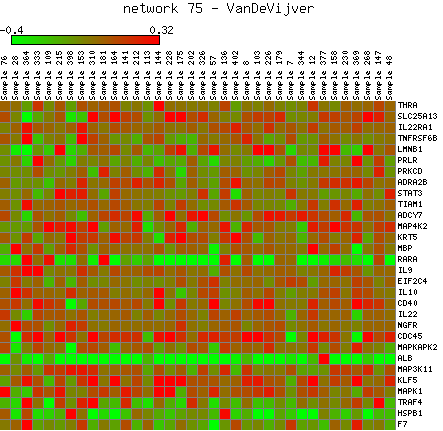
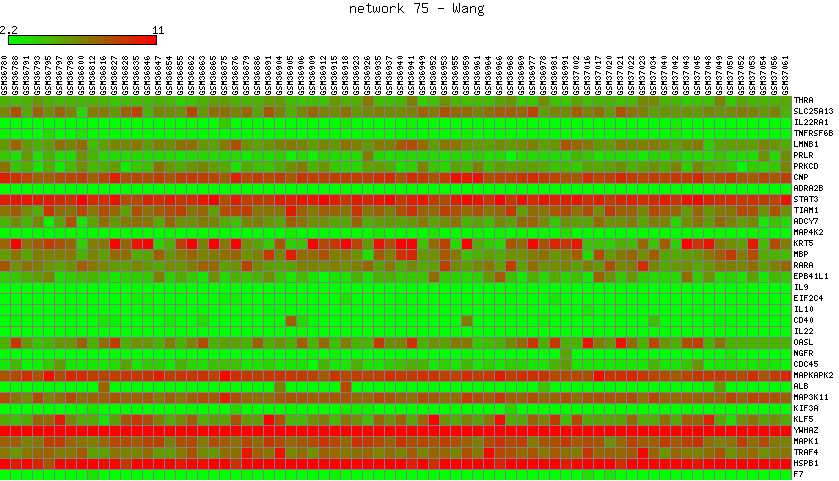
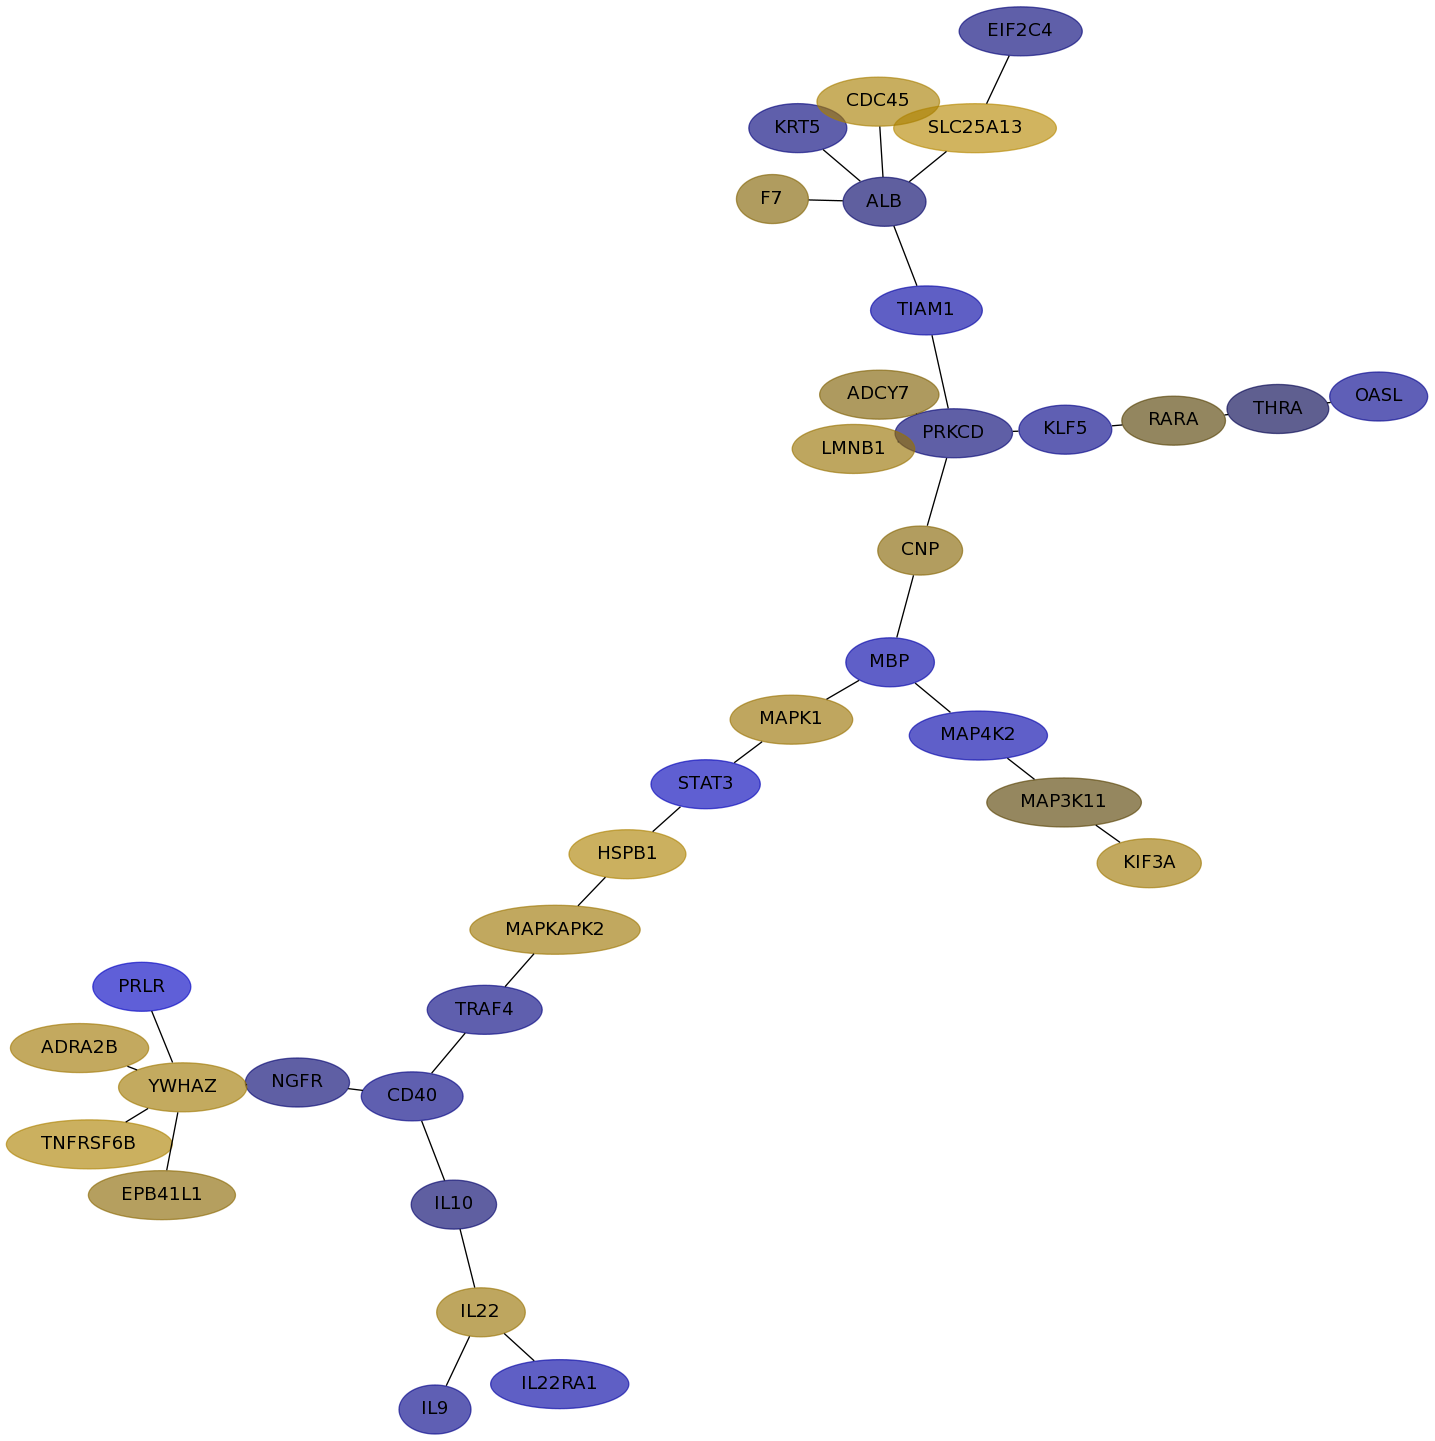
Expression data for subnetwork 75 in each dataset
IPC |
Loi |
Schmidt |
VanDeVijver |
Wang |
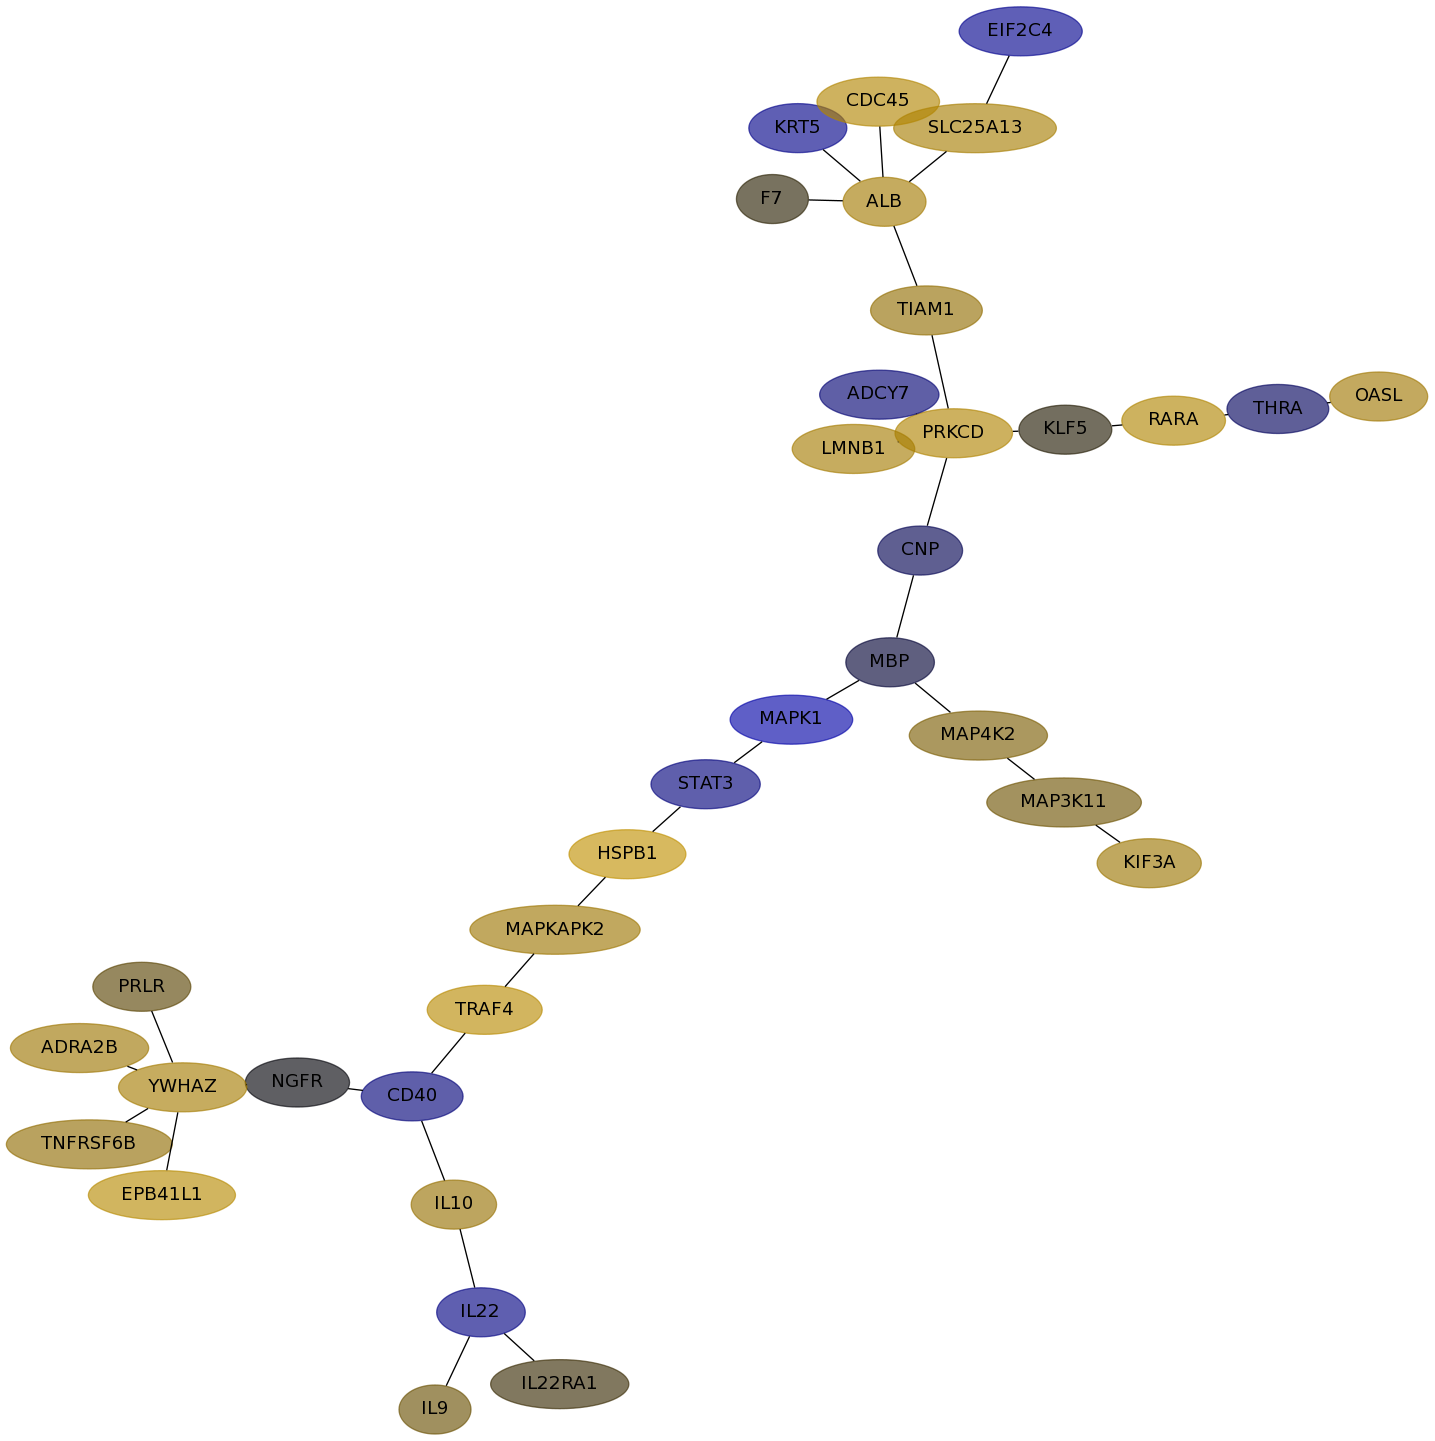
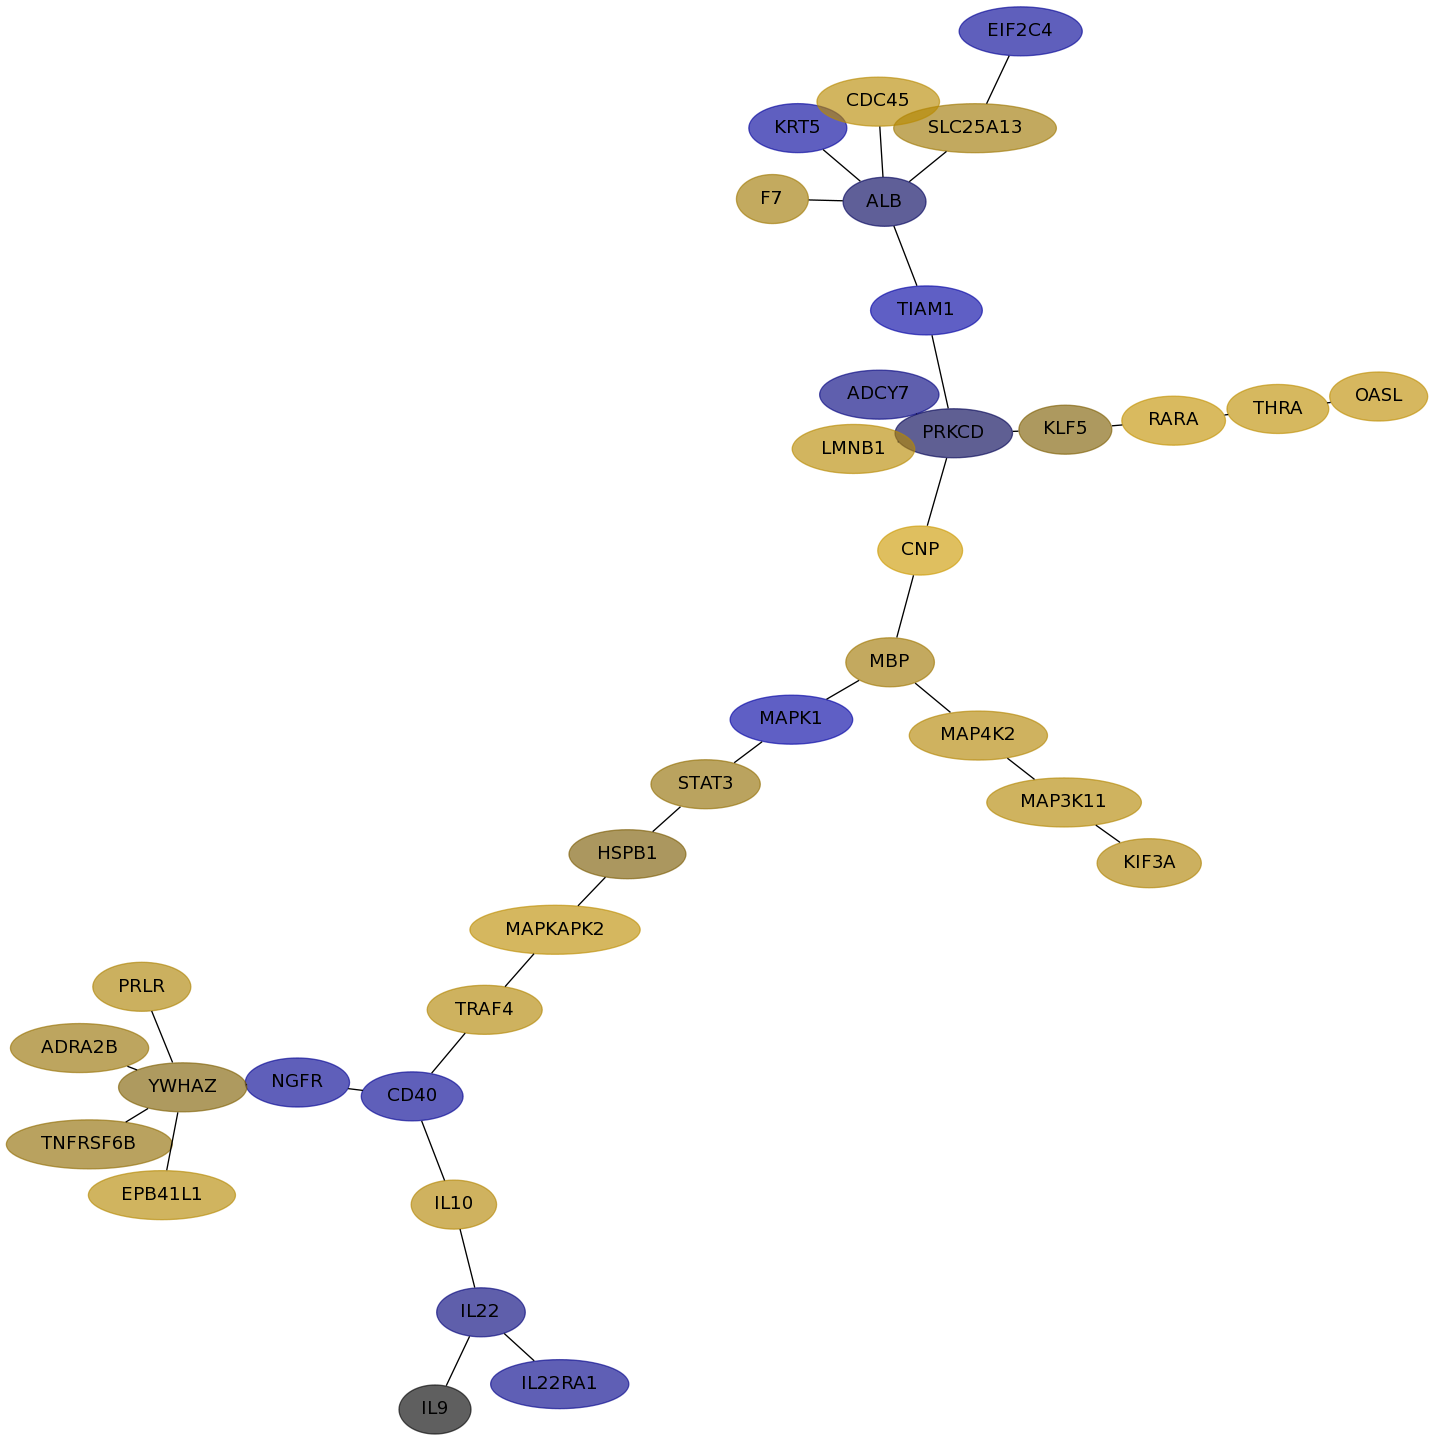
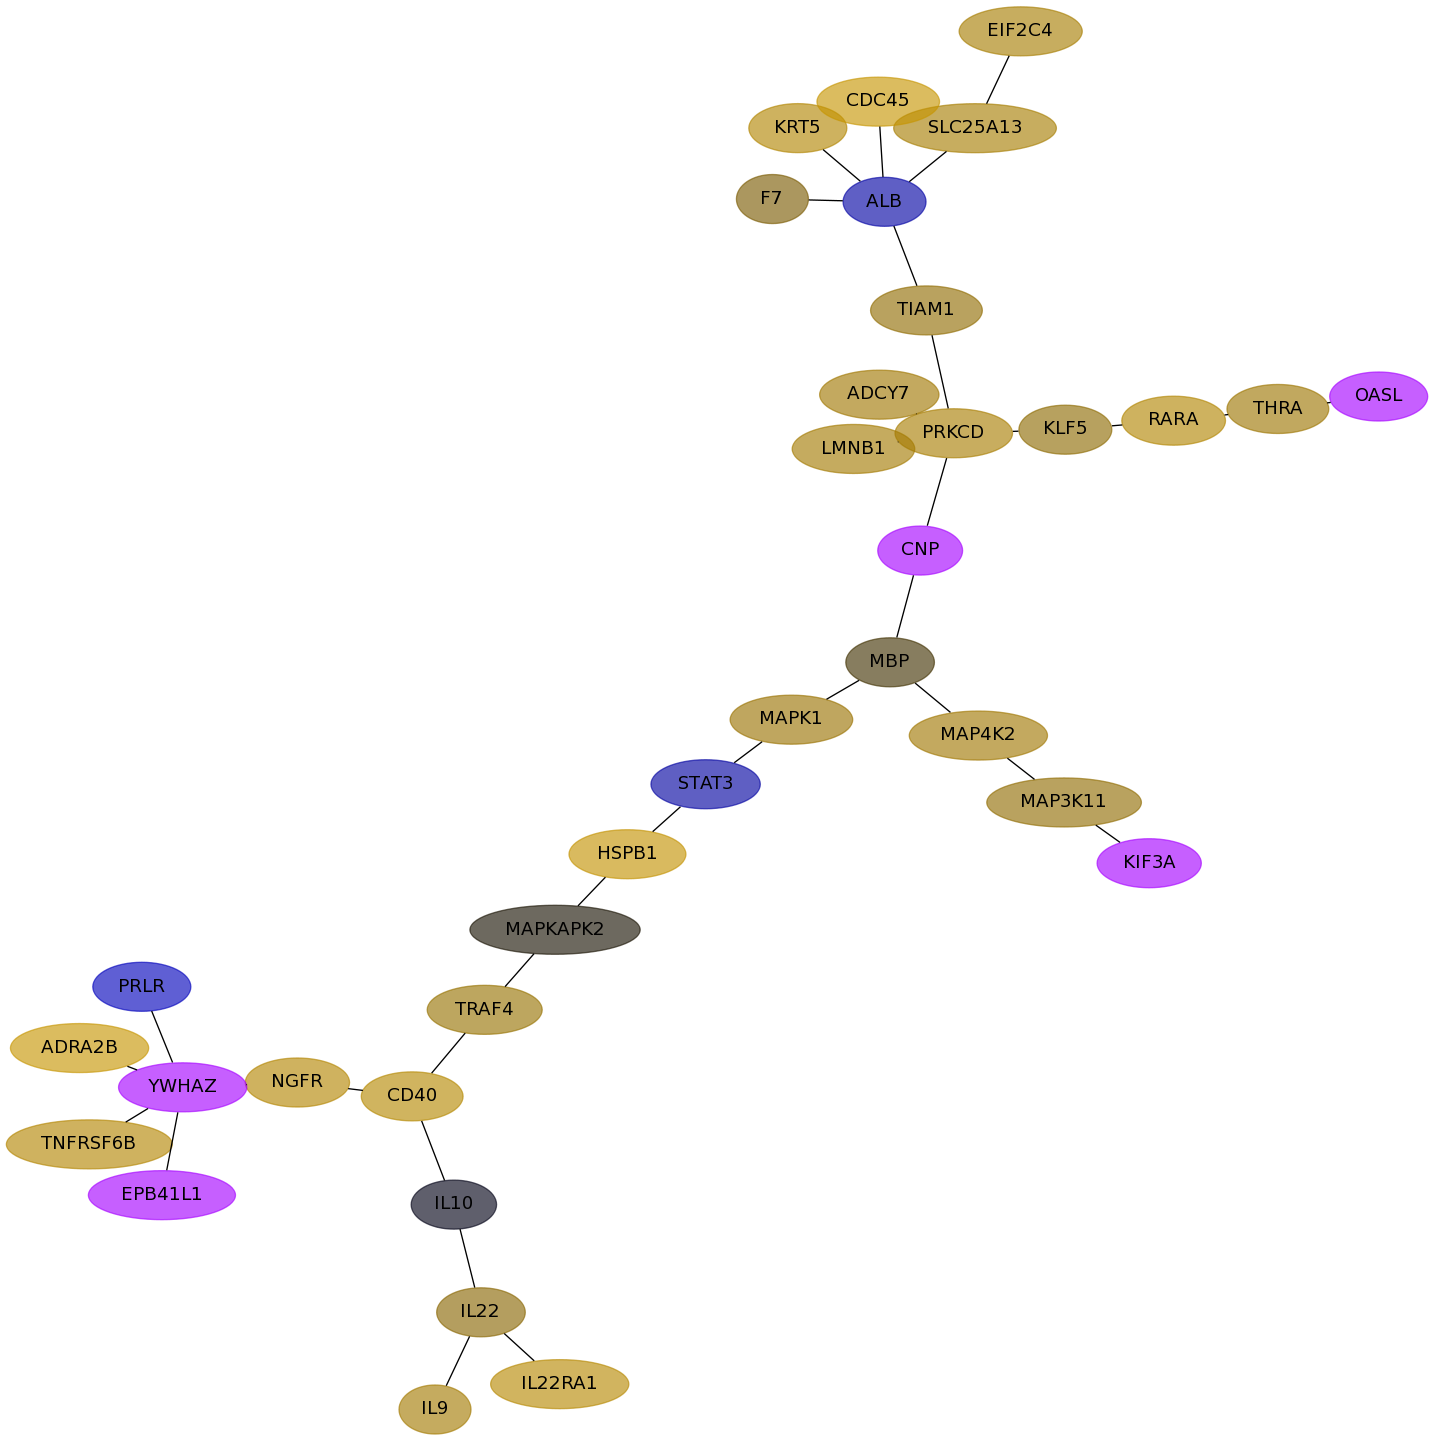
Subnetwork structure for each dataset
- IPC

Score for each gene in subnetwork 75 in each dataset
| Gene Symbol | Links | Frequency | Frequency Rank | Subnetwork score rank | Global rank |
IPC | Loi | Schmidt | VanDeVijver | Wang |
|---|
| THRA |   | 1 | 25 | 150 | 150 | -0.028 | -0.021 | 0.221 | 0.099 | -0.015 |
|---|
| SLC25A13 | | 1 | 25 | 150 | 150 | 0.088 | 0.126 | 0.104 | 0.125 | 0.178 |
|---|
| IL22RA1 | | 1 | 25 | 150 | 150 | 0.126 | 0.008 | -0.065 | 0.176 | -0.114 |
|---|
| TNFRSF6B | | 1 | 25 | 150 | 150 | -0.058 | 0.072 | 0.073 | 0.164 | 0.143 |
|---|
| LMNB1 | | 1 | 25 | 150 | 150 | 0.084 | 0.121 | 0.186 | 0.115 | 0.087 |
|---|
| PRLR | | 1 | 25 | 150 | 150 | 0.066 | 0.020 | 0.148 | -0.207 | -0.234 |
|---|
| PRKCD | | 1 | 25 | 150 | 150 | 0.039 | 0.155 | -0.018 | 0.127 | -0.037 |
|---|
| CNP | | 1 | 25 | 150 | 150 | -0.093 | -0.016 | 0.307 | undef | 0.056 |
|---|
| ADRA2B | | 1 | 25 | 150 | 150 | undef | 0.099 | 0.086 | 0.265 | 0.106 |
|---|
| STAT3 | | 1 | 25 | 150 | 150 | -0.078 | -0.046 | 0.077 | -0.106 | -0.189 |
|---|
| TIAM1 | | 1 | 25 | 150 | 150 | 0.004 | 0.076 | -0.117 | 0.073 | -0.117 |
|---|
| ADCY7 | | 1 | 25 | 150 | 150 | -0.004 | -0.037 | -0.049 | 0.108 | 0.049 |
|---|
| MAP4K2 | | 1 | 25 | 150 | 150 | -0.185 | 0.044 | 0.165 | 0.107 | -0.135 |
|---|
| KRT5 | | 2 | 9 | 89 | 89 | -0.123 | -0.061 | -0.098 | 0.163 | -0.043 |
|---|
| MBP | | 1 | 25 | 150 | 150 | -0.045 | -0.008 | 0.107 | 0.011 | -0.129 |
|---|
| RARA | | 1 | 25 | 150 | 150 | 0.164 | 0.160 | 0.244 | 0.163 | 0.017 |
|---|
| EPB41L1 | | 1 | 25 | 150 | 150 | -0.083 | 0.184 | 0.174 | undef | 0.064 |
|---|
| IL9 | | 1 | 25 | 150 | 150 | 0.134 | 0.029 | 0.000 | 0.114 | -0.062 |
|---|
| EIF2C4 | | 1 | 25 | 150 | 150 | -0.044 | -0.067 | -0.085 | 0.124 | -0.042 |
|---|
| IL10 | | 1 | 25 | 150 | 150 | -0.031 | 0.086 | 0.167 | -0.003 | -0.030 |
|---|
| CD40 | | 3 | 3 | 45 | 45 | -0.128 | -0.042 | -0.077 | 0.174 | -0.053 |
|---|
| IL22 | | 1 | 25 | 150 | 150 | -0.036 | -0.052 | -0.044 | 0.060 | 0.087 |
|---|
| OASL | | 1 | 25 | 150 | 150 | 0.009 | 0.107 | 0.213 | undef | -0.068 |
|---|
| NGFR | | 2 | 9 | 89 | 89 | -0.125 | -0.001 | -0.078 | 0.167 | -0.034 |
|---|
| CDC45 | | 3 | 3 | 61 | 61 | 0.124 | 0.160 | 0.192 | 0.261 | 0.131 |
|---|
| MAPKAPK2 | | 3 | 3 | 1 | 3 | -0.049 | 0.100 | 0.210 | 0.003 | 0.101 |
|---|
| ALB | | 3 | 3 | 61 | 61 | -0.085 | 0.115 | -0.022 | -0.113 | -0.027 |
|---|
| MAP3K11 | | 1 | 25 | 150 | 150 | -0.072 | 0.032 | 0.169 | 0.073 | 0.019 |
|---|
| KIF3A | | 1 | 25 | 150 | 150 | 0.131 | 0.097 | 0.151 | undef | 0.103 |
|---|
| KLF5 | | 1 | 25 | 150 | 150 | -0.050 | 0.004 | 0.048 | 0.067 | -0.058 |
|---|
| YWHAZ | | 2 | 9 | 89 | 89 | -0.011 | 0.121 | 0.048 | undef | 0.108 |
|---|
| MAPK1 | | 1 | 25 | 150 | 150 | -0.023 | -0.125 | -0.115 | 0.092 | 0.092 |
|---|
| TRAF4 | | 2 | 9 | 45 | 46 | -0.056 | 0.185 | 0.161 | 0.087 | -0.049 |
|---|
| HSPB1 | | 4 | 1 | 1 | 1 | 0.053 | 0.231 | 0.043 | 0.246 | 0.144 |
|---|
| F7 | | 1 | 25 | 150 | 150 | -0.018 | 0.006 | 0.109 | 0.043 | 0.053 |
|---|
GO Enrichment output for subnetwork 75 in each dataset
| Name | Accession Number | Link | P-val | Corrected P-val |
|---|
| B cell proliferation | GO:0042100 |  | 9.111E-09 | 2.226E-05 |
|---|
| polyol catabolic process | GO:0046174 | | 1.727E-07 | 2.11E-04 |
|---|
| regulation of interleukin-5 production | GO:0032674 | | 3.448E-07 | 2.808E-04 |
|---|
| lymphocyte proliferation | GO:0046651 | | 5.326E-07 | 3.253E-04 |
|---|
| leukocyte proliferation | GO:0070661 | | 7.359E-07 | 3.596E-04 |
|---|
| cellular carbohydrate catabolic process | GO:0044275 | | 4.866E-06 | 1.981E-03 |
|---|
| L-glutamate transport | GO:0015813 | | 4.866E-06 | 1.698E-03 |
|---|
| hair follicle morphogenesis | GO:0031069 | | 6.181E-06 | 1.888E-03 |
|---|
| fructose metabolic process | GO:0006000 | | 9.474E-06 | 2.572E-03 |
|---|
| epidermis morphogenesis | GO:0048730 | | 1.375E-05 | 3.36E-03 |
|---|
| negative regulation of cytokine production | GO:0001818 | | 2.956E-05 | 6.566E-03 |
|---|
| Name | Accession Number | Link | P-val | Corrected P-val |
|---|
| B cell proliferation | GO:0042100 | | 1.007E-08 | 2.423E-05 |
|---|
| polyol catabolic process | GO:0046174 | | 1.867E-07 | 2.246E-04 |
|---|
| regulation of interleukin-5 production | GO:0032674 | | 3.727E-07 | 2.989E-04 |
|---|
| lymphocyte proliferation | GO:0046651 | | 4.951E-07 | 2.978E-04 |
|---|
| leukocyte proliferation | GO:0070661 | | 6.938E-07 | 3.338E-04 |
|---|
| L-glutamate transport | GO:0015813 | | 4.052E-06 | 1.625E-03 |
|---|
| cellular carbohydrate catabolic process | GO:0044275 | | 5.257E-06 | 1.807E-03 |
|---|
| hair follicle morphogenesis | GO:0031069 | | 6.678E-06 | 2.008E-03 |
|---|
| fructose metabolic process | GO:0006000 | | 1.023E-05 | 2.736E-03 |
|---|
| epidermis morphogenesis | GO:0048730 | | 1.485E-05 | 3.574E-03 |
|---|
| negative regulation of cytokine production | GO:0001818 | | 3.193E-05 | 6.983E-03 |
|---|
| Name | Accession Number | Link | P-val | Corrected P-val |
|---|
| B cell proliferation | GO:0042100 | | 3.164E-08 | 7.276E-05 |
|---|
| polyol catabolic process | GO:0046174 | | 4.437E-07 | 5.103E-04 |
|---|
| regulation of interleukin-5 production | GO:0032674 | | 8.852E-07 | 6.786E-04 |
|---|
| lymphocyte proliferation | GO:0046651 | | 1.288E-06 | 7.405E-04 |
|---|
| leukocyte proliferation | GO:0070661 | | 1.83E-06 | 8.418E-04 |
|---|
| cellular carbohydrate catabolic process | GO:0044275 | | 7.209E-06 | 2.764E-03 |
|---|
| fructose metabolic process | GO:0006000 | | 2.416E-05 | 7.937E-03 |
|---|
| alditol metabolic process | GO:0019400 | | 4.867E-05 | 0.01399243 |
|---|
| negative regulation of cytokine production | GO:0001818 | | 5.664E-05 | 0.01447339 |
|---|
| telomere organization | GO:0032200 | | 7.503E-05 | 0.01725623 |
|---|
| response to molecule of bacterial origin | GO:0002237 | | 7.503E-05 | 0.01568748 |
|---|
VanDeVijver file
| Name | Accession Number | Link | P-val | Corrected P-val |
|---|
| response to estradiol stimulus | GO:0032355 | | 1.867E-06 | 3.441E-03 |
|---|
| MAPKKK cascade | GO:0000165 | | 1.316E-05 | 0.012126 |
|---|
| ectoderm development | GO:0007398 | | 3.5E-05 | 0.02150365 |
|---|
| response to estrogen stimulus | GO:0043627 | | 9.061E-05 | 0.0417478 |
|---|
| JAK-STAT cascade | GO:0007259 | | 1.171E-04 | 0.04314786 |
|---|
| interaction with symbiont | GO:0051702 | | 1.473E-04 | 0.0452311 |
|---|
| positive regulation of axonogenesis | GO:0050772 | | 1.473E-04 | 0.03876951 |
|---|
| negative regulation of tumor necrosis factor production | GO:0032720 | | 1.473E-04 | 0.03392332 |
|---|
| regulation of DNA replication initiation | GO:0030174 | | 1.473E-04 | 0.03015406 |
|---|
| positive regulation of T-helper cell differentiation | GO:0045624 | | 1.473E-04 | 0.02713866 |
|---|
| pyrimidine base metabolic process | GO:0006206 | | 1.473E-04 | 0.02467151 |
|---|
| Name | Accession Number | Link | P-val | Corrected P-val |
|---|
| B cell proliferation | GO:0042100 | | 3.164E-08 | 7.276E-05 |
|---|
| polyol catabolic process | GO:0046174 | | 4.437E-07 | 5.103E-04 |
|---|
| regulation of interleukin-5 production | GO:0032674 | | 8.852E-07 | 6.786E-04 |
|---|
| lymphocyte proliferation | GO:0046651 | | 1.288E-06 | 7.405E-04 |
|---|
| leukocyte proliferation | GO:0070661 | | 1.83E-06 | 8.418E-04 |
|---|
| cellular carbohydrate catabolic process | GO:0044275 | | 7.209E-06 | 2.764E-03 |
|---|
| fructose metabolic process | GO:0006000 | | 2.416E-05 | 7.937E-03 |
|---|
| alditol metabolic process | GO:0019400 | | 4.867E-05 | 0.01399243 |
|---|
| negative regulation of cytokine production | GO:0001818 | | 5.664E-05 | 0.01447339 |
|---|
| telomere organization | GO:0032200 | | 7.503E-05 | 0.01725623 |
|---|
| response to molecule of bacterial origin | GO:0002237 | | 7.503E-05 | 0.01568748 |
|---|

