Study VanDeVijver-ER-pos
Study informations
14 subnetworks in total page | file
272 genes associated page | file
Enriched GO terms page
General informations
General Index page
Study Index page
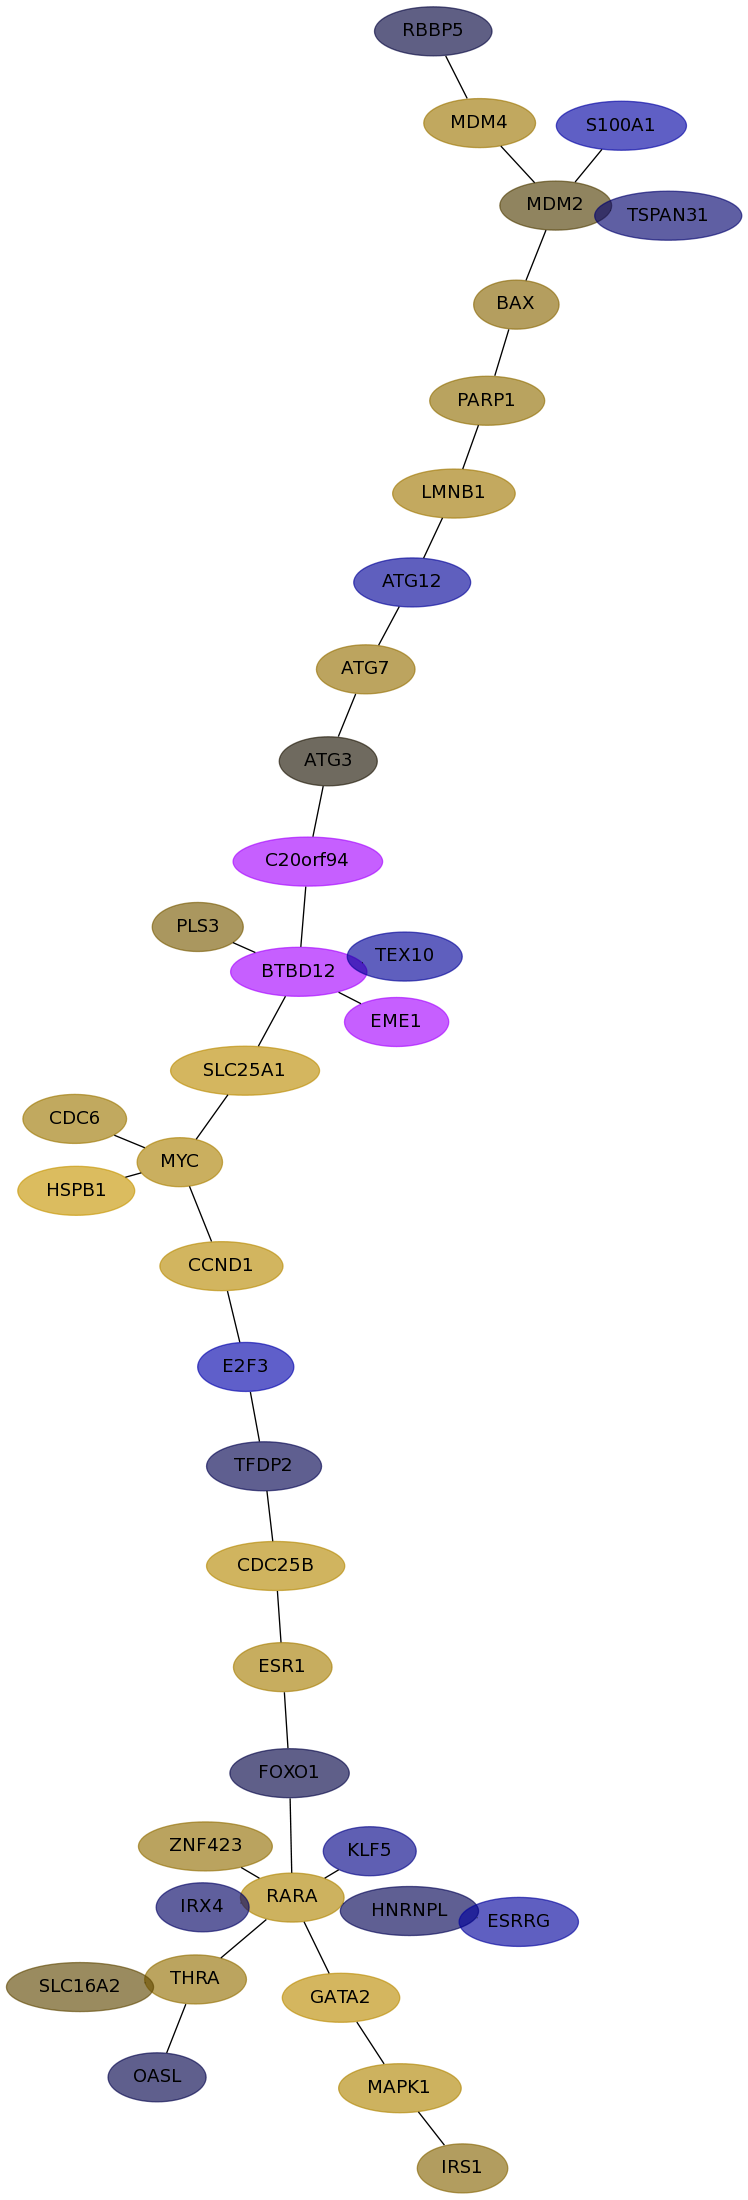
Subnetwork 52
score
| Dataset | Score | P-val 1 | P-val 2 | P-val 3 | Fisher Score |
|---|
| Desmedt | 0.5135 | 0.000e+00 | 0.000e+00 | 6.530e-04 | 0.000e+00 |
|---|
| IPC | 0.3797 | 2.221e-01 | 2.156e-01 | 9.663e-01 | 4.627e-02 |
|---|
| Loi | 0.5330 | 0.000e+00 | 0.000e+00 | 1.453e-03 | 0.000e+00 |
|---|
| Schmidt | 0.3160 | 6.246e-03 | 1.293e-03 | 1.767e-01 | 1.427e-06 |
|---|
| Wang | 0.2941 | 1.618e-03 | 1.020e-04 | 2.116e-01 | 3.492e-08 |
|---|
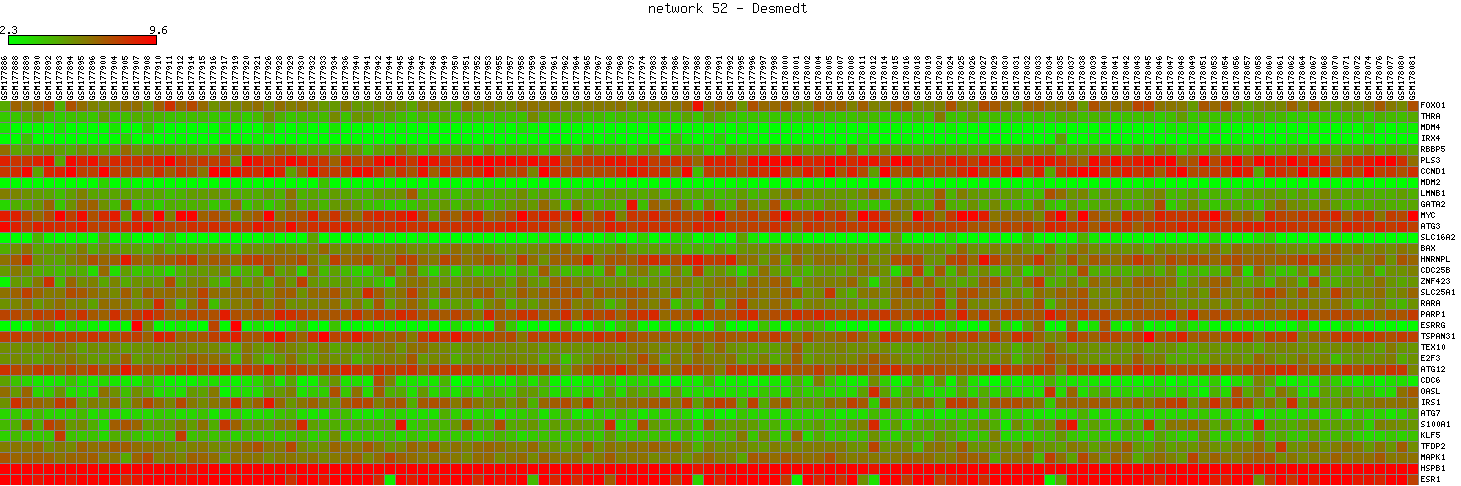
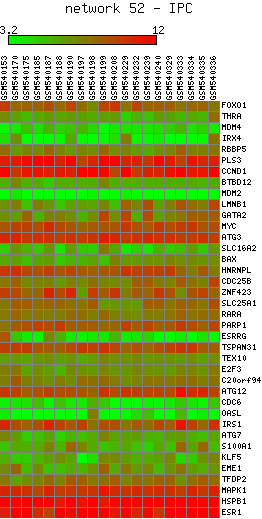
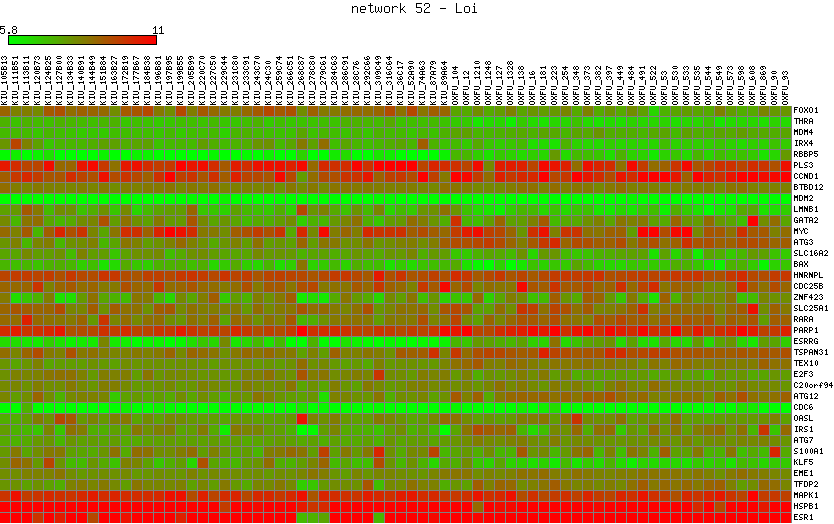
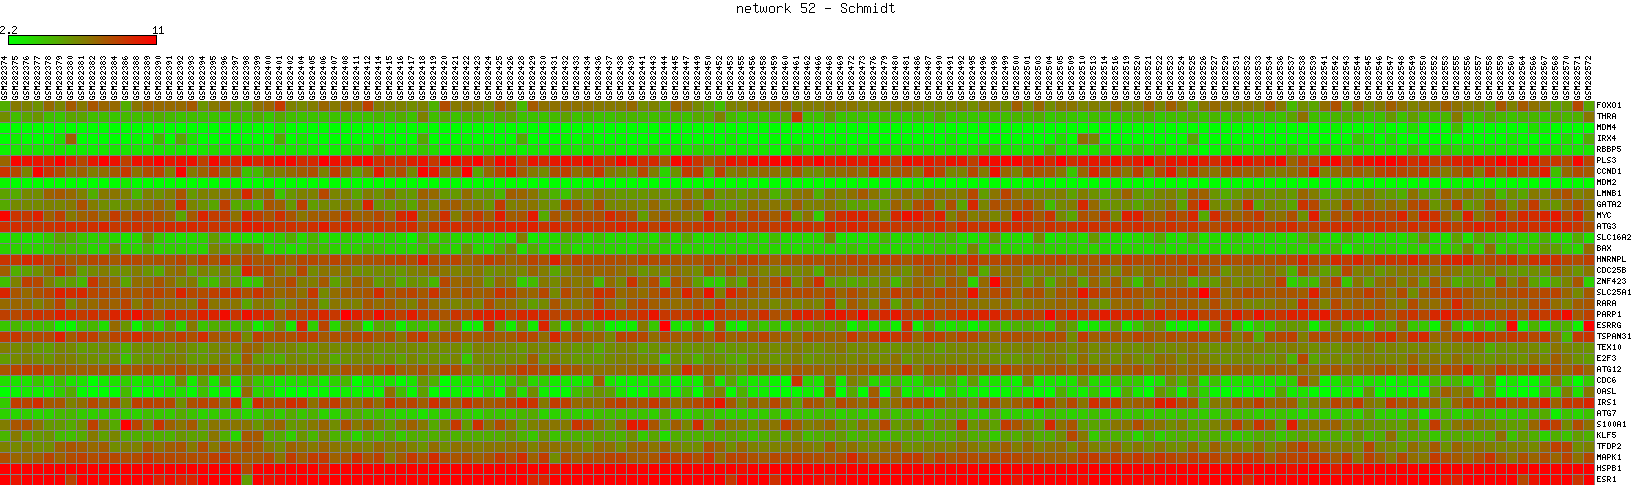
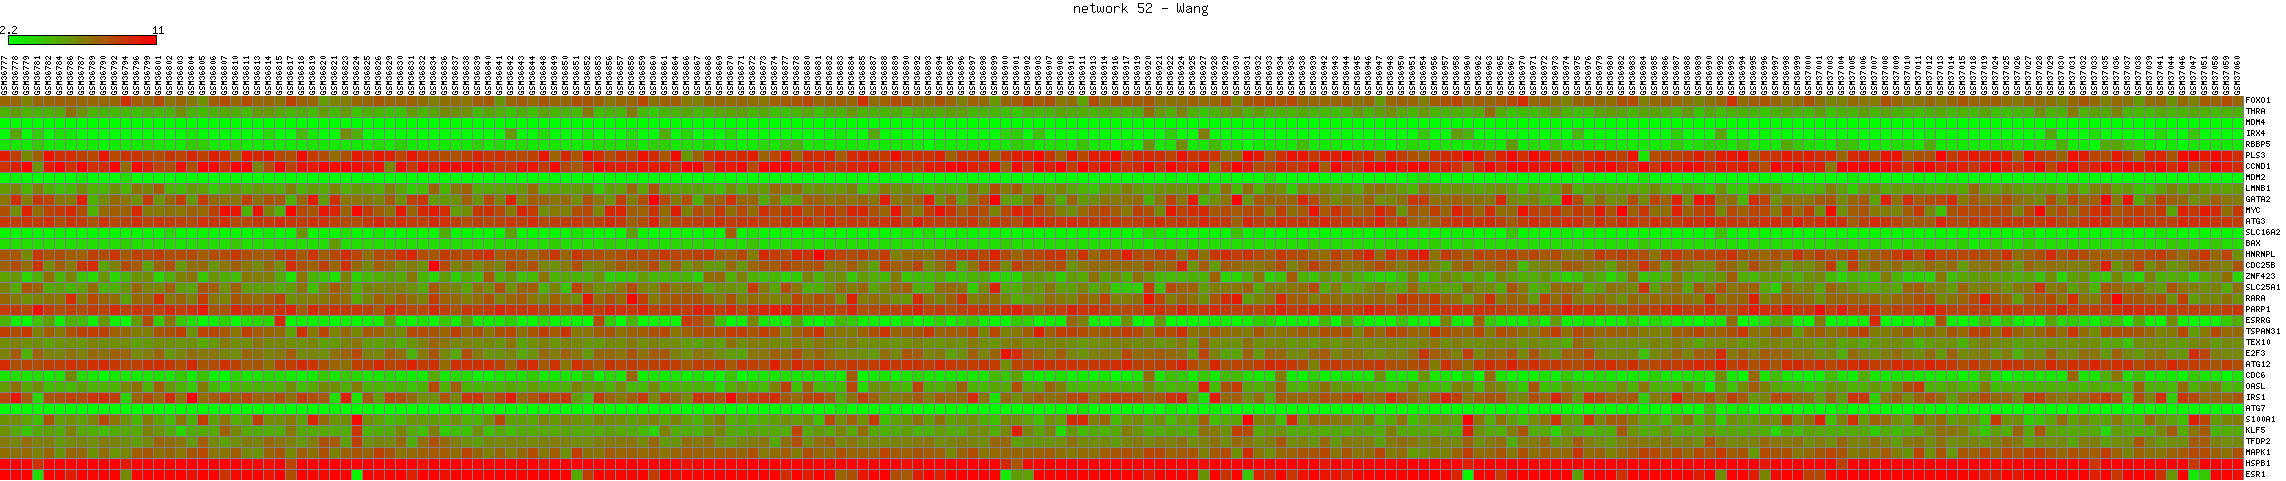
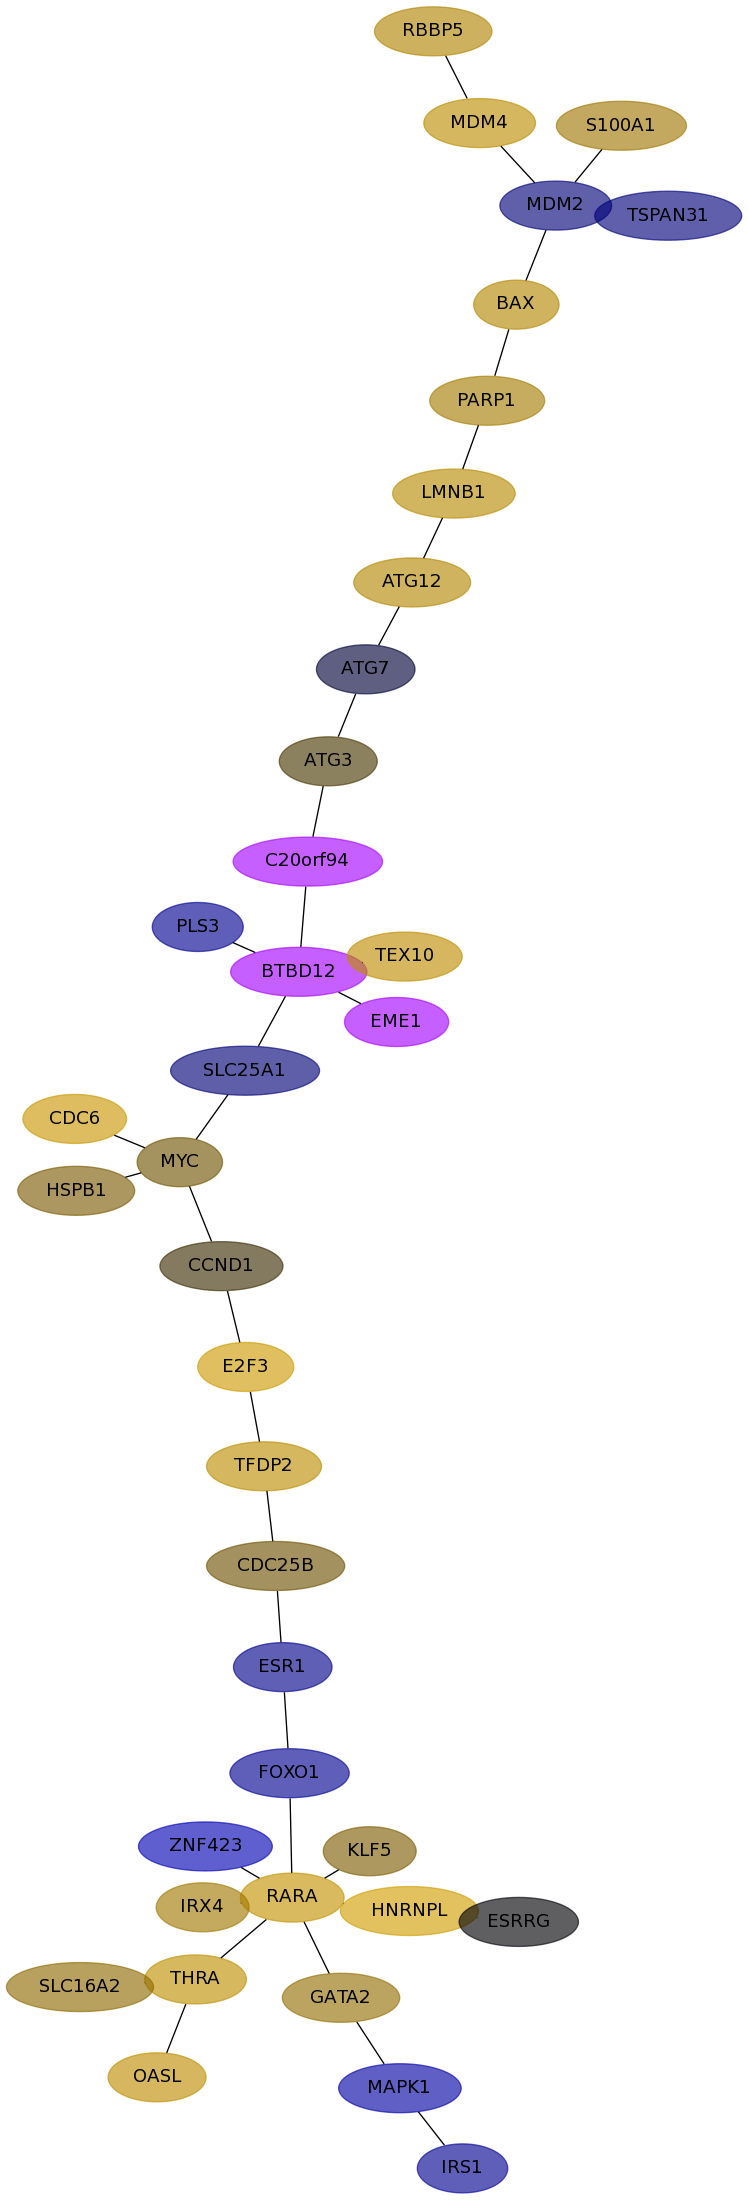
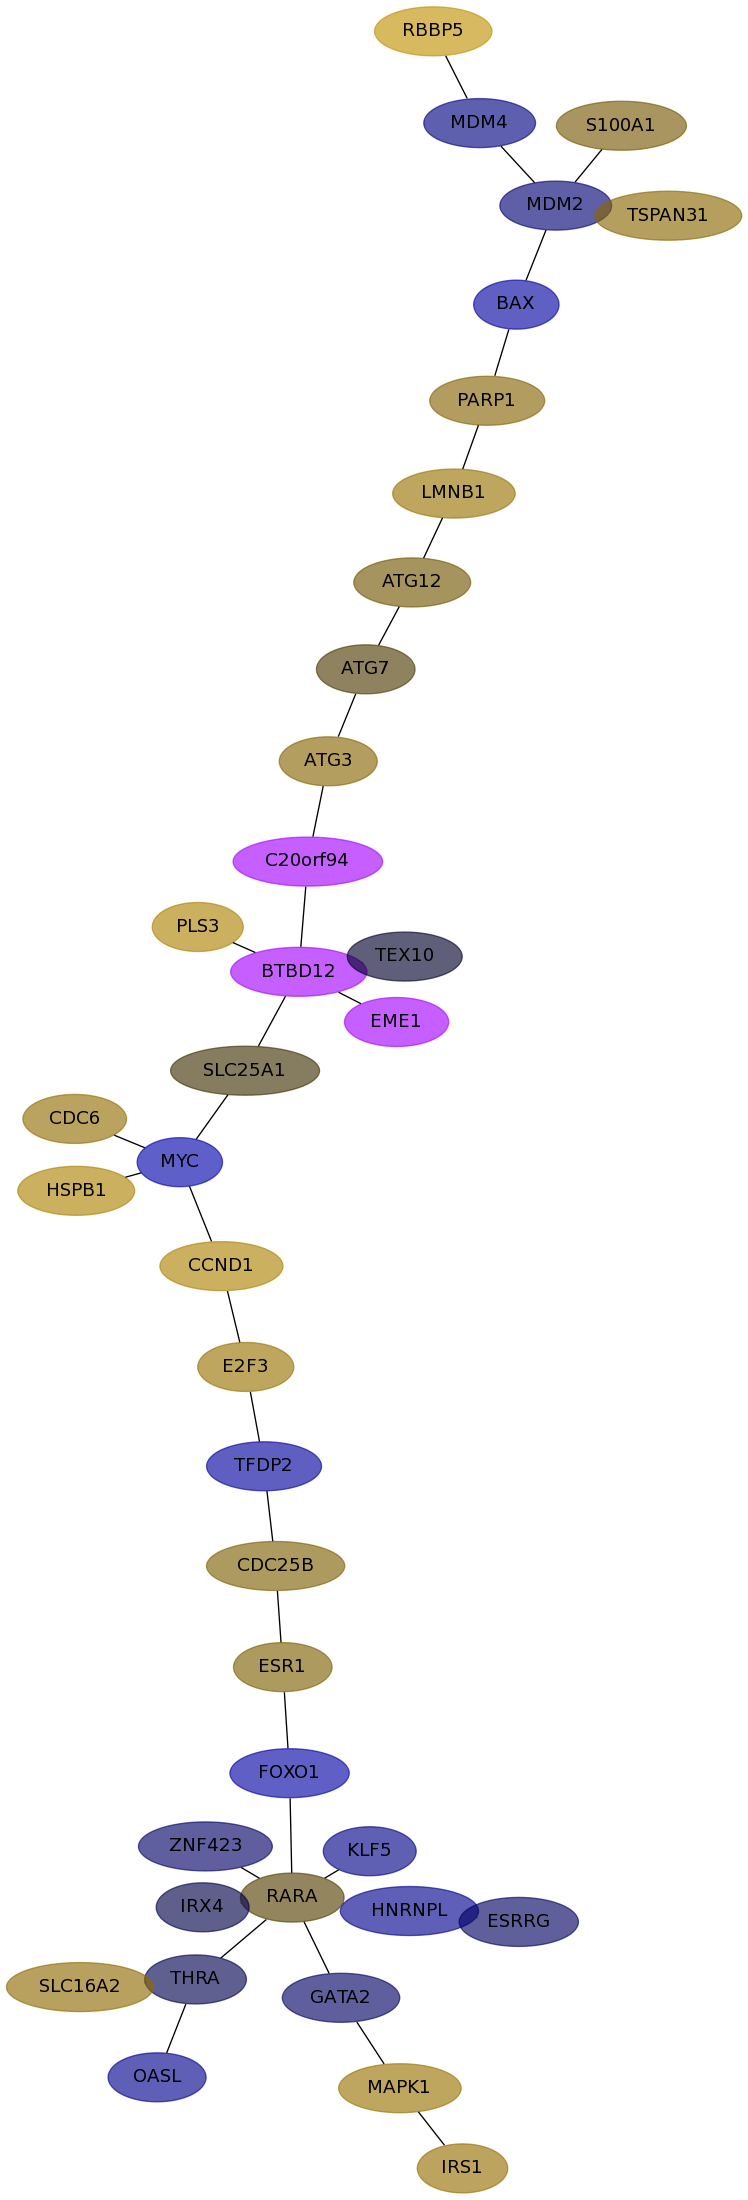
Expression data for subnetwork 52 in each dataset
Desmedt |
IPC |
Loi |
Schmidt |
Wang |
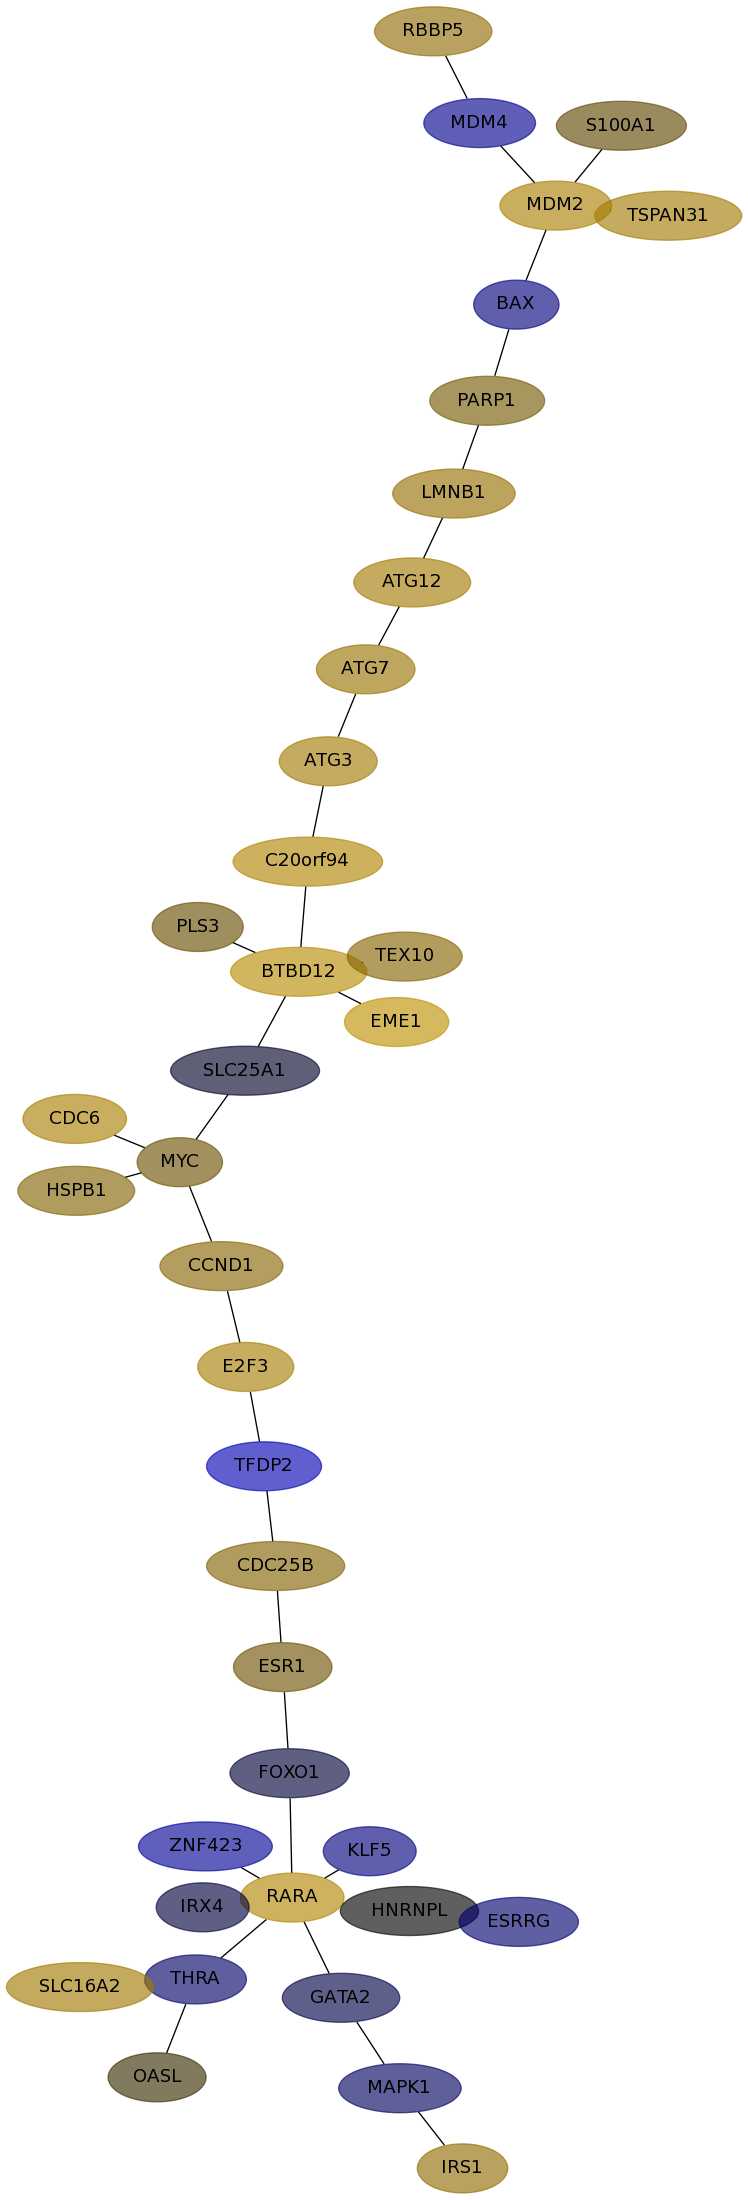
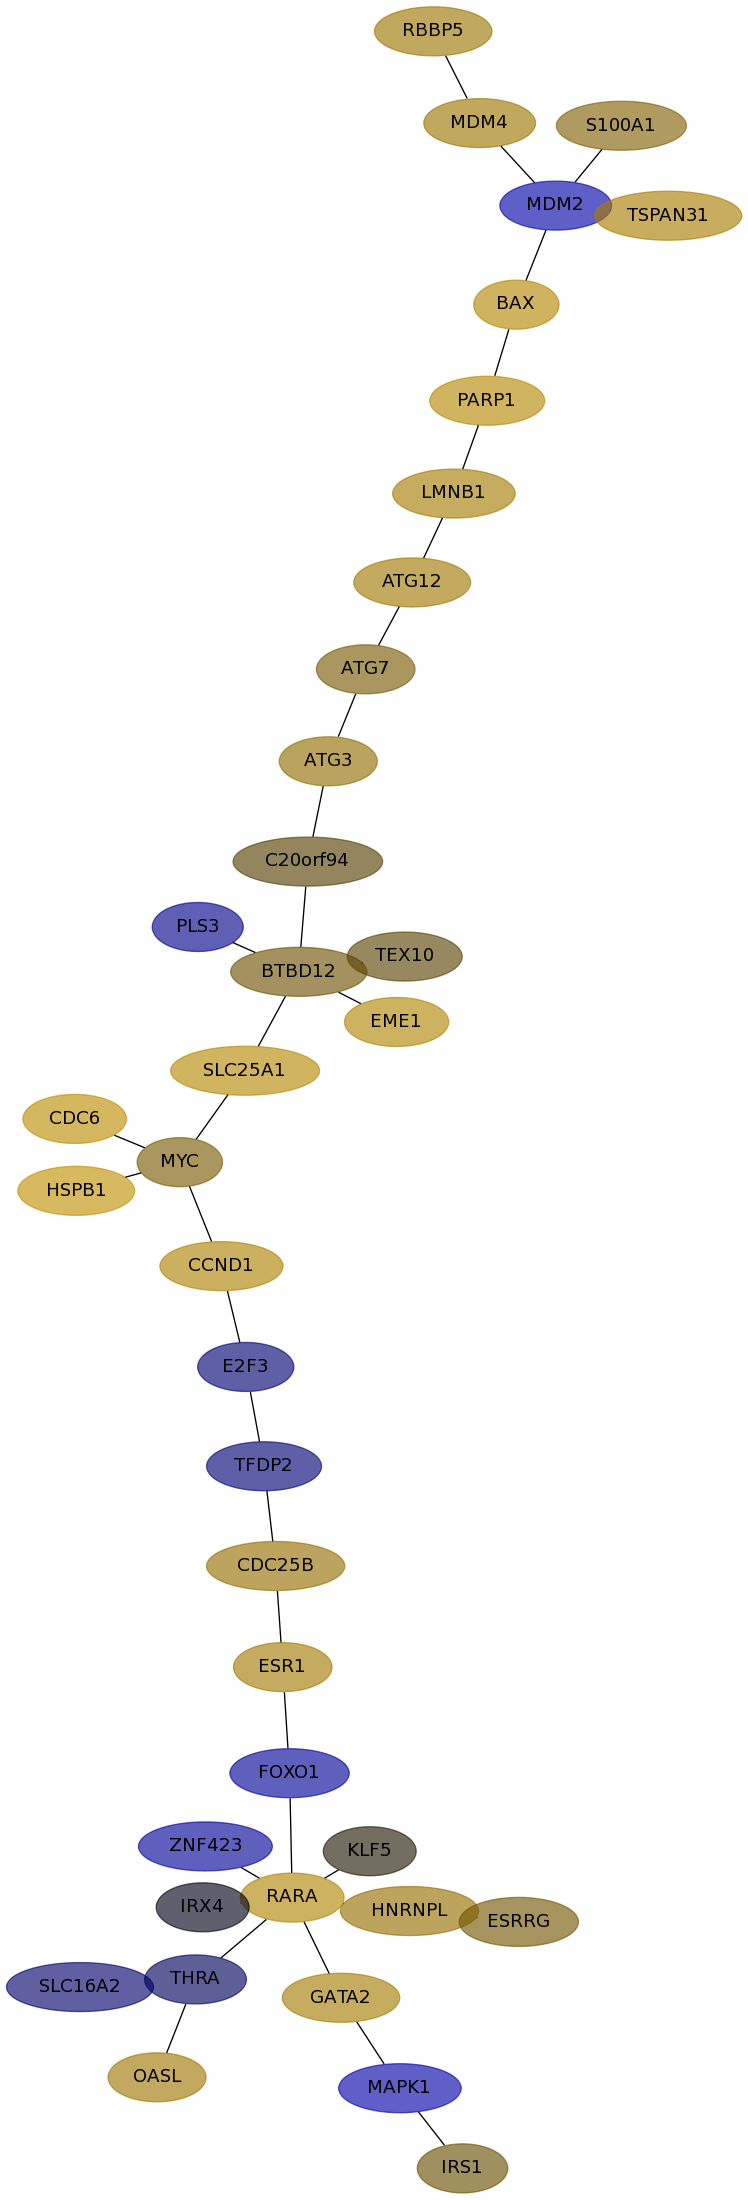
Subnetwork structure for each dataset
- Desmedt
Score for each gene in subnetwork 52 in each dataset
| Gene Symbol | Links | Frequency | Frequency Rank | Subnetwork score rank | Global rank |
Desmedt | IPC | Loi | Schmidt | Wang |
|---|
| FOXO1 |   | 1 | 59 | 237 | 237 | -0.012 | -0.009 | -0.089 | -0.078 | -0.118 |
|---|
| THRA | | 2 | 27 | 132 | 132 | 0.079 | -0.028 | -0.021 | 0.221 | -0.015 |
|---|
| MDM4 | | 1 | 59 | 237 | 237 | 0.100 | -0.069 | 0.101 | 0.207 | -0.054 |
|---|
| IRX4 | | 1 | 59 | 237 | 237 | -0.026 | -0.010 | -0.003 | 0.109 | -0.014 |
|---|
| RBBP5 | | 1 | 59 | 237 | 237 | -0.009 | 0.072 | 0.100 | 0.154 | 0.227 |
|---|
| PLS3 | | 1 | 59 | 237 | 237 | 0.042 | 0.028 | -0.064 | -0.073 | 0.144 |
|---|
| CCND1 | | 4 | 6 | 36 | 36 | 0.189 | 0.059 | 0.145 | 0.009 | 0.146 |
|---|
| BTBD12 | | 1 | 59 | 237 | 237 | undef | 0.184 | 0.033 | undef | undef |
|---|
| MDM2 | | 1 | 59 | 237 | 237 | 0.016 | 0.134 | -0.131 | -0.042 | -0.037 |
|---|
| LMNB1 | | 2 | 27 | 36 | 41 | 0.105 | 0.084 | 0.121 | 0.186 | 0.087 |
|---|
| GATA2 | | 4 | 6 | 80 | 82 | 0.201 | -0.014 | 0.121 | 0.080 | -0.026 |
|---|
| MYC | | 4 | 6 | 1 | 3 | 0.142 | 0.031 | 0.041 | 0.035 | -0.138 |
|---|
| ATG3 | | 1 | 59 | 237 | 237 | 0.003 | 0.111 | 0.074 | 0.014 | 0.059 |
|---|
| SLC16A2 | | 1 | 59 | 237 | 237 | 0.023 | 0.109 | -0.030 | 0.071 | 0.071 |
|---|
| BAX | | 1 | 59 | 237 | 237 | 0.061 | -0.048 | 0.173 | 0.172 | -0.112 |
|---|
| HNRNPL | | 1 | 59 | 237 | 237 | -0.017 | 0.000 | 0.082 | 0.340 | -0.067 |
|---|
| CDC25B | | 1 | 59 | 237 | 237 | 0.175 | 0.052 | 0.083 | 0.032 | 0.048 |
|---|
| ZNF423 | | 1 | 59 | 237 | 237 | 0.078 | -0.081 | -0.088 | -0.169 | -0.028 |
|---|
| SLC25A1 | | 1 | 59 | 237 | 237 | 0.199 | -0.006 | 0.179 | -0.041 | 0.011 |
|---|
| RARA | | 1 | 59 | 237 | 237 | 0.160 | 0.164 | 0.160 | 0.244 | 0.017 |
|---|
| PARP1 | | 1 | 59 | 237 | 237 | 0.074 | 0.039 | 0.177 | 0.122 | 0.056 |
|---|
| ESRRG | | 1 | 59 | 237 | 237 | -0.099 | -0.033 | 0.036 | -0.001 | -0.025 |
|---|
| TSPAN31 | | 1 | 59 | 237 | 237 | -0.032 | 0.116 | 0.127 | -0.044 | 0.064 |
|---|
| TEX10 | | 1 | 59 | 237 | 237 | -0.089 | 0.056 | 0.021 | 0.214 | -0.006 |
|---|
| E2F3 | | 1 | 59 | 237 | 237 | -0.142 | 0.125 | -0.036 | 0.309 | 0.089 |
|---|
| C20orf94 | | 1 | 59 | 237 | 237 | undef | 0.154 | 0.017 | undef | undef |
|---|
| ATG12 | | 1 | 59 | 237 | 237 | -0.088 | 0.115 | 0.109 | 0.168 | 0.036 |
|---|
| CDC6 | | 2 | 27 | 1 | 10 | 0.102 | 0.134 | 0.211 | 0.284 | 0.078 |
|---|
| OASL | | 2 | 27 | 132 | 132 | -0.014 | 0.009 | 0.107 | 0.213 | -0.068 |
|---|
| IRS1 | | 1 | 59 | 237 | 237 | 0.056 | 0.073 | 0.029 | -0.076 | 0.081 |
|---|
| ATG7 | | 1 | 59 | 237 | 237 | 0.082 | 0.092 | 0.041 | -0.008 | 0.014 |
|---|
| S100A1 | | 2 | 27 | 148 | 148 | -0.115 | 0.023 | 0.050 | 0.108 | 0.039 |
|---|
| KLF5 | | 1 | 59 | 237 | 237 | -0.059 | -0.050 | 0.004 | 0.048 | -0.058 |
|---|
| EME1 | | 1 | 59 | 237 | 237 | undef | 0.218 | 0.160 | undef | undef |
|---|
| TFDP2 | | 1 | 59 | 237 | 237 | -0.015 | -0.167 | -0.038 | 0.203 | -0.098 |
|---|
| MAPK1 | | 5 | 4 | 110 | 110 | 0.157 | -0.023 | -0.125 | -0.115 | 0.092 |
|---|
| HSPB1 | | 6 | 2 | 1 | 1 | 0.262 | 0.053 | 0.231 | 0.043 | 0.144 |
|---|
| ESR1 | | 6 | 2 | 1 | 1 | 0.125 | 0.032 | 0.114 | -0.064 | 0.048 |
|---|
GO Enrichment output for subnetwork 52 in each dataset
| Name | Accession Number | Link | P-val | Corrected P-val |
|---|
| autophagy | GO:0006914 |  | 1.006E-08 | 2.314E-05 |
|---|
| autophagic vacuole formation | GO:0000045 | | 4.437E-07 | 5.103E-04 |
|---|
| traversing start control point of mitotic cell cycle | GO:0007089 | | 4.437E-07 | 3.402E-04 |
|---|
| regulation of retinoic acid receptor signaling pathway | GO:0048385 | | 4.437E-07 | 2.551E-04 |
|---|
| estrogen receptor signaling pathway | GO:0030520 | | 4.511E-07 | 2.075E-04 |
|---|
| macroautophagy | GO:0016236 | | 8.852E-07 | 3.393E-04 |
|---|
| G1 phase of mitotic cell cycle | GO:0000080 | | 1.578E-05 | 5.185E-03 |
|---|
| cellular response to starvation | GO:0009267 | | 1.578E-05 | 4.537E-03 |
|---|
| G1 phase | GO:0051318 | | 2.416E-05 | 6.173E-03 |
|---|
| cellular response to nutrient levels | GO:0031669 | | 3.502E-05 | 8.054E-03 |
|---|
| response to starvation | GO:0042594 | | 4.148E-05 | 8.672E-03 |
|---|
| Name | Accession Number | Link | P-val | Corrected P-val |
|---|
| autophagy | GO:0006914 | | 1.008E-10 | 2.463E-07 |
|---|
| regulation of retinoic acid receptor signaling pathway | GO:0048385 | | 1.564E-07 | 1.911E-04 |
|---|
| estrogen receptor signaling pathway | GO:0030520 | | 1.805E-07 | 1.47E-04 |
|---|
| traversing start control point of mitotic cell cycle | GO:0007089 | | 3.122E-07 | 1.907E-04 |
|---|
| autophagic vacuole formation | GO:0000045 | | 1.86E-06 | 9.087E-04 |
|---|
| macroautophagy | GO:0016236 | | 2.552E-06 | 1.039E-03 |
|---|
| G1 phase of mitotic cell cycle | GO:0000080 | | 1.477E-05 | 5.155E-03 |
|---|
| cellular response to starvation | GO:0009267 | | 2.335E-05 | 7.129E-03 |
|---|
| G1 phase | GO:0051318 | | 2.335E-05 | 6.337E-03 |
|---|
| steroid hormone receptor signaling pathway | GO:0030518 | | 2.457E-05 | 6.001E-03 |
|---|
| intracellular receptor-mediated signaling pathway | GO:0030522 | | 3.28E-05 | 7.285E-03 |
|---|
| Name | Accession Number | Link | P-val | Corrected P-val |
|---|
| autophagy | GO:0006914 | | 1.03E-10 | 2.478E-07 |
|---|
| traversing start control point of mitotic cell cycle | GO:0007089 | | 2.01E-07 | 2.418E-04 |
|---|
| regulation of retinoic acid receptor signaling pathway | GO:0048385 | | 2.01E-07 | 1.612E-04 |
|---|
| estrogen receptor signaling pathway | GO:0030520 | | 2.014E-07 | 1.211E-04 |
|---|
| autophagic vacuole formation | GO:0000045 | | 1.675E-06 | 8.061E-04 |
|---|
| macroautophagy | GO:0016236 | | 2.388E-06 | 9.577E-04 |
|---|
| G1 phase of mitotic cell cycle | GO:0000080 | | 1.101E-05 | 3.785E-03 |
|---|
| G1 phase | GO:0051318 | | 1.894E-05 | 5.697E-03 |
|---|
| cellular response to starvation | GO:0009267 | | 2.224E-05 | 5.946E-03 |
|---|
| steroid hormone receptor signaling pathway | GO:0030518 | | 2.822E-05 | 6.79E-03 |
|---|
| intracellular receptor-mediated signaling pathway | GO:0030522 | | 3.818E-05 | 8.351E-03 |
|---|
| Name | Accession Number | Link | P-val | Corrected P-val |
|---|
| autophagy | GO:0006914 | | 1.006E-08 | 2.314E-05 |
|---|
| autophagic vacuole formation | GO:0000045 | | 4.437E-07 | 5.103E-04 |
|---|
| traversing start control point of mitotic cell cycle | GO:0007089 | | 4.437E-07 | 3.402E-04 |
|---|
| regulation of retinoic acid receptor signaling pathway | GO:0048385 | | 4.437E-07 | 2.551E-04 |
|---|
| estrogen receptor signaling pathway | GO:0030520 | | 4.511E-07 | 2.075E-04 |
|---|
| macroautophagy | GO:0016236 | | 8.852E-07 | 3.393E-04 |
|---|
| G1 phase of mitotic cell cycle | GO:0000080 | | 1.578E-05 | 5.185E-03 |
|---|
| cellular response to starvation | GO:0009267 | | 1.578E-05 | 4.537E-03 |
|---|
| G1 phase | GO:0051318 | | 2.416E-05 | 6.173E-03 |
|---|
| cellular response to nutrient levels | GO:0031669 | | 3.502E-05 | 8.054E-03 |
|---|
| response to starvation | GO:0042594 | | 4.148E-05 | 8.672E-03 |
|---|
| Name | Accession Number | Link | P-val | Corrected P-val |
|---|
| autophagy | GO:0006914 | | 1.006E-08 | 2.314E-05 |
|---|
| autophagic vacuole formation | GO:0000045 | | 4.437E-07 | 5.103E-04 |
|---|
| traversing start control point of mitotic cell cycle | GO:0007089 | | 4.437E-07 | 3.402E-04 |
|---|
| regulation of retinoic acid receptor signaling pathway | GO:0048385 | | 4.437E-07 | 2.551E-04 |
|---|
| estrogen receptor signaling pathway | GO:0030520 | | 4.511E-07 | 2.075E-04 |
|---|
| macroautophagy | GO:0016236 | | 8.852E-07 | 3.393E-04 |
|---|
| G1 phase of mitotic cell cycle | GO:0000080 | | 1.578E-05 | 5.185E-03 |
|---|
| cellular response to starvation | GO:0009267 | | 1.578E-05 | 4.537E-03 |
|---|
| G1 phase | GO:0051318 | | 2.416E-05 | 6.173E-03 |
|---|
| cellular response to nutrient levels | GO:0031669 | | 3.502E-05 | 8.054E-03 |
|---|
| response to starvation | GO:0042594 | | 4.148E-05 | 8.672E-03 |
|---|

