Study VanDeVijver-ER-neg
Study informations
122 subnetworks in total page | file
1481 genes associated page | file
Enriched GO terms page
General informations
General Index page
Study Index page
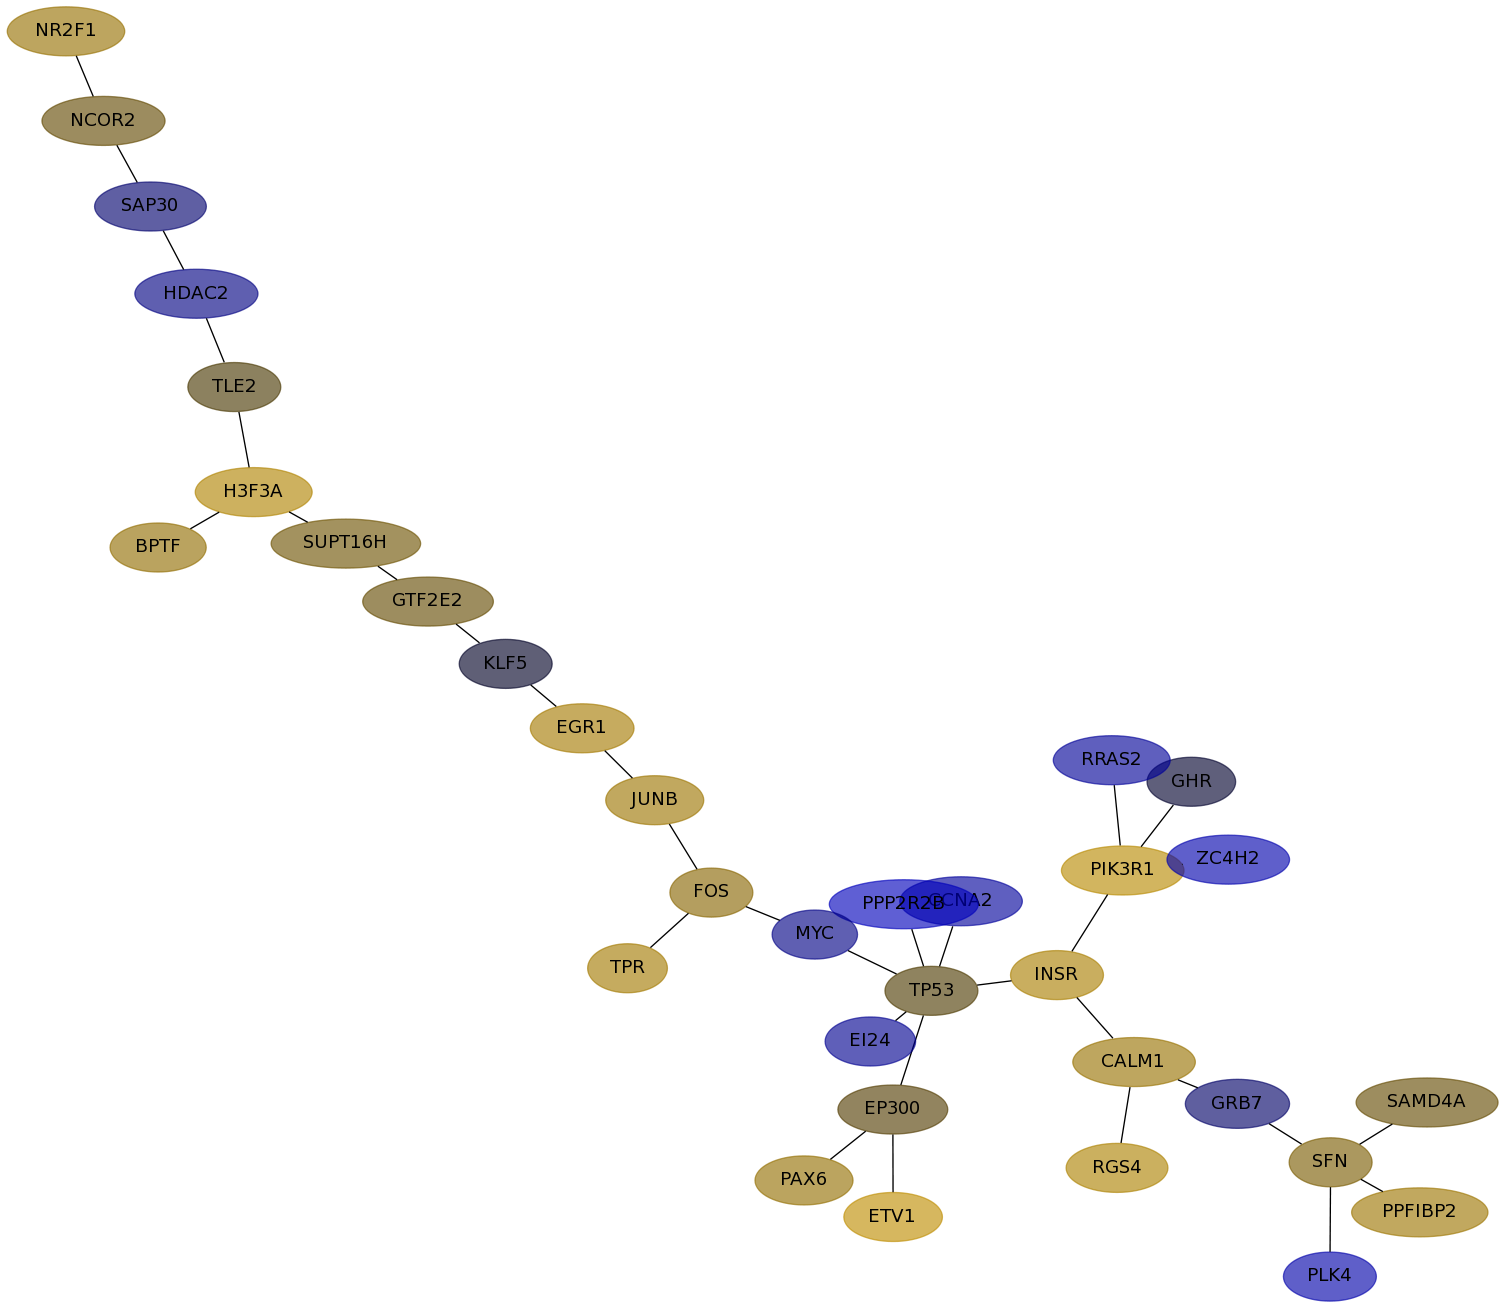
Subnetwork 1143
score
| Dataset | Score | P-val 1 | P-val 2 | P-val 3 | Fisher Score |
|---|
| Desmedt | 0.3336 | 1.487e-03 | 2.600e-05 | 1.614e-01 | 6.240e-09 |
|---|
| IPC | 0.3412 | 3.482e-01 | 1.779e-01 | 9.355e-01 | 5.795e-02 |
|---|
| Loi | 0.4759 | 5.600e-05 | 0.000e+00 | 5.366e-02 | 0.000e+00 |
|---|
| Schmidt | 0.5982 | 1.000e-06 | 0.000e+00 | 1.165e-01 | 0.000e+00 |
|---|
| Wang | 0.2576 | 7.542e-03 | 6.576e-02 | 2.285e-01 | 1.133e-04 |
|---|
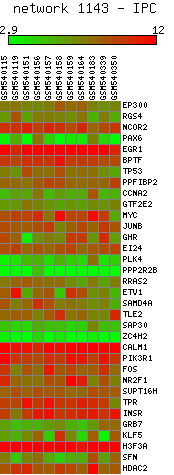
Expression data for subnetwork 1143 in each dataset
Desmedt |
IPC |
Loi |
Schmidt |
Wang |
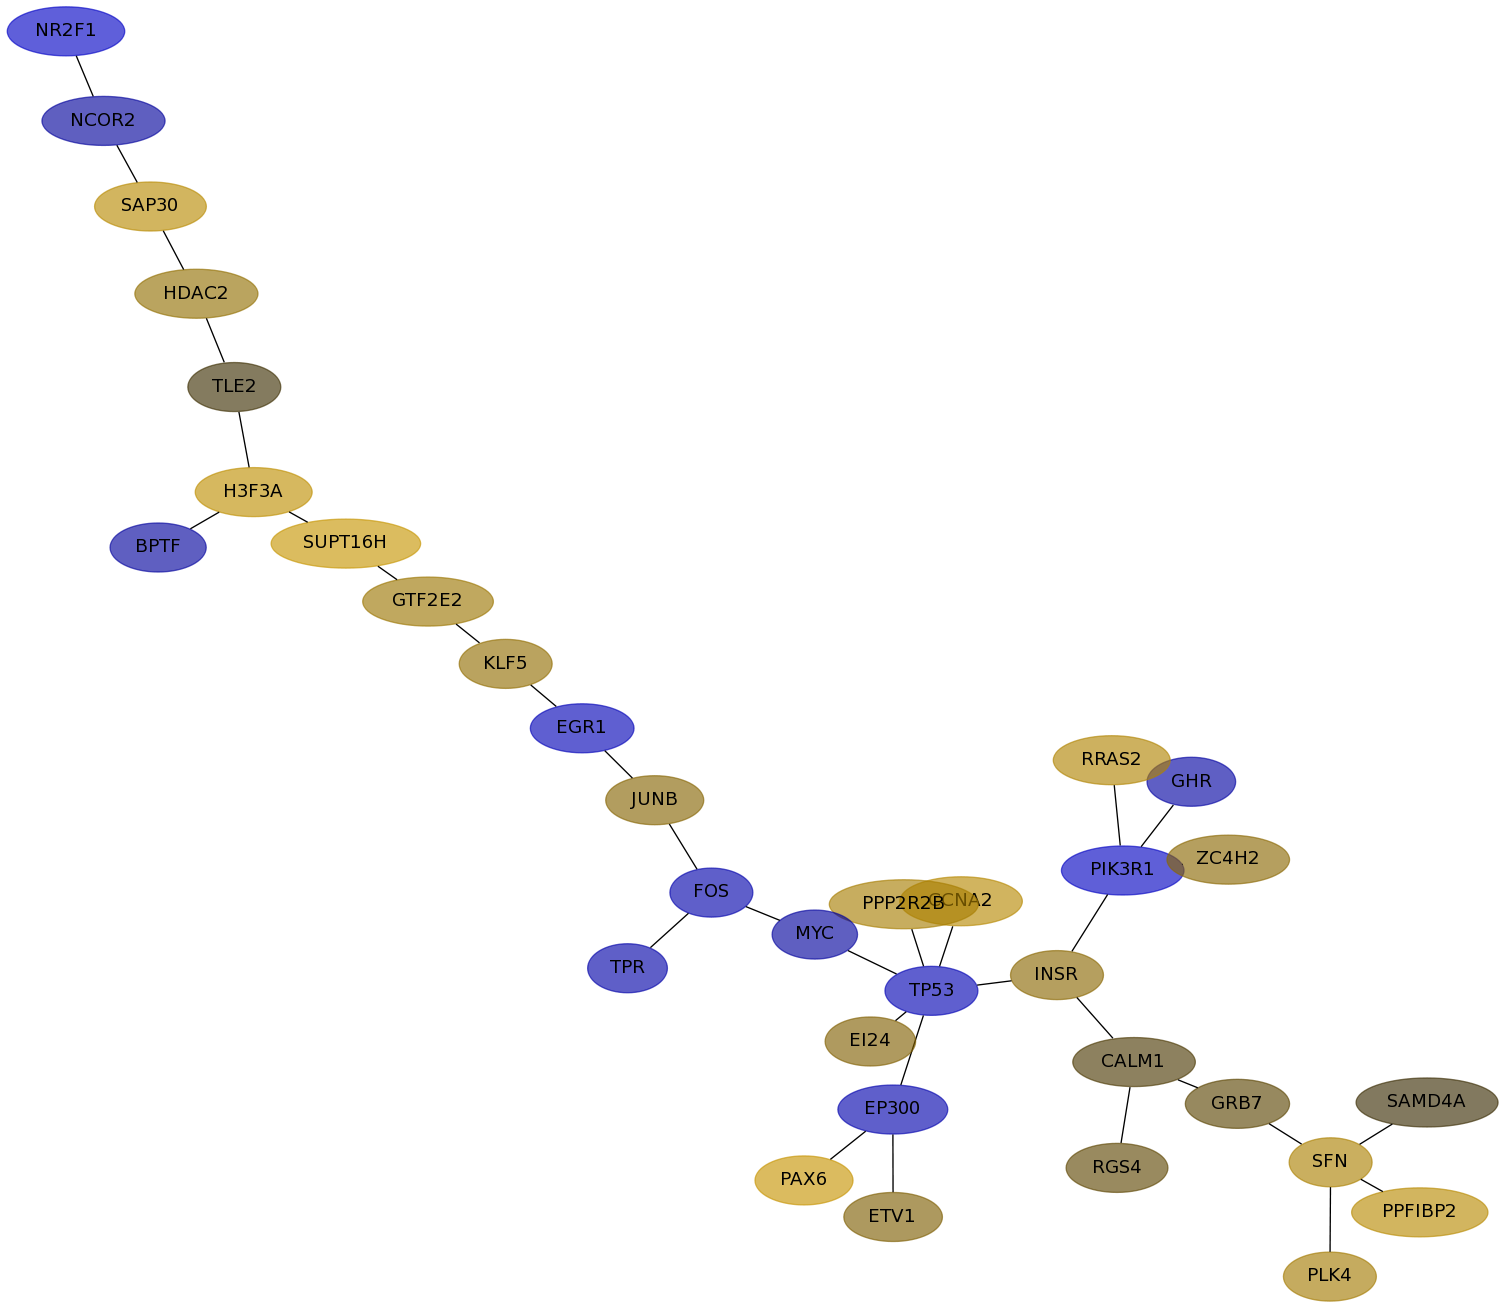
Subnetwork structure for each dataset
- Desmedt
Score for each gene in subnetwork 1143 in each dataset
| Gene Symbol | Links | Frequency | Frequency Rank | Subnetwork score rank | Global rank |
Desmedt | IPC | Loi | Schmidt | Wang |
|---|
| EP300 |   | 71 | 3 | 1 | 2 | 0.016 | -0.149 | 0.087 | 0.102 | 0.025 |
|---|
| RGS4 | | 3 | 265 | 57 | 71 | 0.144 | 0.022 | 0.160 | -0.006 | 0.371 |
|---|
| NCOR2 | | 11 | 59 | 283 | 274 | 0.024 | -0.096 | 0.211 | -0.163 | 0.114 |
|---|
| PAX6 | | 11 | 59 | 283 | 274 | 0.081 | 0.259 | -0.003 | 0.112 | 0.168 |
|---|
| EGR1 | | 11 | 59 | 283 | 274 | 0.118 | -0.184 | 0.259 | 0.130 | 0.122 |
|---|
| BPTF | | 1 | 652 | 806 | 822 | 0.076 | -0.098 | 0.159 | 0.132 | 0.030 |
|---|
| TP53 | | 28 | 15 | 1 | 9 | 0.015 | -0.167 | 0.148 | -0.027 | 0.147 |
|---|
| PPFIBP2 | | 7 | 100 | 606 | 576 | 0.098 | 0.188 | 0.320 | -0.112 | 0.013 |
|---|
| CCNA2 | | 15 | 40 | 148 | 144 | -0.097 | 0.176 | -0.053 | 0.188 | 0.246 |
|---|
| GTF2E2 | | 1 | 652 | 806 | 822 | 0.026 | 0.096 | -0.153 | 0.088 | -0.169 |
|---|
| MYC | | 24 | 21 | 148 | 137 | -0.056 | -0.101 | -0.169 | 0.188 | -0.134 |
|---|
| JUNB | | 5 | 148 | 696 | 672 | 0.101 | 0.057 | 0.086 | 0.065 | -0.015 |
|---|
| GHR | | 14 | 42 | 148 | 146 | -0.006 | -0.112 | 0.174 | 0.090 | 0.201 |
|---|
| EI24 | | 8 | 84 | 339 | 336 | -0.074 | 0.051 | 0.078 | 0.107 | 0.070 |
|---|
| PLK4 | | 1 | 652 | 806 | 822 | -0.134 | 0.114 | -0.154 | 0.260 | 0.027 |
|---|
| PPP2R2B | | 35 | 13 | 1 | 8 | -0.200 | 0.124 | -0.019 | 0.029 | -0.073 |
|---|
| RRAS2 | | 6 | 120 | 563 | 549 | -0.089 | 0.155 | 0.076 | 0.289 | 0.031 |
|---|
| ETV1 | | 11 | 59 | 746 | 724 | 0.214 | 0.046 | 0.054 | -0.065 | 0.141 |
|---|
| SAMD4A | | 1 | 652 | 806 | 822 | 0.026 | 0.009 | 0.134 | 0.189 | 0.187 |
|---|
| TLE2 | | 1 | 652 | 806 | 822 | 0.014 | 0.010 | 0.052 | 0.202 | 0.093 |
|---|
| SAP30 | | 2 | 391 | 806 | 806 | -0.033 | 0.186 | 0.083 | 0.153 | -0.184 |
|---|
| ZC4H2 | | 16 | 34 | 339 | 332 | -0.145 | 0.065 | 0.061 | 0.304 | 0.059 |
|---|
| CALM1 | | 3 | 265 | 57 | 71 | 0.091 | 0.014 | 0.021 | 0.192 | 0.247 |
|---|
| PIK3R1 | | 91 | 1 | 1 | 1 | 0.189 | -0.237 | 0.381 | 0.065 | -0.002 |
|---|
| FOS | | 20 | 24 | 148 | 138 | 0.060 | -0.137 | 0.129 | 0.185 | 0.234 |
|---|
| NR2F1 | | 6 | 120 | 444 | 438 | 0.086 | -0.252 | 0.113 | 0.133 | 0.207 |
|---|
| SUPT16H | | 1 | 652 | 806 | 822 | 0.033 | 0.268 | -0.028 | 0.155 | -0.024 |
|---|
| TPR | | 10 | 67 | 148 | 152 | 0.118 | -0.130 | 0.120 | -0.036 | 0.156 |
|---|
| INSR | | 47 | 7 | 1 | 5 | 0.135 | 0.063 | 0.173 | 0.135 | -0.072 |
|---|
| GRB7 | | 13 | 47 | 57 | 51 | -0.028 | 0.021 | 0.115 | -0.072 | 0.129 |
|---|
| KLF5 | | 25 | 19 | 57 | 50 | -0.005 | 0.077 | 0.117 | -0.007 | -0.006 |
|---|
| H3F3A | | 1 | 652 | 806 | 822 | 0.156 | 0.221 | 0.232 | 0.151 | -0.142 |
|---|
| SFN | | 3 | 265 | 806 | 794 | 0.044 | 0.141 | 0.270 | 0.023 | 0.101 |
|---|
| HDAC2 | | 1 | 652 | 806 | 822 | -0.052 | 0.079 | -0.094 | 0.148 | 0.037 |
|---|
GO Enrichment output for subnetwork 1143 in each dataset
| Name | Accession Number | Link | P-val | Corrected P-val |
|---|
| release of cytochrome c from mitochondria | GO:0001836 |  | 2.035E-07 | 4.68E-04 |
|---|
| apoptotic mitochondrial changes | GO:0008637 | | 6.148E-07 | 7.07E-04 |
|---|
| nucleosome organization | GO:0034728 | | 1.09E-06 | 8.36E-04 |
|---|
| insulin-like growth factor receptor signaling pathway | GO:0048009 | | 3.109E-06 | 1.787E-03 |
|---|
| chromatin assembly | GO:0031497 | | 1.471E-05 | 6.766E-03 |
|---|
| induction of apoptosis by intracellular signals | GO:0008629 | | 1.722E-05 | 6.599E-03 |
|---|
| protein-DNA complex assembly | GO:0065004 | | 1.866E-05 | 6.133E-03 |
|---|
| regulation of gene-specific transcription | GO:0032583 | | 2.304E-05 | 6.625E-03 |
|---|
| positive regulation of growth | GO:0045927 | | 4.213E-05 | 0.01076707 |
|---|
| DNA damage response. signal transduction | GO:0042770 | | 6.603E-05 | 0.01518586 |
|---|
| protein tetramerization | GO:0051262 | | 8.221E-05 | 0.01718968 |
|---|
| Name | Accession Number | Link | P-val | Corrected P-val |
|---|
| release of cytochrome c from mitochondria | GO:0001836 | | 3.773E-08 | 9.217E-05 |
|---|
| regulation of gene-specific transcription | GO:0032583 | | 1.175E-07 | 1.435E-04 |
|---|
| nucleosome organization | GO:0034728 | | 1.614E-07 | 1.314E-04 |
|---|
| apoptotic mitochondrial changes | GO:0008637 | | 1.805E-07 | 1.102E-04 |
|---|
| insulin-like growth factor receptor signaling pathway | GO:0048009 | | 1.304E-06 | 6.372E-04 |
|---|
| positive regulation of gene-specific transcription | GO:0043193 | | 1.487E-06 | 6.053E-04 |
|---|
| nucleosome assembly | GO:0006334 | | 2.918E-06 | 1.018E-03 |
|---|
| chromatin assembly | GO:0031497 | | 3.088E-06 | 9.429E-04 |
|---|
| protein-DNA complex assembly | GO:0065004 | | 3.845E-06 | 1.044E-03 |
|---|
| induction of apoptosis by intracellular signals | GO:0008629 | | 5.289E-06 | 1.292E-03 |
|---|
| positive regulation of growth | GO:0045927 | | 1.023E-05 | 2.273E-03 |
|---|
| Name | Accession Number | Link | P-val | Corrected P-val |
|---|
| release of cytochrome c from mitochondria | GO:0001836 | | 5.788E-08 | 1.393E-04 |
|---|
| regulation of gene-specific transcription | GO:0032583 | | 1.989E-07 | 2.393E-04 |
|---|
| nucleosome organization | GO:0034728 | | 2.481E-07 | 1.99E-04 |
|---|
| apoptotic mitochondrial changes | GO:0008637 | | 2.765E-07 | 1.663E-04 |
|---|
| insulin-like growth factor receptor signaling pathway | GO:0048009 | | 1.8E-06 | 8.663E-04 |
|---|
| positive regulation of gene-specific transcription | GO:0043193 | | 2.271E-06 | 9.108E-04 |
|---|
| nucleosome assembly | GO:0006334 | | 4.367E-06 | 1.501E-03 |
|---|
| chromatin assembly | GO:0031497 | | 4.626E-06 | 1.391E-03 |
|---|
| protein-DNA complex assembly | GO:0065004 | | 5.787E-06 | 1.547E-03 |
|---|
| induction of apoptosis by intracellular signals | GO:0008629 | | 8.059E-06 | 1.939E-03 |
|---|
| DNA integration | GO:0015074 | | 1.434E-05 | 3.136E-03 |
|---|
| Name | Accession Number | Link | P-val | Corrected P-val |
|---|
| release of cytochrome c from mitochondria | GO:0001836 | | 2.035E-07 | 4.68E-04 |
|---|
| apoptotic mitochondrial changes | GO:0008637 | | 6.148E-07 | 7.07E-04 |
|---|
| nucleosome organization | GO:0034728 | | 1.09E-06 | 8.36E-04 |
|---|
| insulin-like growth factor receptor signaling pathway | GO:0048009 | | 3.109E-06 | 1.787E-03 |
|---|
| chromatin assembly | GO:0031497 | | 1.471E-05 | 6.766E-03 |
|---|
| induction of apoptosis by intracellular signals | GO:0008629 | | 1.722E-05 | 6.599E-03 |
|---|
| protein-DNA complex assembly | GO:0065004 | | 1.866E-05 | 6.133E-03 |
|---|
| regulation of gene-specific transcription | GO:0032583 | | 2.304E-05 | 6.625E-03 |
|---|
| positive regulation of growth | GO:0045927 | | 4.213E-05 | 0.01076707 |
|---|
| DNA damage response. signal transduction | GO:0042770 | | 6.603E-05 | 0.01518586 |
|---|
| protein tetramerization | GO:0051262 | | 8.221E-05 | 0.01718968 |
|---|
| Name | Accession Number | Link | P-val | Corrected P-val |
|---|
| release of cytochrome c from mitochondria | GO:0001836 | | 2.035E-07 | 4.68E-04 |
|---|
| apoptotic mitochondrial changes | GO:0008637 | | 6.148E-07 | 7.07E-04 |
|---|
| nucleosome organization | GO:0034728 | | 1.09E-06 | 8.36E-04 |
|---|
| insulin-like growth factor receptor signaling pathway | GO:0048009 | | 3.109E-06 | 1.787E-03 |
|---|
| chromatin assembly | GO:0031497 | | 1.471E-05 | 6.766E-03 |
|---|
| induction of apoptosis by intracellular signals | GO:0008629 | | 1.722E-05 | 6.599E-03 |
|---|
| protein-DNA complex assembly | GO:0065004 | | 1.866E-05 | 6.133E-03 |
|---|
| regulation of gene-specific transcription | GO:0032583 | | 2.304E-05 | 6.625E-03 |
|---|
| positive regulation of growth | GO:0045927 | | 4.213E-05 | 0.01076707 |
|---|
| DNA damage response. signal transduction | GO:0042770 | | 6.603E-05 | 0.01518586 |
|---|
| protein tetramerization | GO:0051262 | | 8.221E-05 | 0.01718968 |
|---|

