Study Desmedt-ER-neg
Study informations
165 subnetworks in total page | file
2310 genes associated page | file
Enriched GO terms page
General informations
General Index page
Study Index page
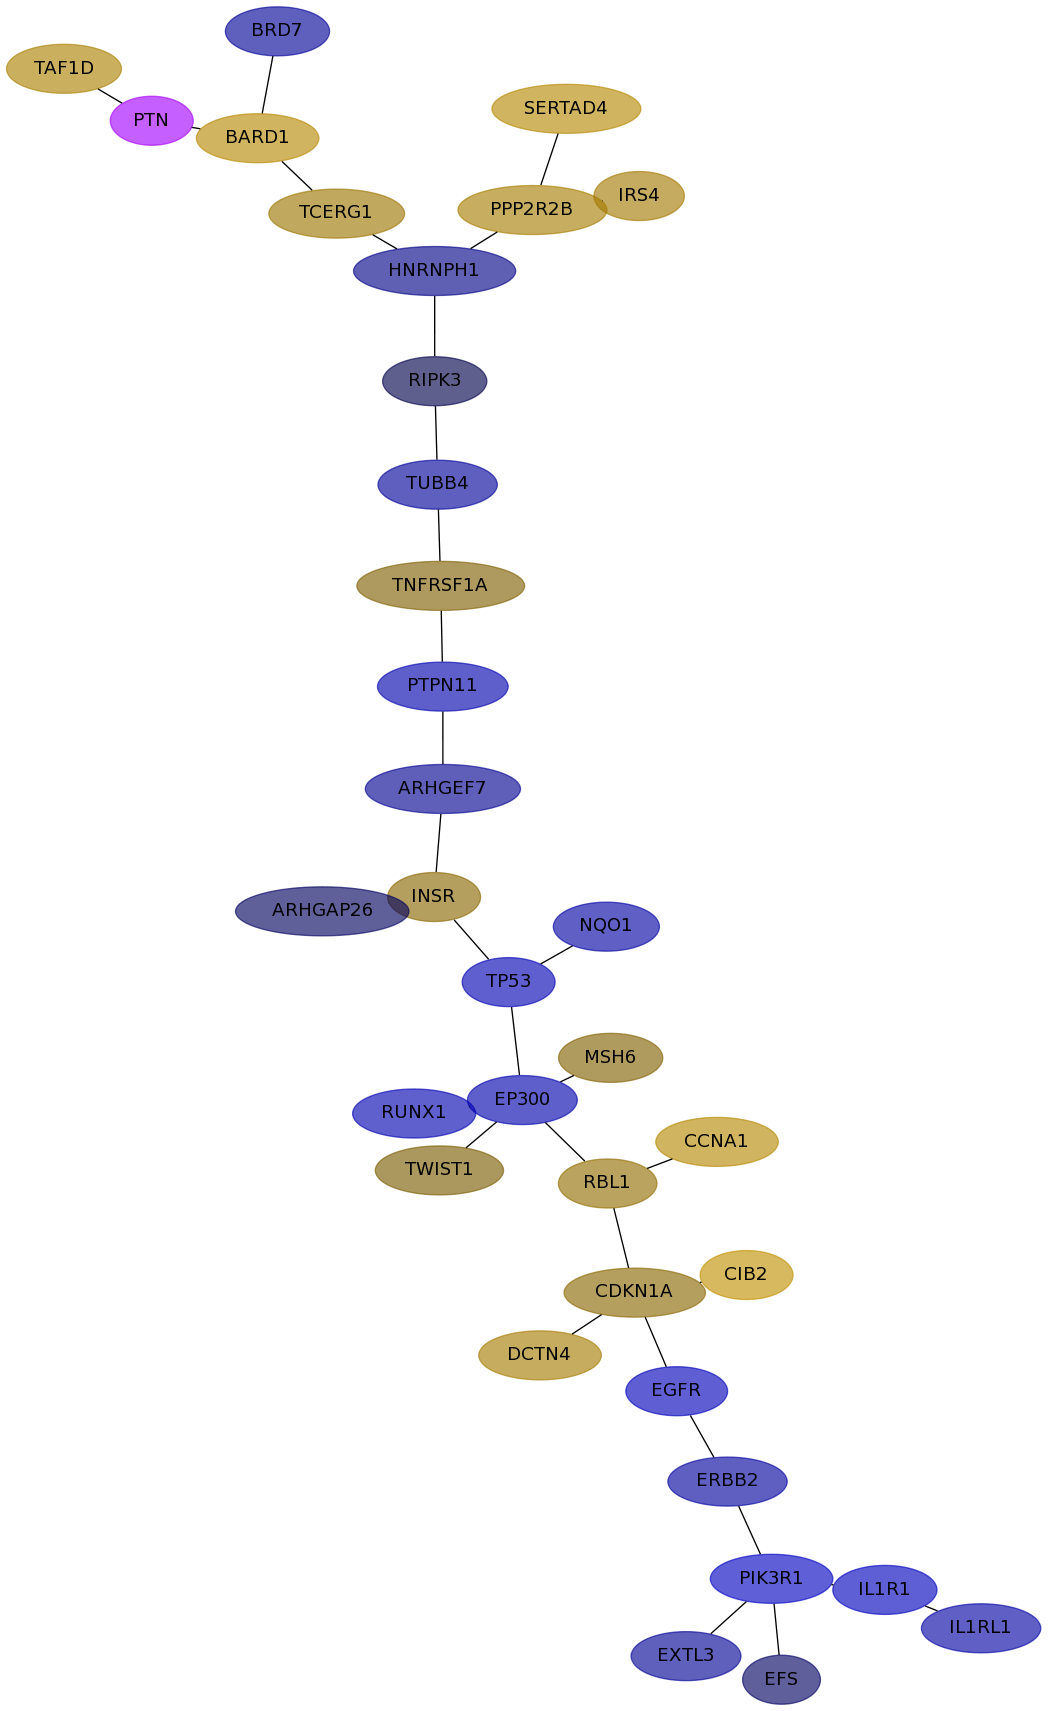
Subnetwork 6869
score
| Dataset | Score | P-val 1 | P-val 2 | P-val 3 | Fisher Score |
|---|
| IPC | 0.7489 | 3.839e-03 | 6.410e-04 | 7.828e-01 | 1.926e-06 |
|---|
| Loi | 0.2309 | 7.931e-02 | 1.111e-02 | 4.259e-01 | 3.753e-04 |
|---|
| Schmidt | 0.6760 | 0.000e+00 | 0.000e+00 | 4.217e-02 | 0.000e+00 |
|---|
| VanDeVijver | 0.7911 | 0.000e+00 | 0.000e+00 | 3.424e-03 | 0.000e+00 |
|---|
| Wang | 0.2636 | 2.419e-03 | 4.140e-02 | 3.849e-01 | 3.854e-05 |
|---|
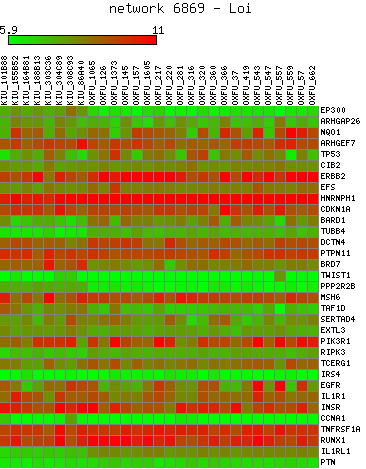
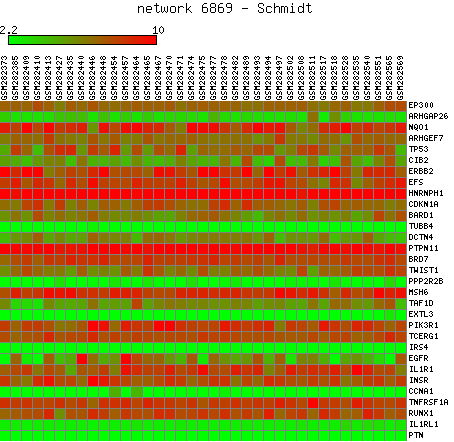
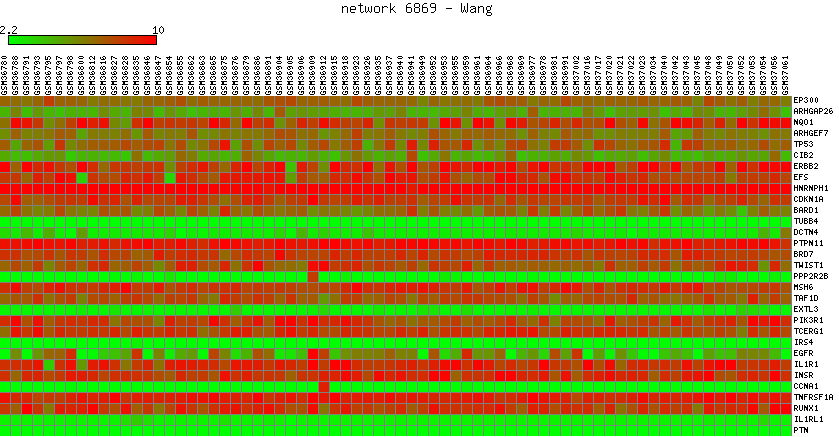
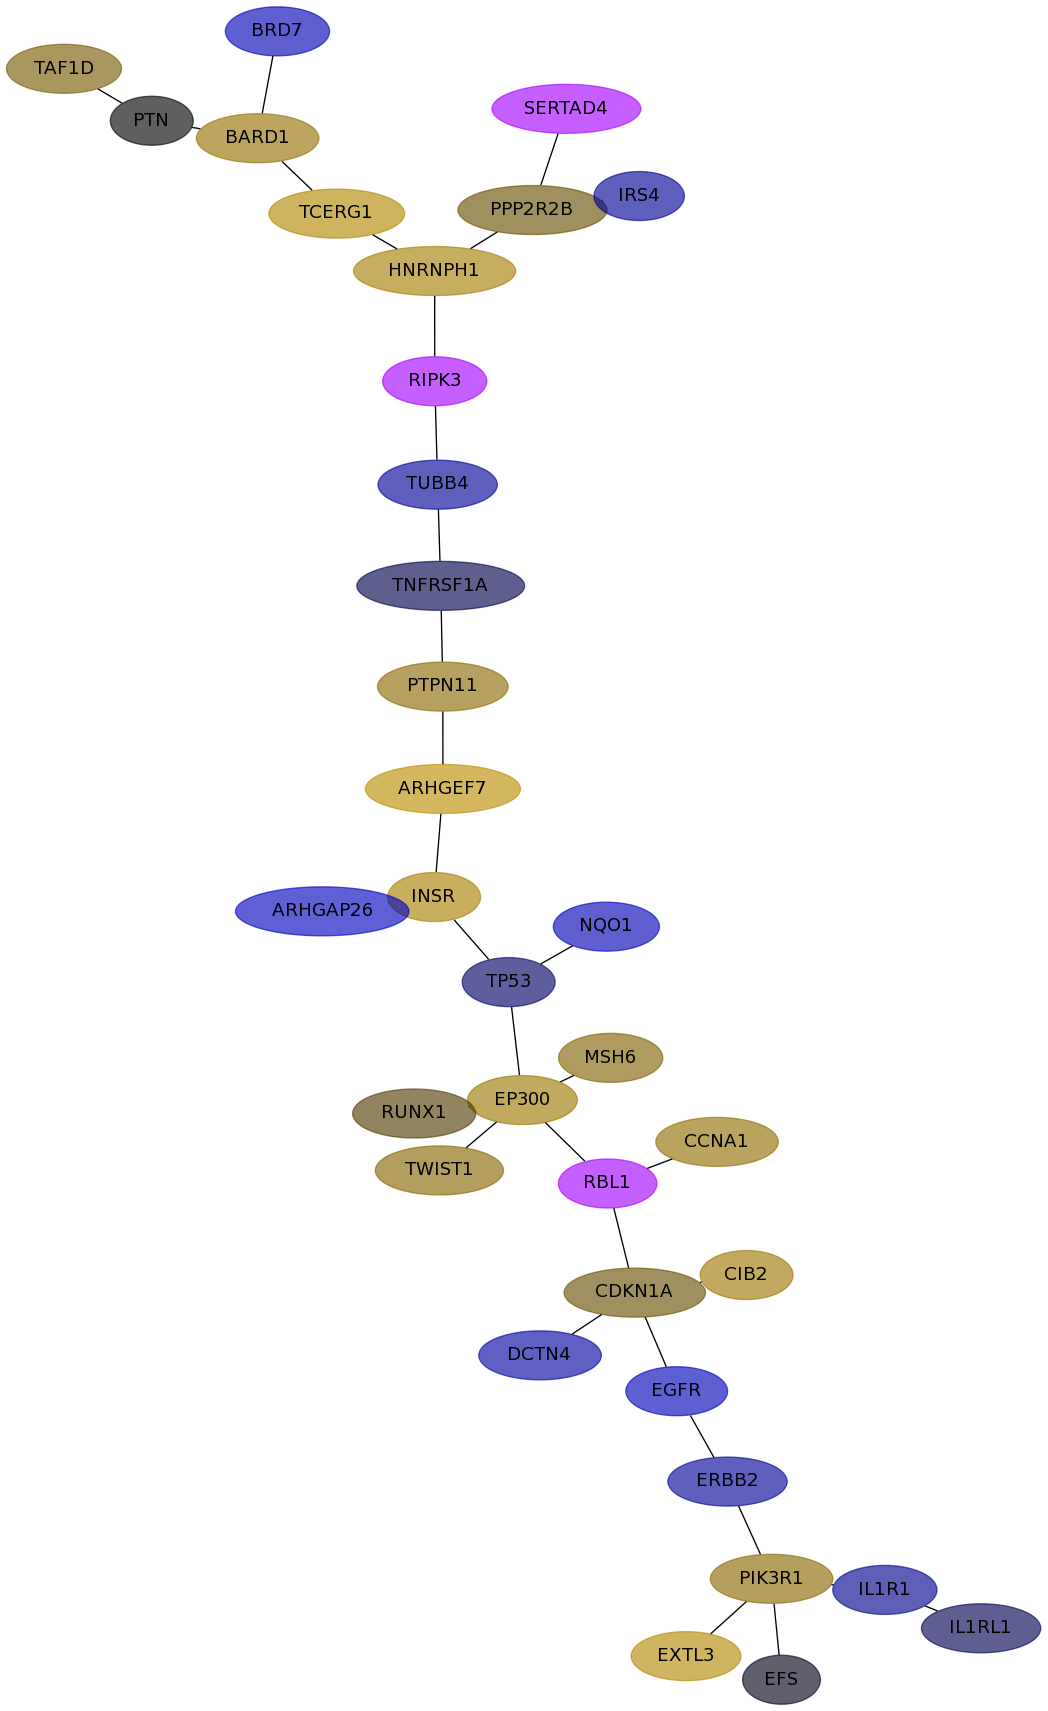
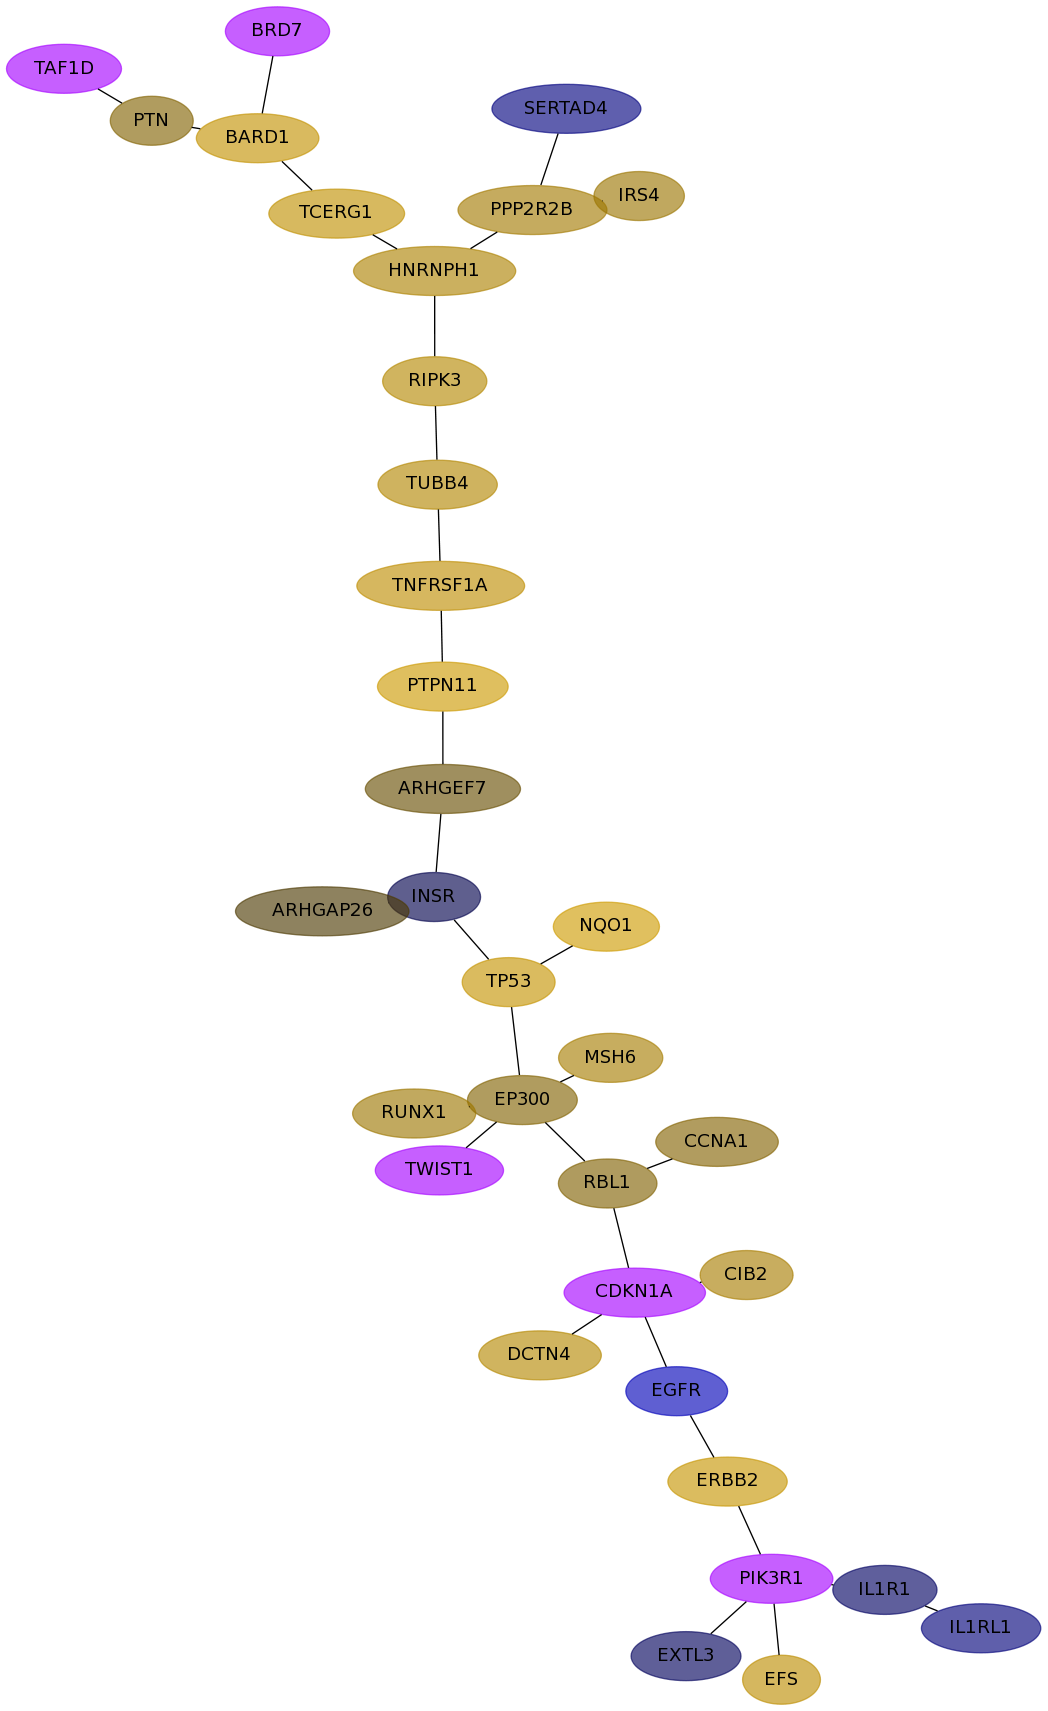
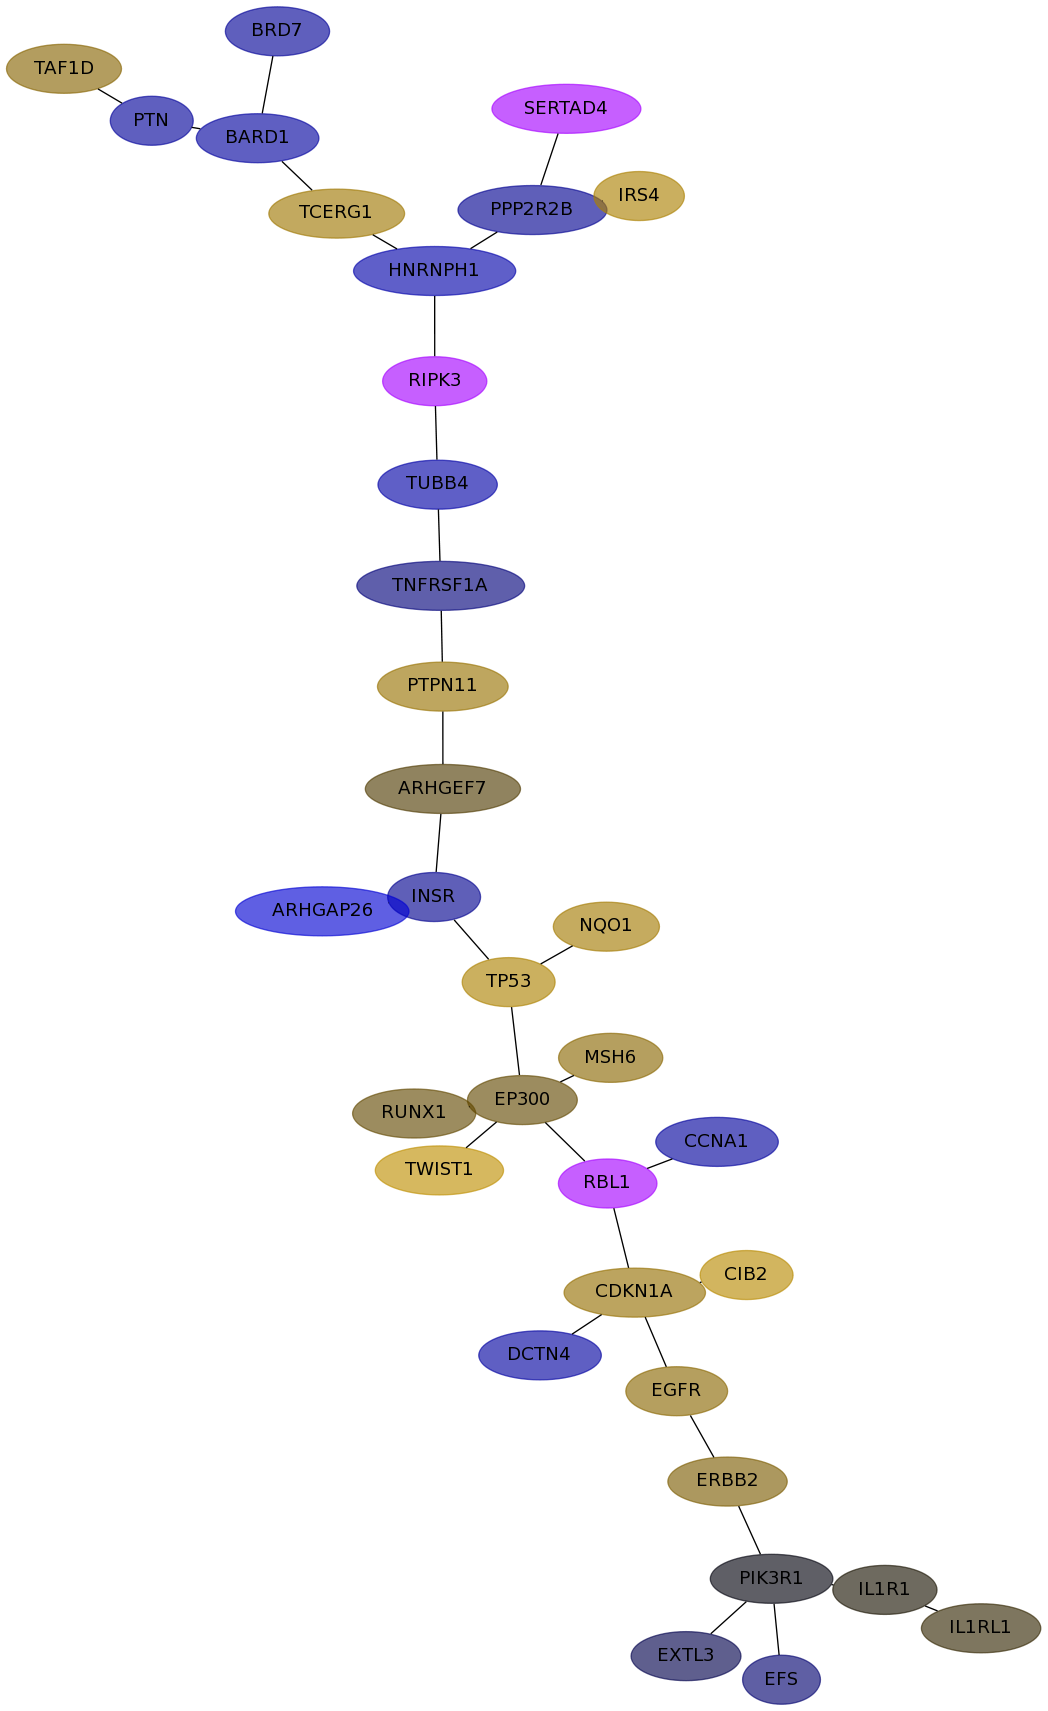
Expression data for subnetwork 6869 in each dataset
IPC |
Loi |
Schmidt |
VanDeVijver |
Wang |
Subnetwork structure for each dataset
- IPC
Score for each gene in subnetwork 6869 in each dataset
| Gene Symbol | Links | Frequency | Frequency Rank | Subnetwork score rank | Global rank |
IPC | Loi | Schmidt | VanDeVijver | Wang |
|---|
| EP300 |   | 113 | 4 | 1 | 4 | -0.149 | 0.087 | 0.102 | 0.052 | 0.025 |
|---|
| ARHGAP26 | | 21 | 73 | 457 | 438 | -0.023 | 0.171 | -0.222 | 0.015 | -0.348 |
|---|
| NQO1 | | 21 | 73 | 366 | 354 | -0.115 | 0.069 | -0.189 | 0.321 | 0.118 |
|---|
| ARHGEF7 | | 25 | 59 | 83 | 92 | -0.074 | -0.061 | 0.208 | 0.028 | 0.015 |
|---|
| TP53 | | 85 | 7 | 1 | 6 | -0.167 | 0.148 | -0.027 | 0.252 | 0.147 |
|---|
| CIB2 | | 18 | 86 | 590 | 564 | 0.228 | -0.149 | 0.106 | 0.127 | 0.190 |
|---|
| ERBB2 | | 141 | 1 | 1 | 1 | -0.103 | 0.092 | -0.090 | 0.267 | 0.046 |
|---|
| EFS | | 3 | 557 | 1323 | 1309 | -0.024 | 0.300 | -0.003 | 0.208 | -0.034 |
|---|
| HNRNPH1 | | 9 | 196 | 614 | 597 | -0.059 | 0.248 | 0.125 | 0.144 | -0.133 |
|---|
| CDKN1A | | 110 | 5 | 1 | 5 | 0.064 | 0.254 | 0.030 | undef | 0.082 |
|---|
| BARD1 | | 69 | 12 | 141 | 132 | 0.179 | -0.165 | 0.086 | 0.245 | -0.104 |
|---|
| TUBB4 | | 2 | 743 | 1421 | 1416 | -0.093 | -0.063 | -0.088 | 0.171 | -0.126 |
|---|
| DCTN4 | | 5 | 360 | 1010 | 987 | 0.122 | -0.025 | -0.111 | 0.173 | -0.105 |
|---|
| PTPN11 | | 20 | 81 | 83 | 94 | -0.152 | 0.014 | 0.066 | 0.304 | 0.089 |
|---|
| BRD7 | | 23 | 66 | 457 | 437 | -0.090 | 0.019 | -0.188 | undef | -0.086 |
|---|
| TWIST1 | | 50 | 20 | 1 | 14 | 0.044 | 0.194 | 0.061 | undef | 0.219 |
|---|
| PPP2R2B | | 39 | 29 | 179 | 173 | 0.124 | -0.019 | 0.029 | 0.116 | -0.073 |
|---|
| MSH6 | | 12 | 140 | 1 | 36 | 0.052 | -0.057 | 0.051 | 0.126 | 0.064 |
|---|
| TAF1D | | 10 | 167 | 590 | 566 | 0.141 | 0.113 | 0.041 | undef | 0.059 |
|---|
| SERTAD4 | | 8 | 222 | 1268 | 1225 | 0.173 | 0.169 | undef | -0.050 | undef |
|---|
| EXTL3 | | 1 | 1195 | 1421 | 1442 | -0.085 | 0.044 | 0.182 | -0.022 | -0.014 |
|---|
| PIK3R1 | | 127 | 2 | 1 | 2 | -0.237 | 0.381 | 0.065 | undef | -0.002 |
|---|
| RIPK3 | | 19 | 85 | 179 | 186 | -0.014 | 0.040 | undef | 0.173 | undef |
|---|
| TCERG1 | | 4 | 440 | 412 | 419 | 0.098 | 0.093 | 0.172 | 0.228 | 0.105 |
|---|
| IRS4 | | 32 | 40 | 236 | 224 | 0.115 | -0.111 | -0.088 | 0.096 | 0.142 |
|---|
| EGFR | | 117 | 3 | 1 | 3 | -0.195 | 0.240 | -0.205 | -0.187 | 0.065 |
|---|
| IL1R1 | | 1 | 1195 | 1421 | 1442 | -0.211 | 0.178 | -0.071 | -0.025 | 0.003 |
|---|
| INSR | | 96 | 6 | 236 | 221 | 0.063 | 0.173 | 0.135 | -0.014 | -0.072 |
|---|
| RBL1 | | 21 | 73 | 1 | 27 | 0.078 | undef | undef | 0.051 | undef |
|---|
| CCNA1 | | 33 | 37 | 412 | 393 | 0.174 | 0.092 | 0.078 | 0.055 | -0.098 |
|---|
| TNFRSF1A | | 8 | 222 | 412 | 413 | 0.050 | 0.094 | -0.014 | 0.214 | -0.045 |
|---|
| RUNX1 | | 5 | 360 | 906 | 890 | -0.161 | 0.140 | 0.016 | 0.102 | 0.025 |
|---|
| IL1RL1 | | 1 | 1195 | 1421 | 1442 | -0.113 | 0.072 | -0.016 | -0.044 | 0.007 |
|---|
| PTN | | 24 | 62 | 236 | 225 | undef | 0.022 | 0.000 | 0.054 | -0.092 |
|---|
GO Enrichment output for subnetwork 6869 in each dataset
| Name | Accession Number | Link | P-val | Corrected P-val |
|---|
| regulation of protein export from nucleus | GO:0046825 |  | 3.872E-12 | 9.459E-09 |
|---|
| organ growth | GO:0035265 | | 2.312E-09 | 2.824E-06 |
|---|
| negative regulation of peptide secretion | GO:0002792 | | 2.312E-09 | 1.882E-06 |
|---|
| regulation of growth hormone secretion | GO:0060123 | | 4.613E-09 | 2.817E-06 |
|---|
| nerve growth factor receptor signaling pathway | GO:0048011 | | 8.285E-09 | 4.048E-06 |
|---|
| positive regulation of MAP kinase activity | GO:0043406 | | 1.078E-08 | 4.388E-06 |
|---|
| DNA damage response. signal transduction | GO:0042770 | | 2.754E-08 | 9.612E-06 |
|---|
| DNA damage checkpoint | GO:0000077 | | 5.612E-08 | 1.714E-05 |
|---|
| DNA integrity checkpoint | GO:0031570 | | 8.618E-08 | 2.339E-05 |
|---|
| carbohydrate homeostasis | GO:0033500 | | 9.862E-08 | 2.409E-05 |
|---|
| regulation of intracellular protein transport | GO:0033157 | | 1.447E-07 | 3.214E-05 |
|---|
| Name | Accession Number | Link | P-val | Corrected P-val |
|---|
| regulation of protein export from nucleus | GO:0046825 | | 4.979E-12 | 1.198E-08 |
|---|
| organ growth | GO:0035265 | | 2.833E-09 | 3.409E-06 |
|---|
| negative regulation of peptide secretion | GO:0002792 | | 2.833E-09 | 2.272E-06 |
|---|
| regulation of growth hormone secretion | GO:0060123 | | 5.654E-09 | 3.401E-06 |
|---|
| nerve growth factor receptor signaling pathway | GO:0048011 | | 1.015E-08 | 4.886E-06 |
|---|
| positive regulation of MAP kinase activity | GO:0043406 | | 1.506E-08 | 6.038E-06 |
|---|
| DNA damage response. signal transduction | GO:0042770 | | 3.019E-08 | 1.038E-05 |
|---|
| DNA damage checkpoint | GO:0000077 | | 5.286E-08 | 1.59E-05 |
|---|
| DNA integrity checkpoint | GO:0031570 | | 8.335E-08 | 2.228E-05 |
|---|
| carbohydrate homeostasis | GO:0033500 | | 1.104E-07 | 2.657E-05 |
|---|
| regulation of intracellular protein transport | GO:0033157 | | 1.854E-07 | 4.055E-05 |
|---|
| Name | Accession Number | Link | P-val | Corrected P-val |
|---|
| regulation of protein export from nucleus | GO:0046825 | | 3.354E-12 | 7.715E-09 |
|---|
| negative regulation of peptide secretion | GO:0002792 | | 8.143E-10 | 9.365E-07 |
|---|
| organ growth | GO:0035265 | | 5.669E-09 | 4.346E-06 |
|---|
| regulation of growth hormone secretion | GO:0060123 | | 5.669E-09 | 3.26E-06 |
|---|
| nerve growth factor receptor signaling pathway | GO:0048011 | | 1.131E-08 | 5.201E-06 |
|---|
| positive regulation of MAP kinase activity | GO:0043406 | | 2.481E-08 | 9.51E-06 |
|---|
| DNA damage response. signal transduction | GO:0042770 | | 5.33E-08 | 1.751E-05 |
|---|
| DNA damage checkpoint | GO:0000077 | | 8.853E-08 | 2.545E-05 |
|---|
| carbohydrate homeostasis | GO:0033500 | | 1.23E-07 | 3.143E-05 |
|---|
| DNA integrity checkpoint | GO:0031570 | | 1.438E-07 | 3.307E-05 |
|---|
| regulation of intracellular protein transport | GO:0033157 | | 1.673E-07 | 3.497E-05 |
|---|
VanDeVijver file
| Name | Accession Number | Link | P-val | Corrected P-val |
|---|
| positive regulation of MAP kinase activity | GO:0043406 | | 3.575E-07 | 6.588E-04 |
|---|
| protein amino acid autophosphorylation | GO:0046777 | | 1.527E-06 | 1.407E-03 |
|---|
| regulation of MAP kinase activity | GO:0043405 | | 1.617E-06 | 9.936E-04 |
|---|
| response to UV | GO:0009411 | | 1.768E-06 | 8.144E-04 |
|---|
| positive regulation of nitric oxide biosynthetic process | GO:0045429 | | 4.607E-06 | 1.698E-03 |
|---|
| DNA damage response. signal transduction | GO:0042770 | | 4.833E-06 | 1.485E-03 |
|---|
| positive regulation of protein kinase activity | GO:0045860 | | 6.047E-06 | 1.592E-03 |
|---|
| positive regulation of transferase activity | GO:0051347 | | 6.774E-06 | 1.561E-03 |
|---|
| regulation of nitric oxide biosynthetic process | GO:0045428 | | 7.952E-06 | 1.628E-03 |
|---|
| protein tetramerization | GO:0051262 | | 7.952E-06 | 1.465E-03 |
|---|
| positive regulation of epithelial cell proliferation | GO:0050679 | | 1.01E-05 | 1.692E-03 |
|---|
| Name | Accession Number | Link | P-val | Corrected P-val |
|---|
| regulation of protein export from nucleus | GO:0046825 | | 3.354E-12 | 7.715E-09 |
|---|
| negative regulation of peptide secretion | GO:0002792 | | 8.143E-10 | 9.365E-07 |
|---|
| organ growth | GO:0035265 | | 5.669E-09 | 4.346E-06 |
|---|
| regulation of growth hormone secretion | GO:0060123 | | 5.669E-09 | 3.26E-06 |
|---|
| nerve growth factor receptor signaling pathway | GO:0048011 | | 1.131E-08 | 5.201E-06 |
|---|
| positive regulation of MAP kinase activity | GO:0043406 | | 2.481E-08 | 9.51E-06 |
|---|
| DNA damage response. signal transduction | GO:0042770 | | 5.33E-08 | 1.751E-05 |
|---|
| DNA damage checkpoint | GO:0000077 | | 8.853E-08 | 2.545E-05 |
|---|
| carbohydrate homeostasis | GO:0033500 | | 1.23E-07 | 3.143E-05 |
|---|
| DNA integrity checkpoint | GO:0031570 | | 1.438E-07 | 3.307E-05 |
|---|
| regulation of intracellular protein transport | GO:0033157 | | 1.673E-07 | 3.497E-05 |
|---|

