Study Desmedt-ER-neg
Study informations
165 subnetworks in total page | file
2310 genes associated page | file
Enriched GO terms page
General informations
General Index page
Study Index page
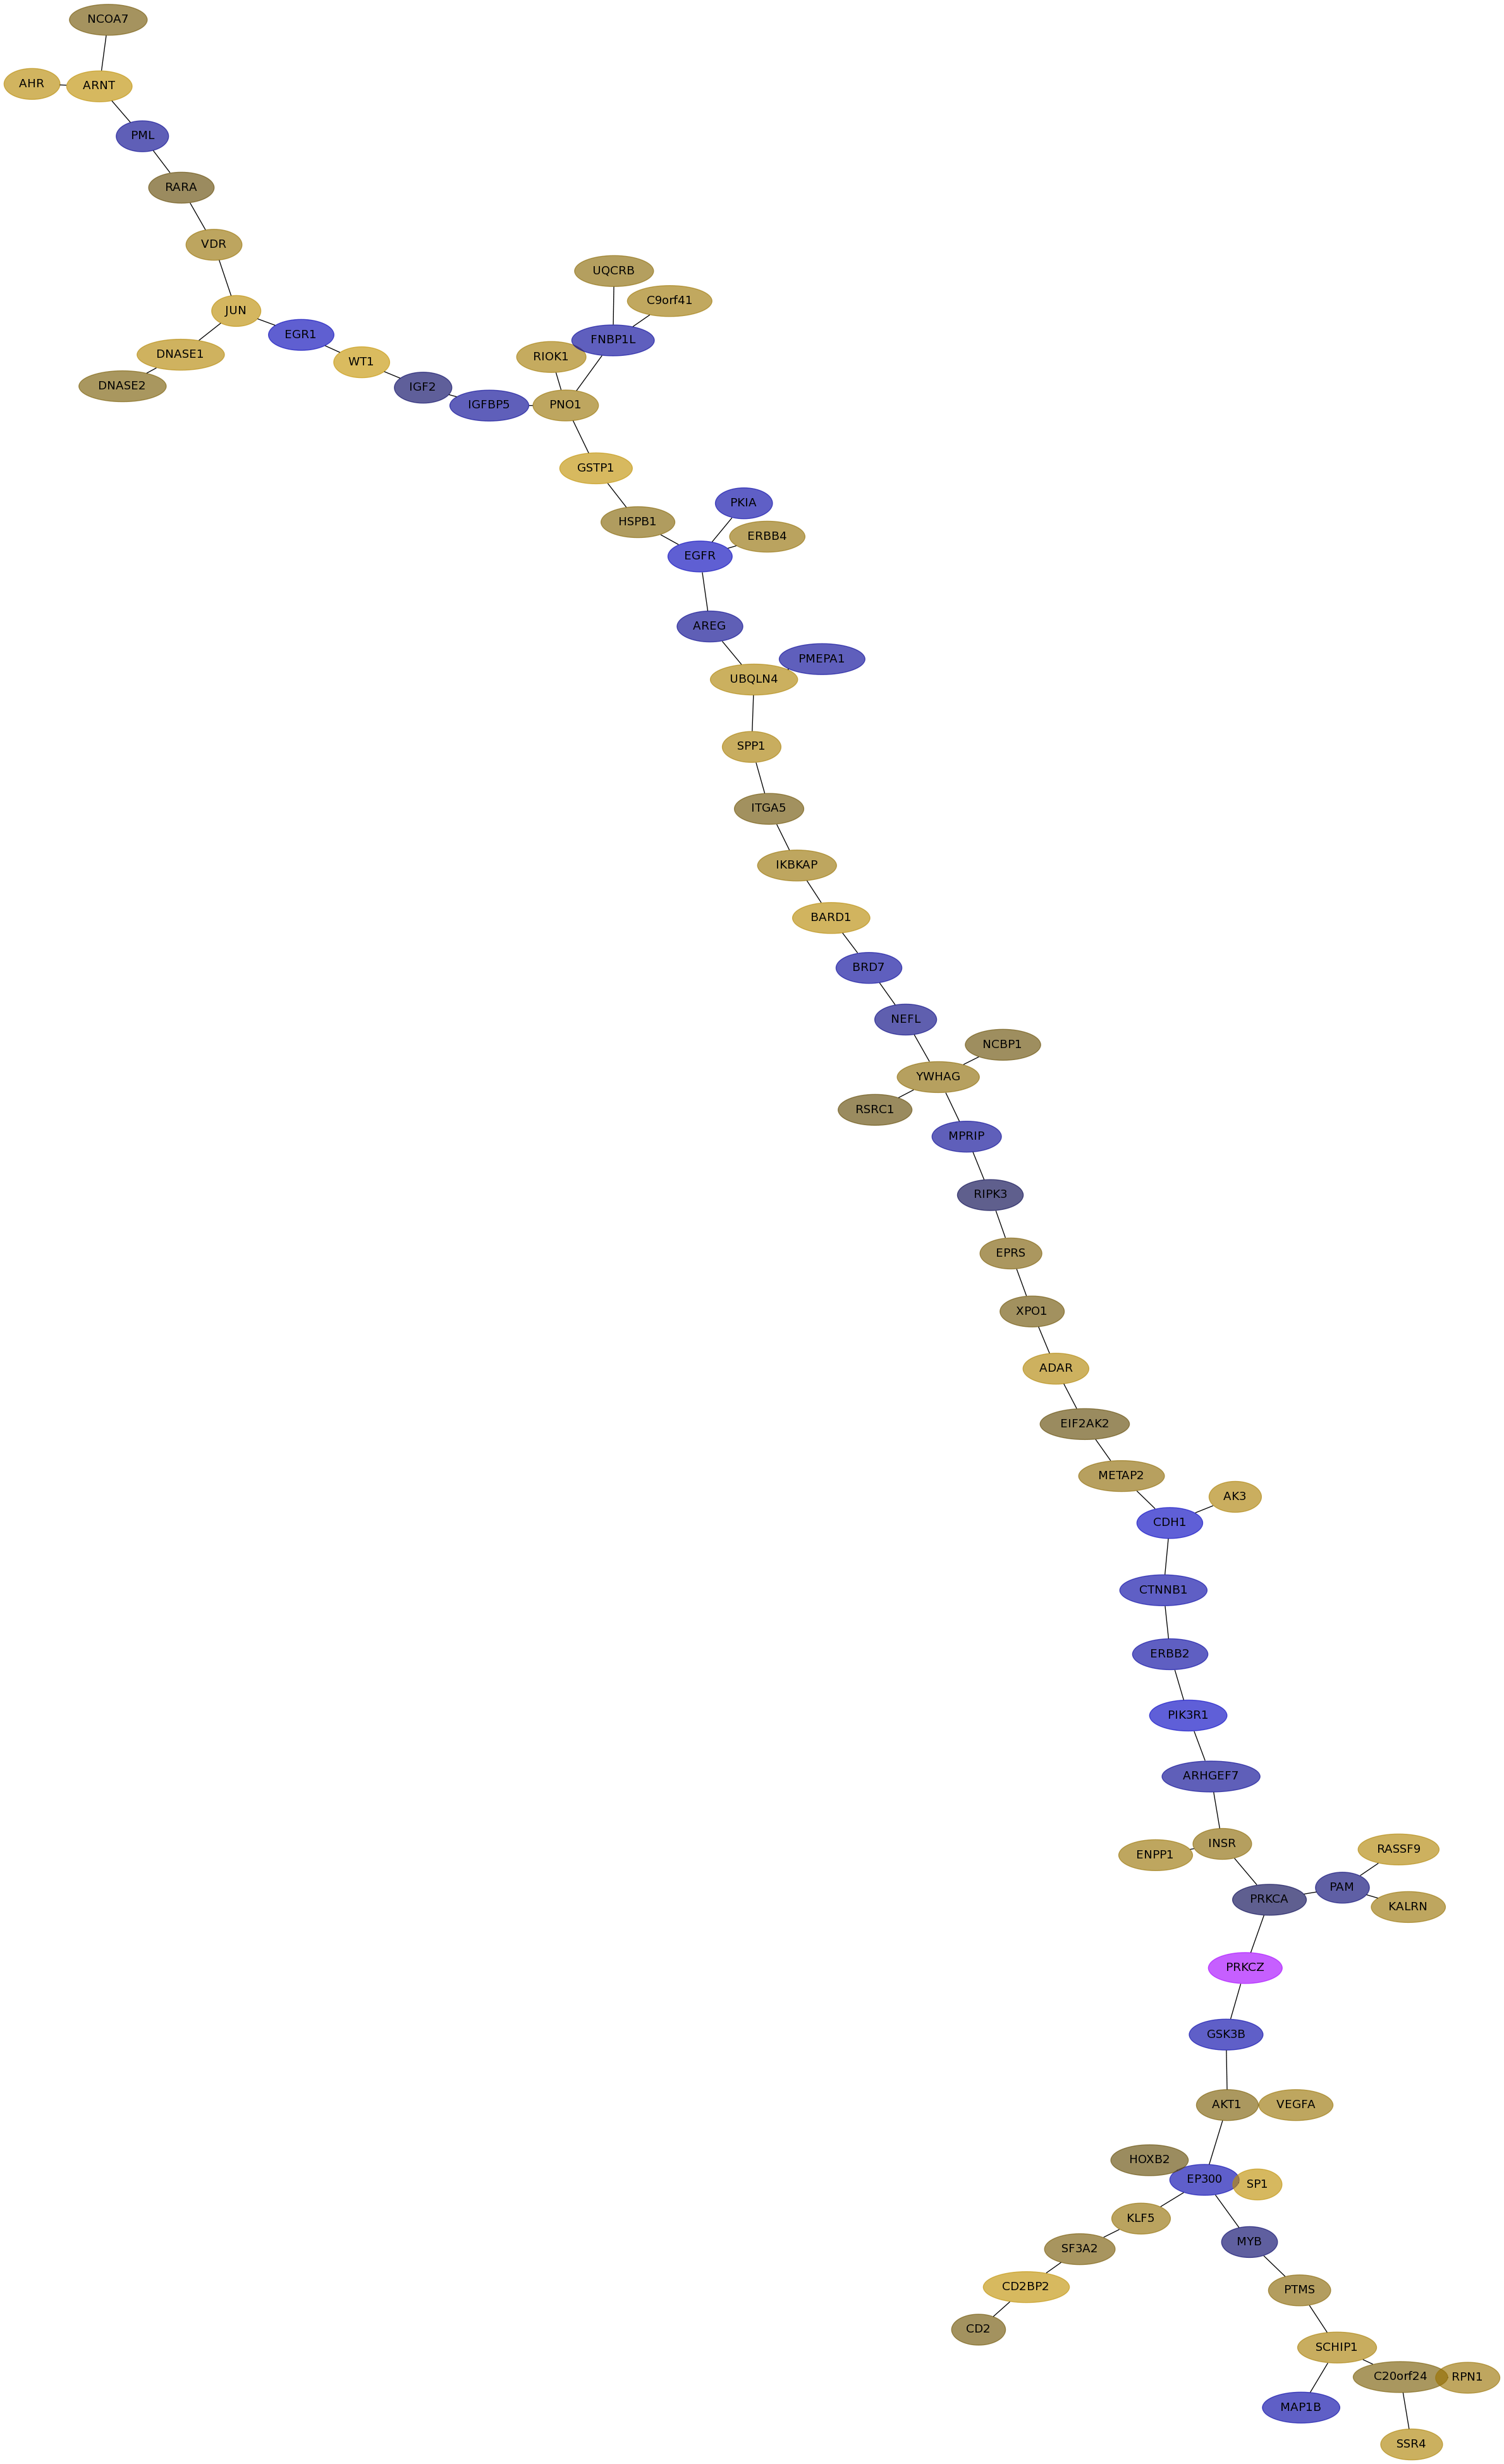
Subnetwork 6831
score
| Dataset | Score | P-val 1 | P-val 2 | P-val 3 | Fisher Score |
|---|
| IPC | 0.7496 | 3.796e-03 | 6.310e-04 | 7.813e-01 | 1.871e-06 |
|---|
| Loi | 0.2308 | 7.942e-02 | 1.114e-02 | 4.262e-01 | 3.770e-04 |
|---|
| Schmidt | 0.6756 | 0.000e+00 | 0.000e+00 | 4.257e-02 | 0.000e+00 |
|---|
| VanDeVijver | 0.7911 | 0.000e+00 | 0.000e+00 | 3.433e-03 | 0.000e+00 |
|---|
| Wang | 0.2635 | 2.425e-03 | 4.146e-02 | 3.851e-01 | 3.872e-05 |
|---|
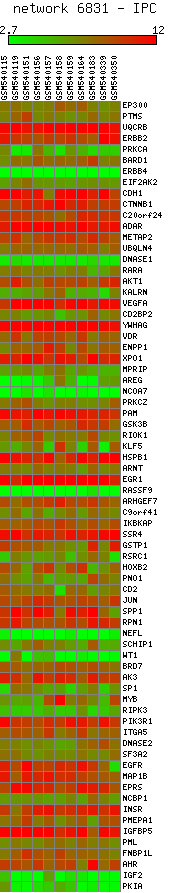
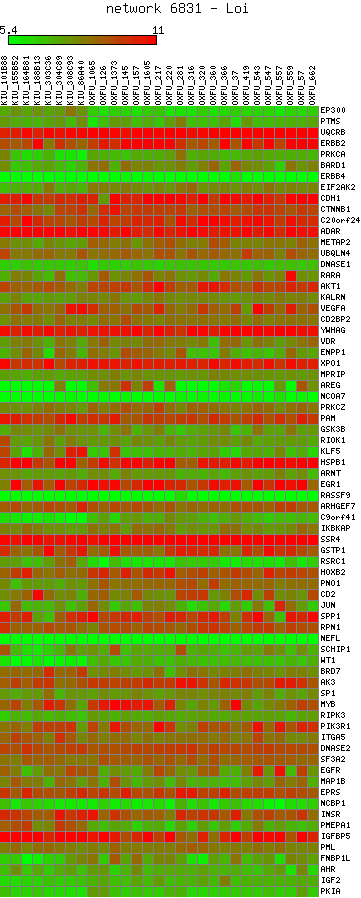
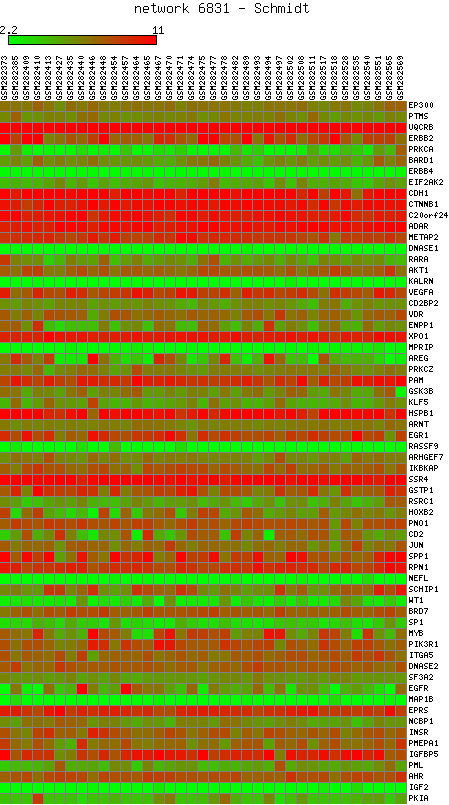
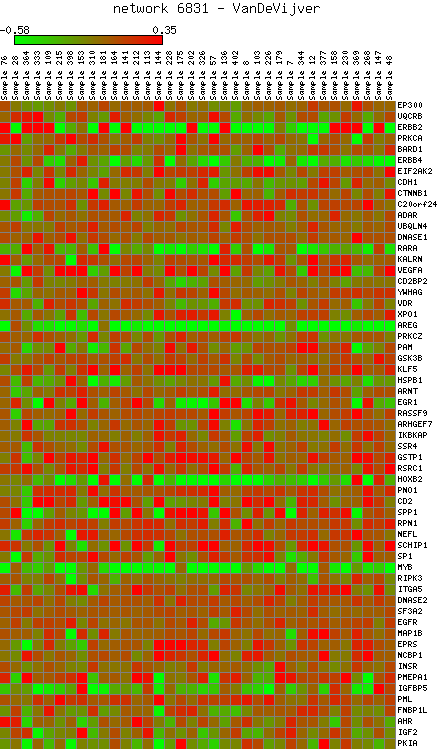
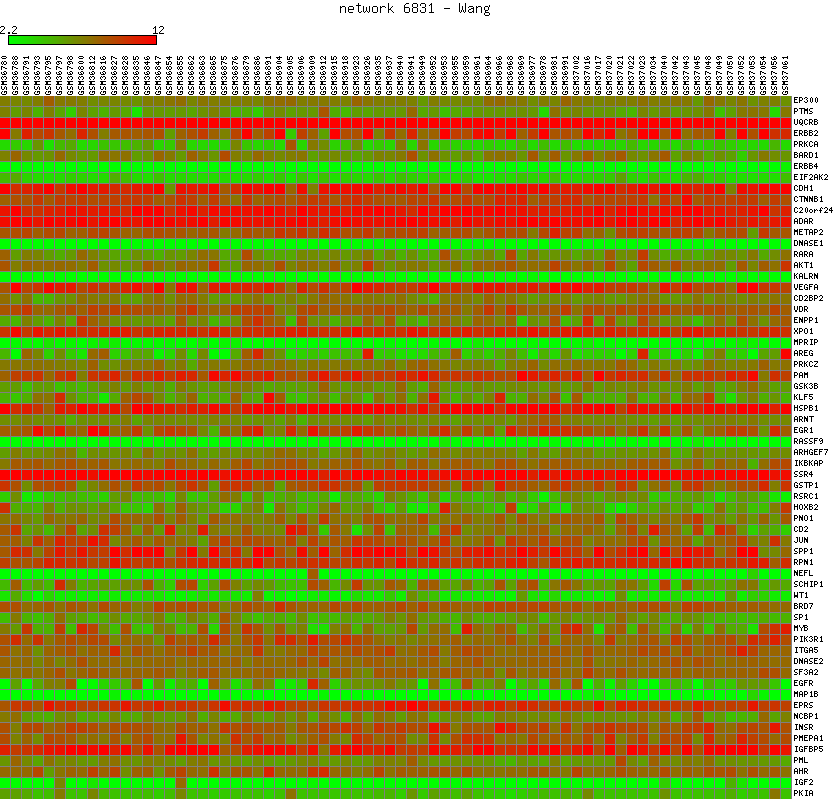
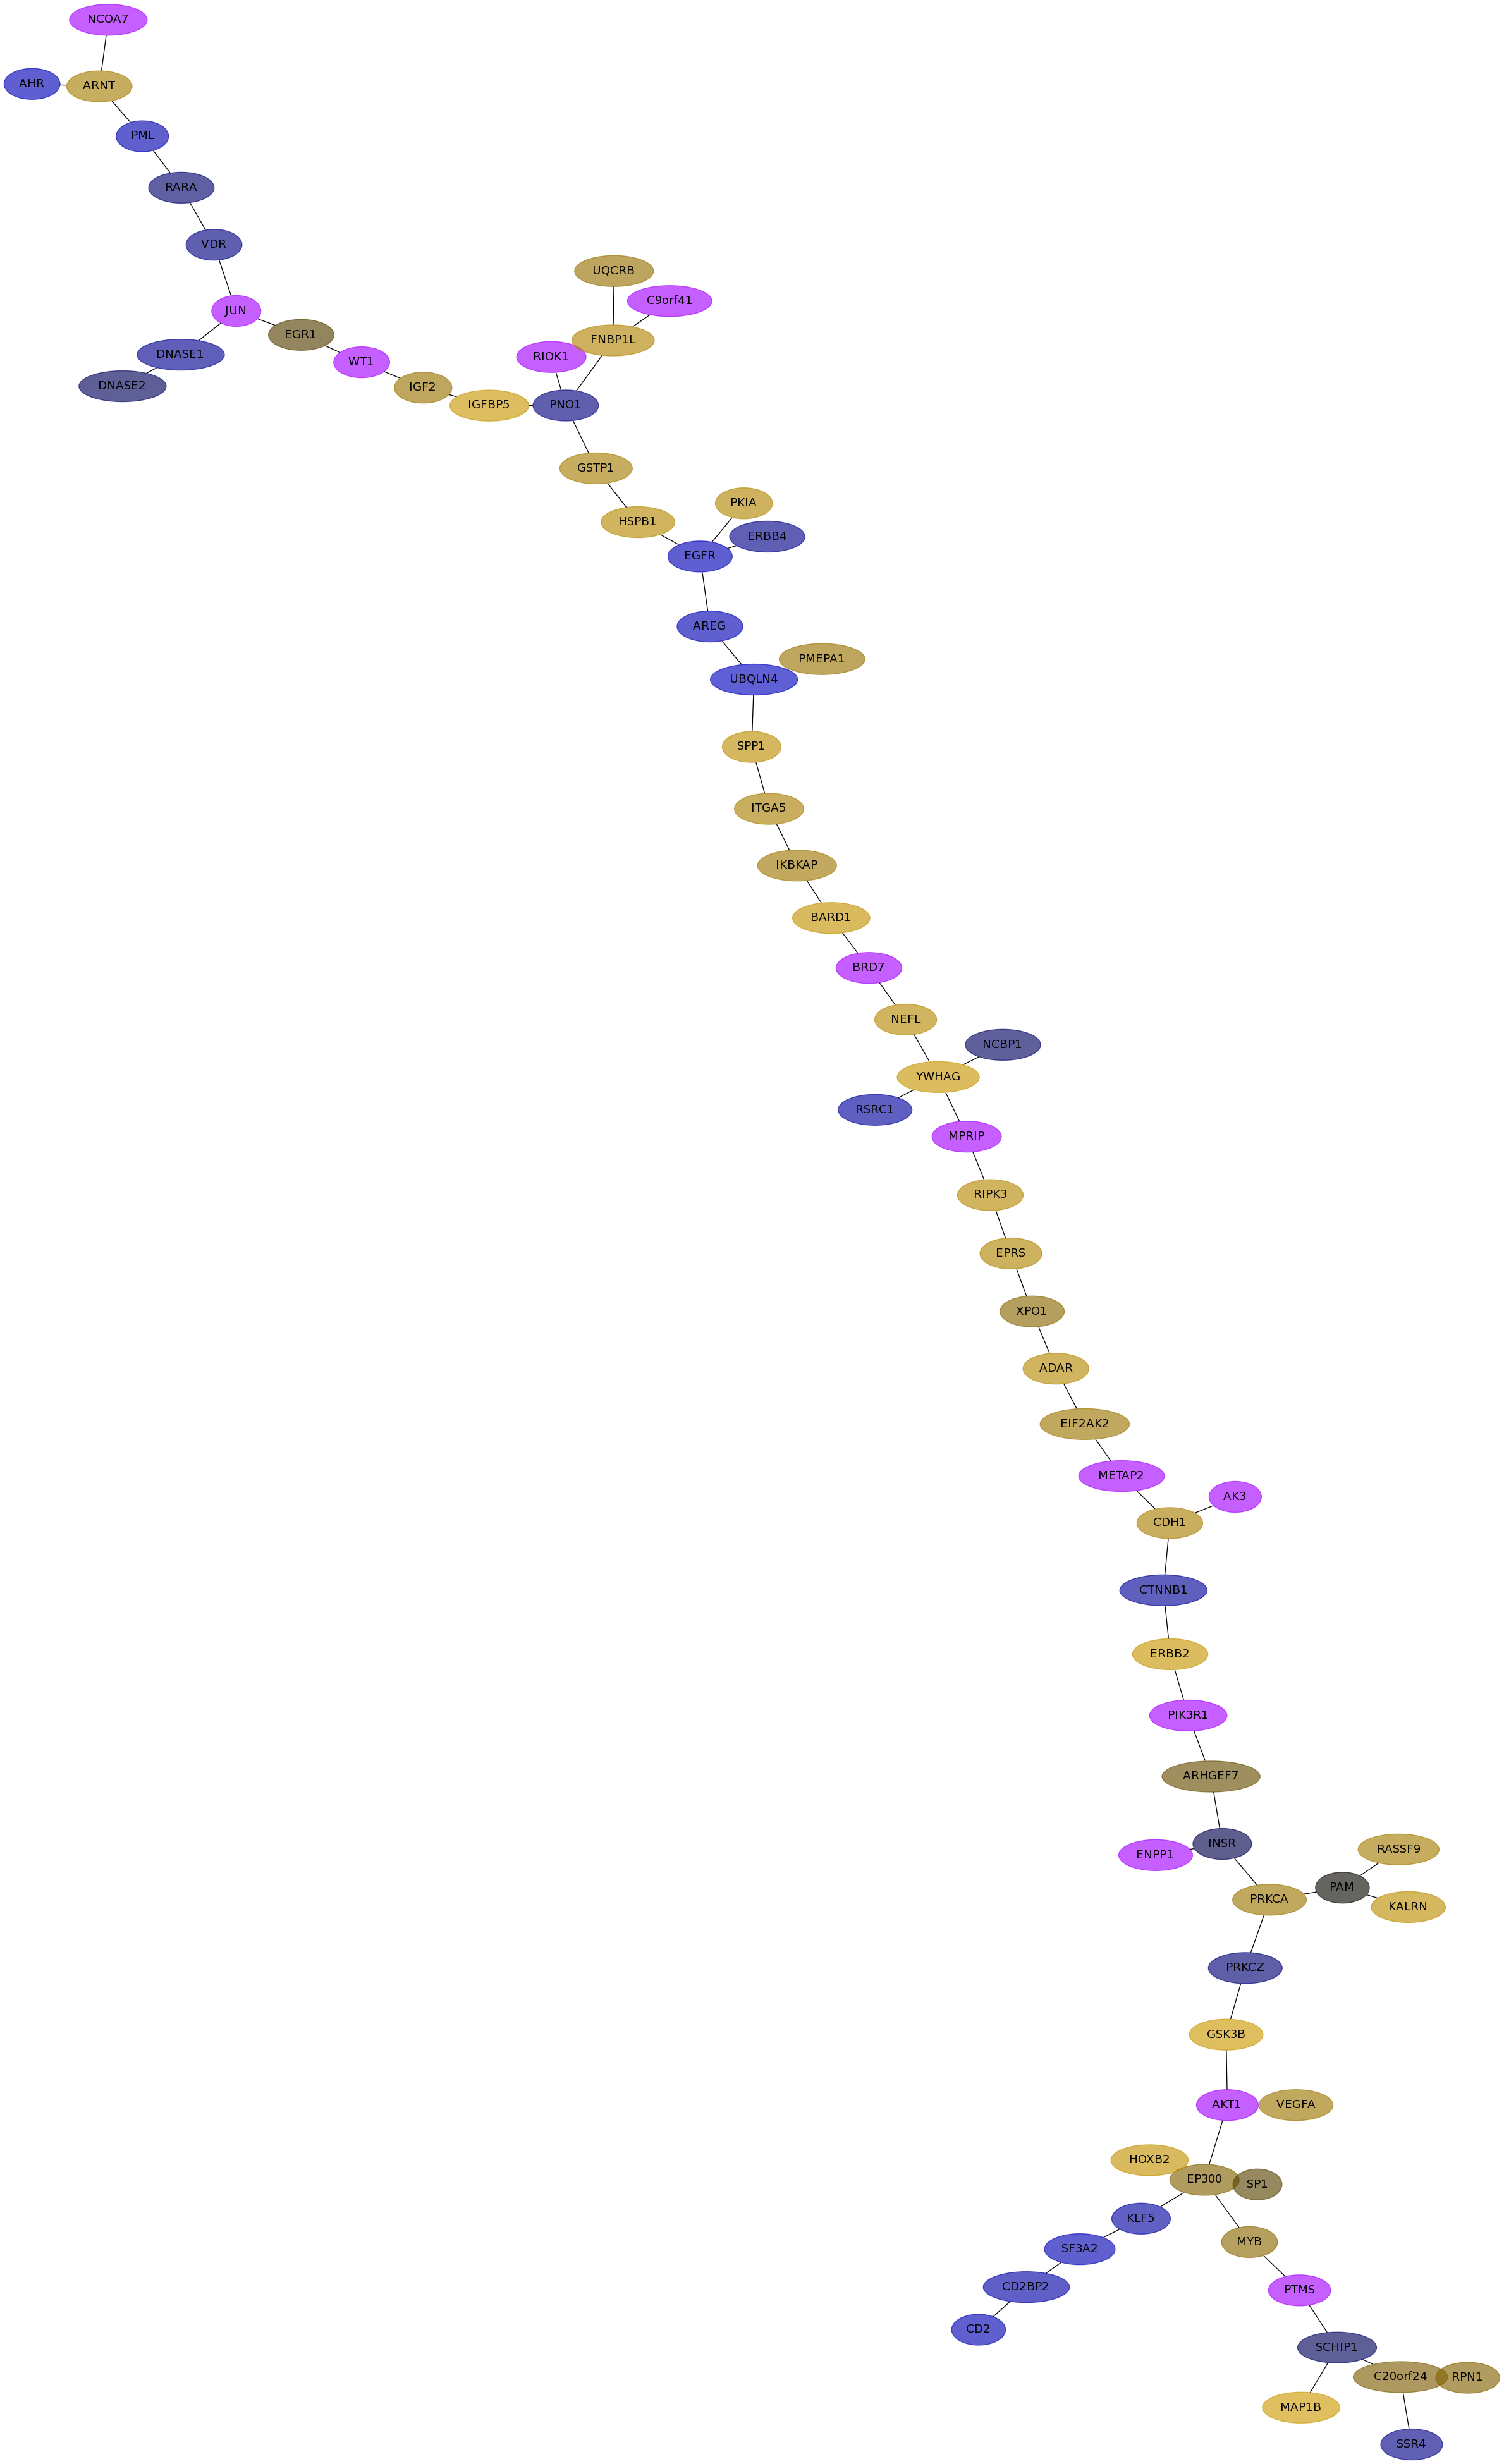
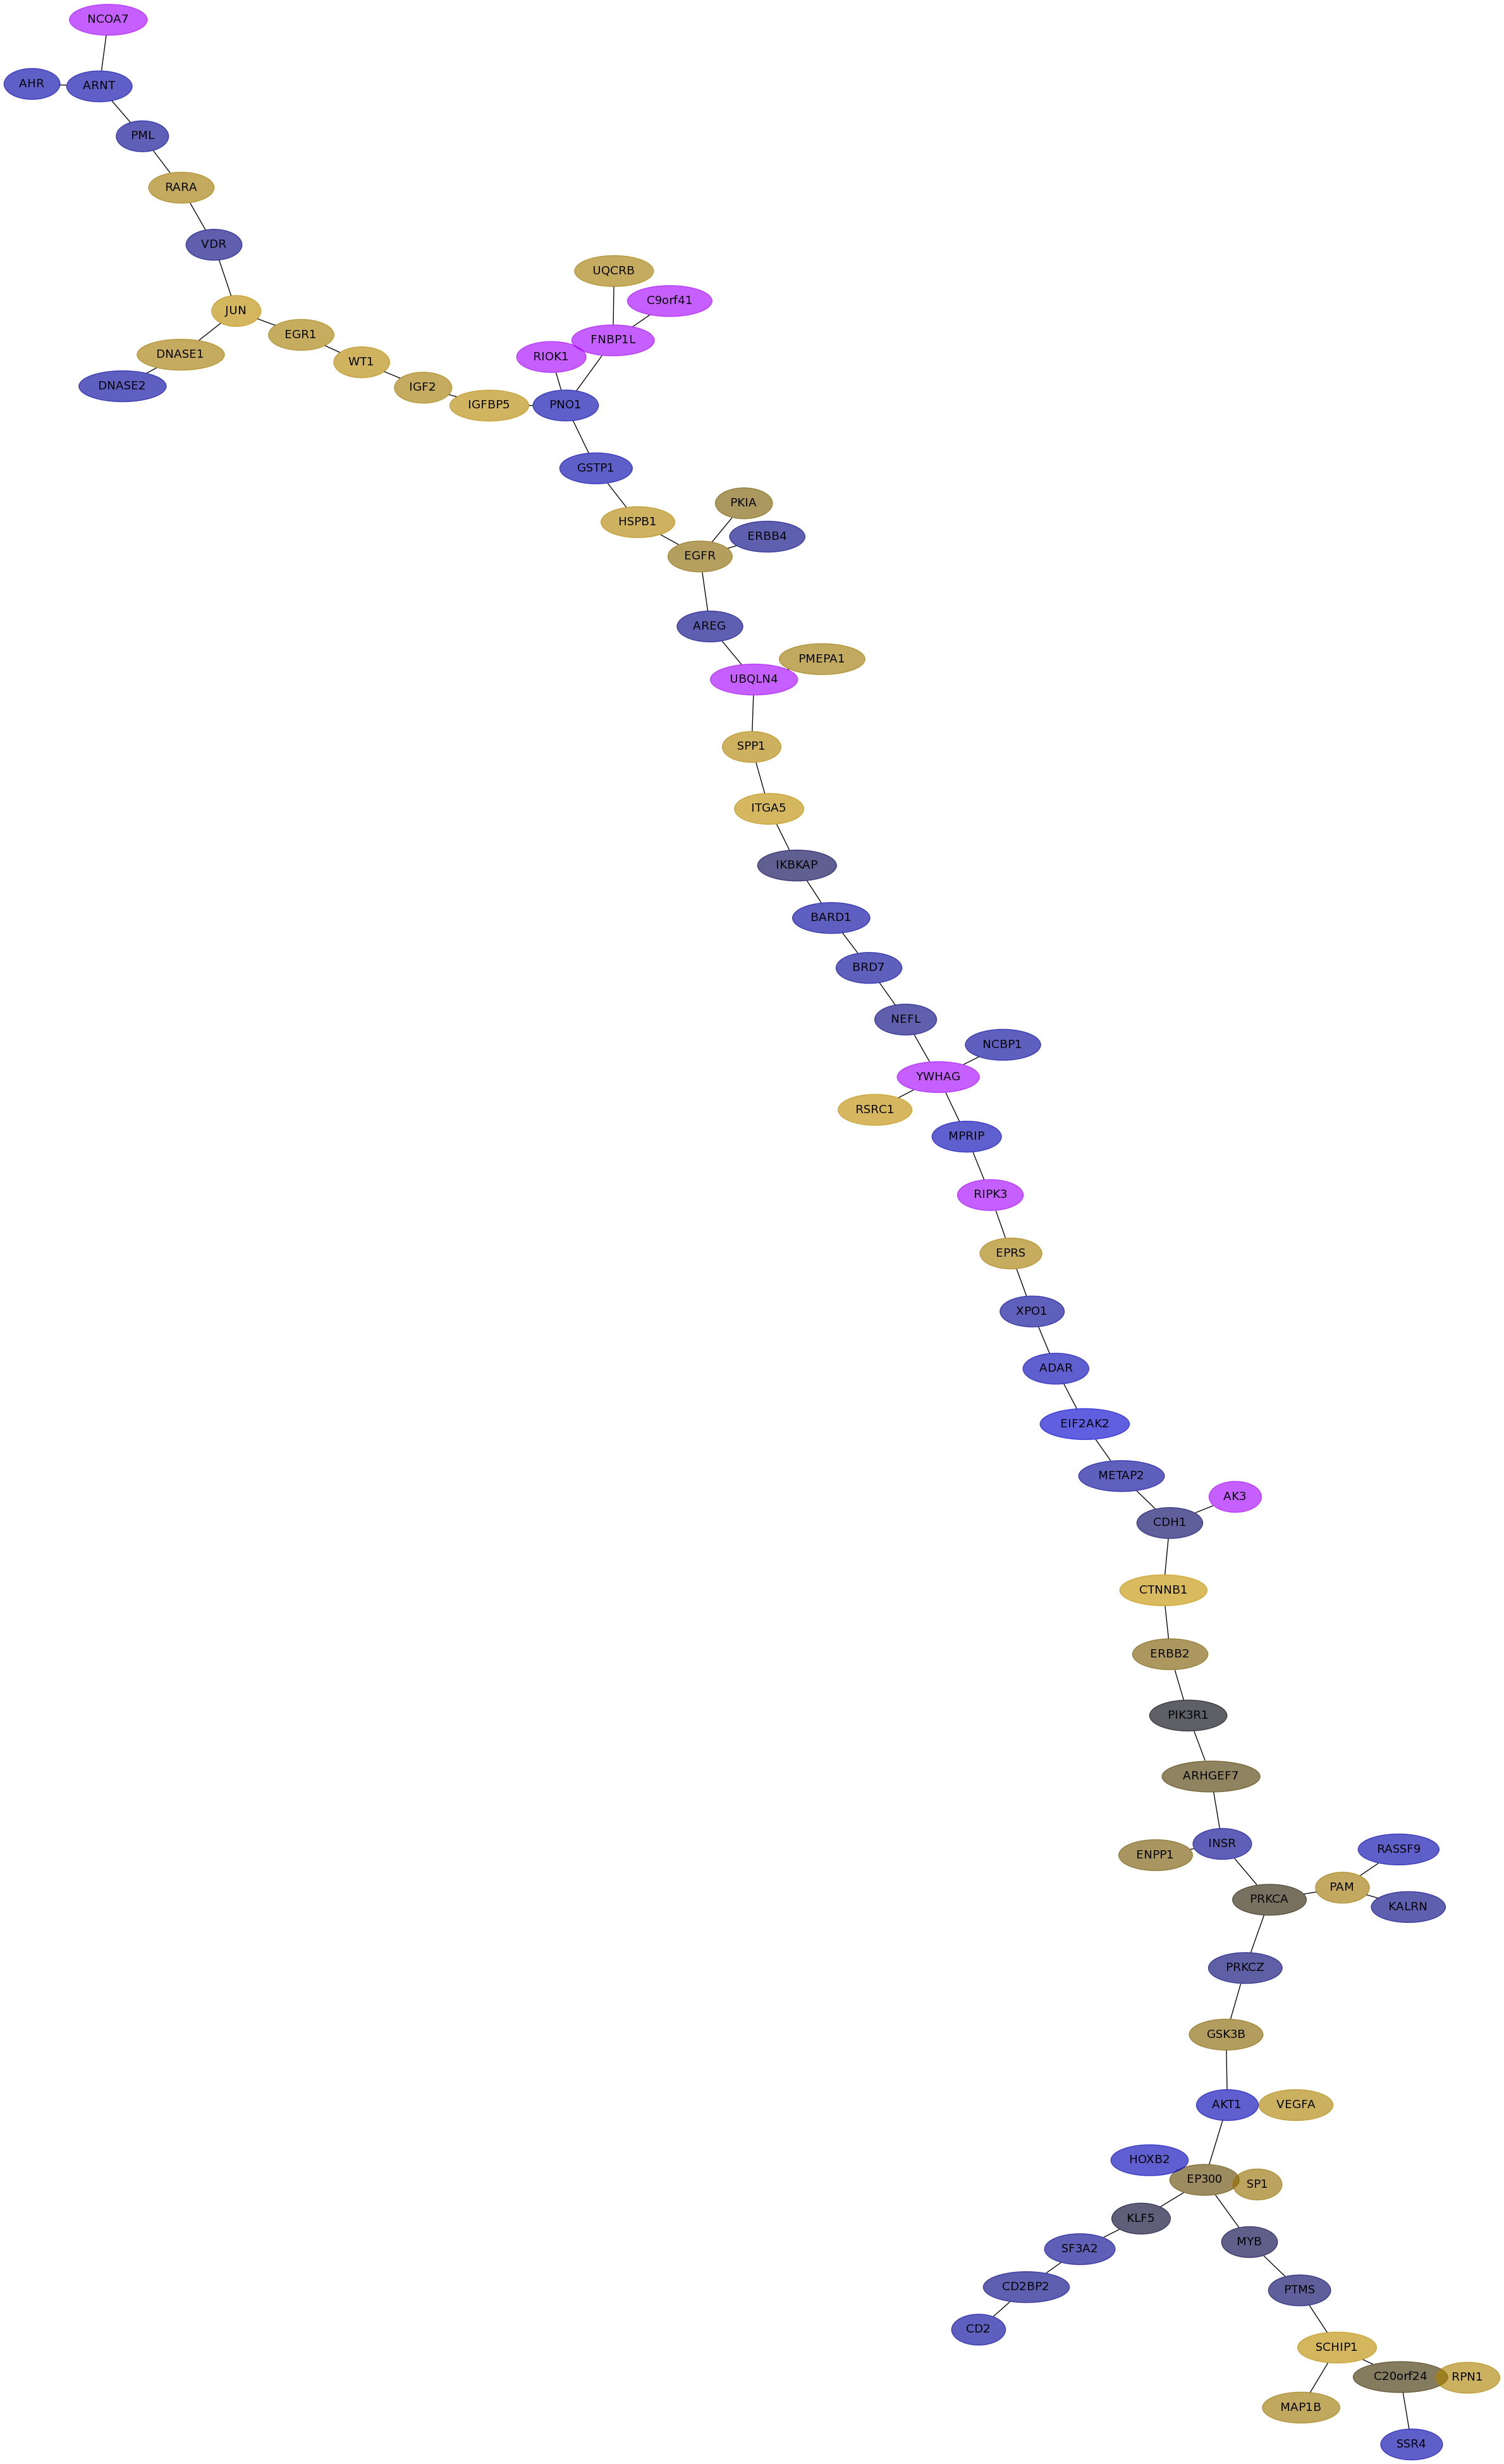
Expression data for subnetwork 6831 in each dataset
IPC |
Loi |
Schmidt |
VanDeVijver |
Wang |
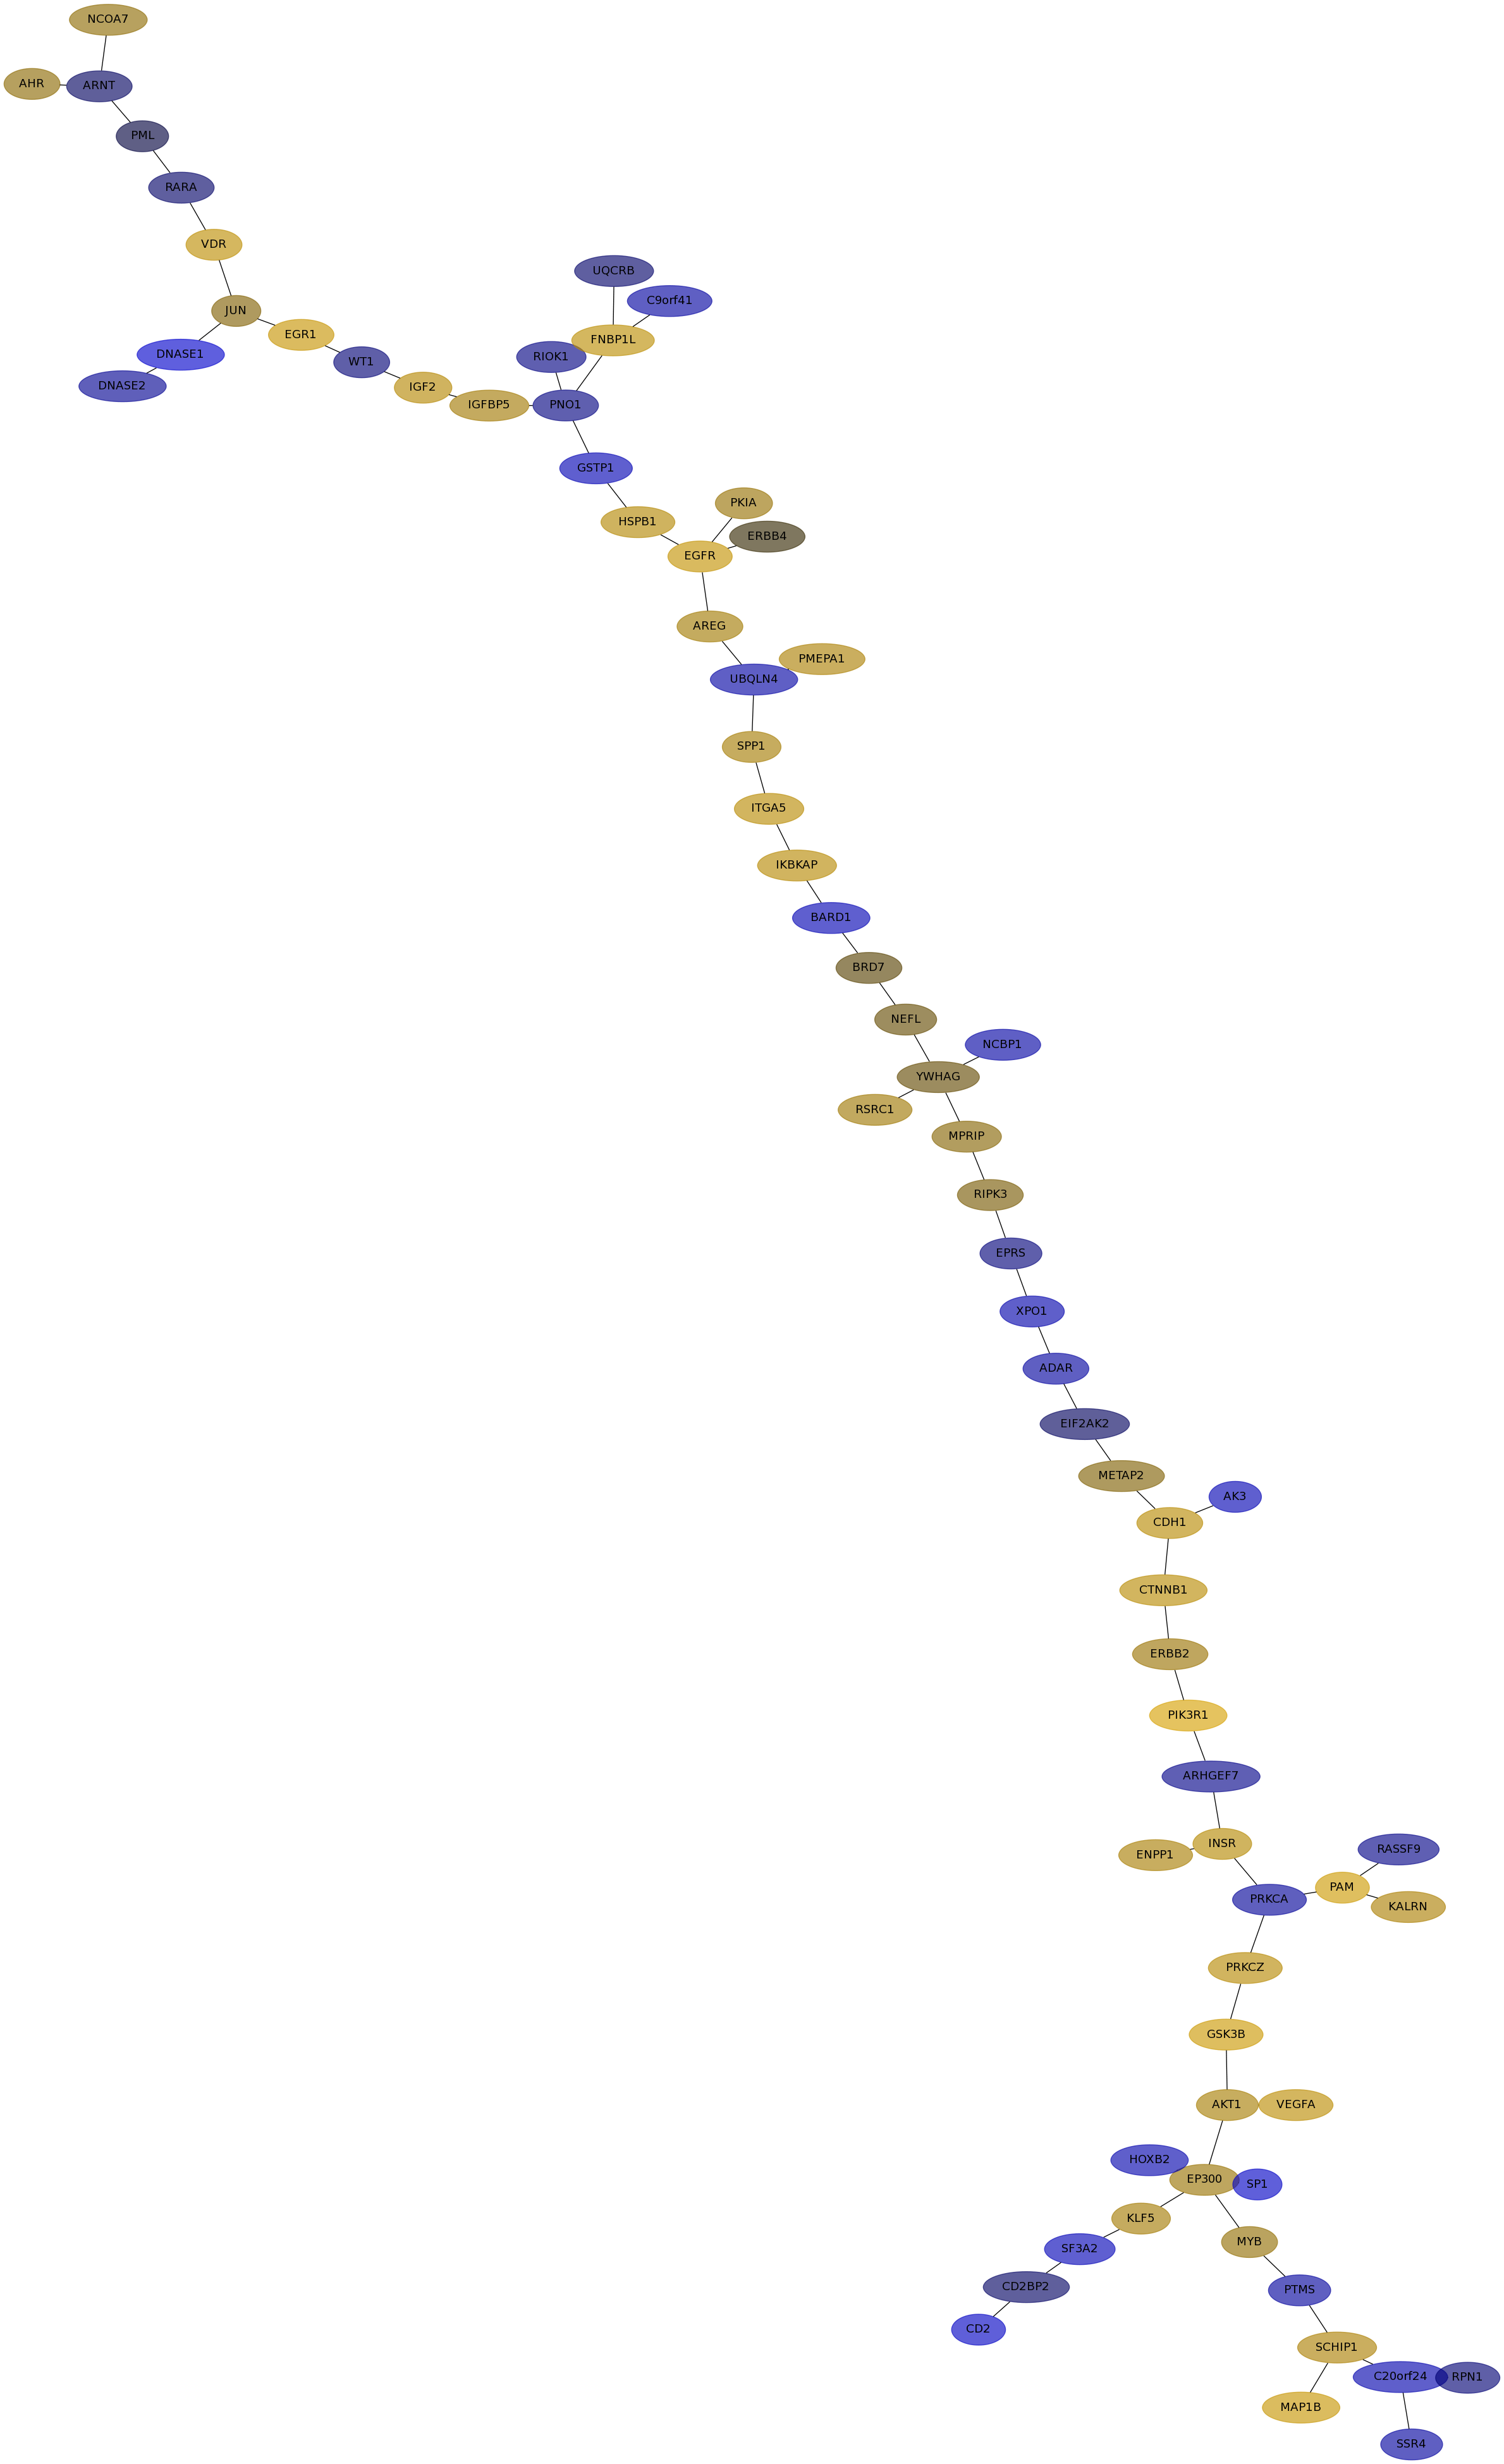
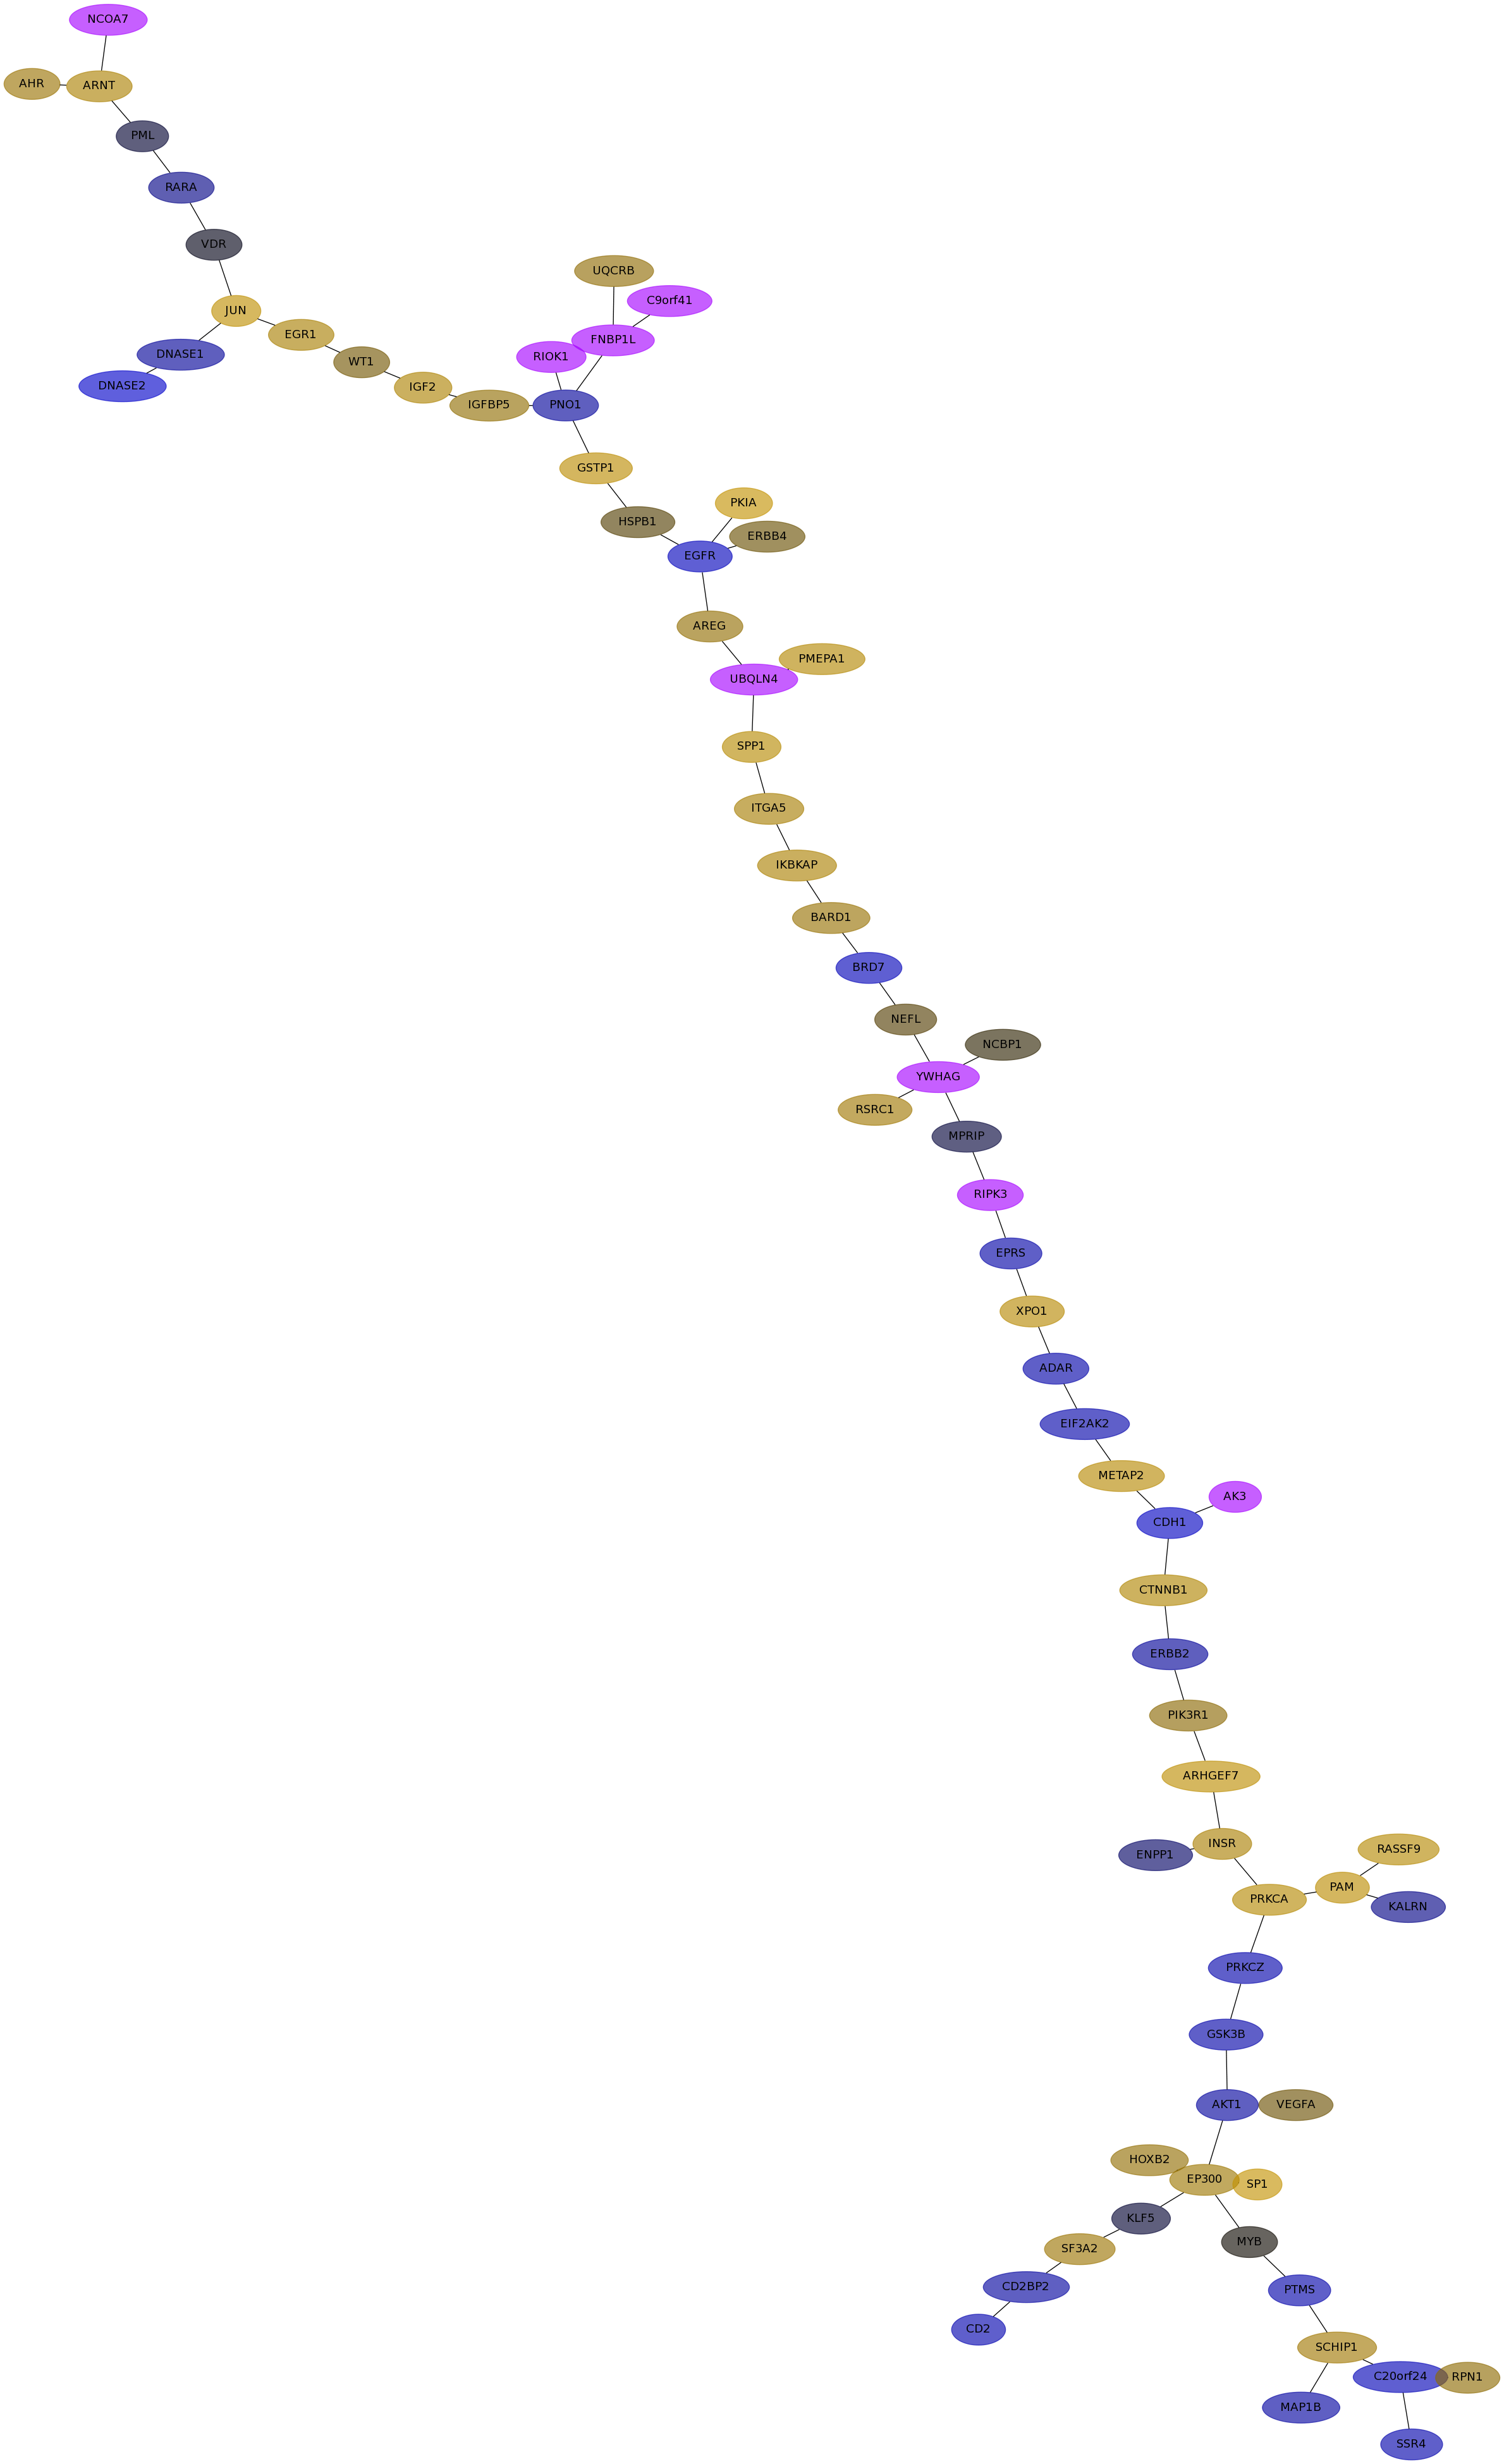
Subnetwork structure for each dataset
- IPC
Score for each gene in subnetwork 6831 in each dataset
| Gene Symbol | Links | Frequency | Frequency Rank | Subnetwork score rank | Global rank |
IPC | Loi | Schmidt | VanDeVijver | Wang |
|---|
| EP300 |   | 113 | 4 | 1 | 4 | -0.149 | 0.087 | 0.102 | 0.052 | 0.025 |
|---|
| PTMS | | 2 | 743 | 1294 | 1286 | 0.058 | -0.101 | -0.136 | undef | -0.025 |
|---|
| UQCRB | | 2 | 743 | 1294 | 1286 | 0.062 | -0.029 | 0.072 | 0.086 | 0.115 |
|---|
| ERBB2 | | 141 | 1 | 1 | 1 | -0.103 | 0.092 | -0.090 | 0.267 | 0.046 |
|---|
| PRKCA | | 63 | 15 | 1 | 10 | -0.016 | -0.088 | 0.174 | 0.095 | 0.005 |
|---|
| BARD1 | | 69 | 12 | 141 | 132 | 0.179 | -0.165 | 0.086 | 0.245 | -0.104 |
|---|
| ERBB4 | | 3 | 557 | 1294 | 1276 | 0.078 | 0.008 | 0.029 | -0.063 | -0.053 |
|---|
| EIF2AK2 | | 9 | 196 | 648 | 629 | 0.023 | -0.022 | -0.134 | 0.096 | -0.303 |
|---|
| CDH1 | | 37 | 32 | 296 | 278 | -0.227 | 0.187 | -0.236 | 0.137 | -0.024 |
|---|
| CTNNB1 | | 43 | 25 | 83 | 81 | -0.113 | 0.187 | 0.159 | -0.090 | 0.239 |
|---|
| C20orf24 | | 1 | 1195 | 1294 | 1316 | 0.041 | -0.145 | -0.184 | 0.047 | 0.010 |
|---|
| ADAR | | 2 | 743 | 1294 | 1286 | 0.154 | -0.104 | -0.127 | 0.174 | -0.169 |
|---|
| METAP2 | | 2 | 743 | 1294 | 1286 | 0.067 | 0.050 | 0.177 | undef | -0.085 |
|---|
| UBQLN4 | | 4 | 440 | 696 | 689 | 0.143 | -0.114 | undef | -0.213 | undef |
|---|
| DNASE1 | | 4 | 440 | 590 | 585 | 0.165 | -0.301 | -0.088 | -0.078 | 0.114 |
|---|
| RARA | | 1 | 1195 | 1294 | 1316 | 0.024 | -0.028 | -0.056 | -0.031 | 0.110 |
|---|
| AKT1 | | 16 | 104 | 236 | 227 | 0.045 | 0.126 | -0.099 | undef | -0.168 |
|---|
| KALRN | | 4 | 440 | 1102 | 1080 | 0.090 | 0.136 | -0.057 | 0.202 | -0.053 |
|---|
| VEGFA | | 68 | 14 | 83 | 78 | 0.090 | 0.200 | 0.030 | 0.095 | 0.148 |
|---|
| CD2BP2 | | 1 | 1195 | 1294 | 1316 | 0.229 | -0.024 | -0.104 | -0.126 | -0.058 |
|---|
| YWHAG | | 24 | 62 | 296 | 279 | 0.067 | 0.024 | undef | 0.266 | undef |
|---|
| VDR | | 3 | 557 | 1141 | 1129 | 0.086 | 0.208 | -0.003 | -0.051 | -0.046 |
|---|
| ENPP1 | | 5 | 360 | 1055 | 1034 | 0.088 | 0.129 | -0.026 | undef | 0.039 |
|---|
| XPO1 | | 2 | 743 | 1294 | 1286 | 0.031 | -0.140 | 0.179 | 0.061 | -0.082 |
|---|
| MPRIP | | 1 | 1195 | 1294 | 1316 | -0.077 | 0.056 | -0.009 | undef | -0.166 |
|---|
| AREG | | 5 | 360 | 1141 | 1109 | -0.067 | 0.112 | 0.076 | -0.173 | -0.054 |
|---|
| NCOA7 | | 1 | 1195 | 1294 | 1316 | 0.035 | 0.069 | undef | undef | undef |
|---|
| PRKCZ | | 2 | 743 | 236 | 272 | undef | 0.180 | -0.141 | -0.038 | -0.036 |
|---|
| PAM | | 10 | 167 | 638 | 621 | -0.035 | 0.307 | 0.200 | 0.002 | 0.104 |
|---|
| GSK3B | | 79 | 8 | 179 | 169 | -0.130 | 0.292 | -0.129 | 0.291 | 0.057 |
|---|
| RIOK1 | | 1 | 1195 | 1294 | 1316 | 0.115 | -0.054 | undef | undef | undef |
|---|
| KLF5 | | 76 | 9 | 1 | 7 | 0.077 | 0.117 | -0.007 | -0.110 | -0.006 |
|---|
| HSPB1 | | 22 | 69 | 1 | 25 | 0.053 | 0.169 | 0.017 | 0.179 | 0.161 |
|---|
| ARNT | | 4 | 440 | 1203 | 1184 | 0.221 | -0.023 | 0.140 | 0.122 | -0.124 |
|---|
| EGR1 | | 39 | 29 | 1 | 18 | -0.184 | 0.259 | 0.130 | 0.018 | 0.122 |
|---|
| RASSF9 | | 4 | 440 | 1102 | 1080 | 0.156 | -0.058 | 0.173 | 0.122 | -0.133 |
|---|
| ARHGEF7 | | 25 | 59 | 83 | 92 | -0.074 | -0.061 | 0.208 | 0.028 | 0.015 |
|---|
| C9orf41 | | 2 | 743 | 1294 | 1286 | 0.100 | -0.105 | undef | undef | undef |
|---|
| IKBKAP | | 10 | 167 | 412 | 408 | 0.089 | 0.184 | 0.142 | 0.105 | -0.017 |
|---|
| SSR4 | | 1 | 1195 | 1294 | 1316 | 0.148 | -0.104 | -0.142 | -0.061 | -0.135 |
|---|
| GSTP1 | | 14 | 117 | 1 | 34 | 0.222 | -0.166 | 0.201 | 0.126 | -0.136 |
|---|
| RSRC1 | | 21 | 73 | 366 | 354 | 0.023 | 0.104 | 0.105 | -0.098 | 0.212 |
|---|
| HOXB2 | | 33 | 37 | 318 | 289 | 0.024 | -0.143 | 0.076 | 0.247 | -0.184 |
|---|
| PNO1 | | 3 | 557 | 1010 | 1001 | 0.090 | -0.052 | -0.092 | -0.048 | -0.138 |
|---|
| CD2 | | 1 | 1195 | 1294 | 1316 | 0.032 | -0.244 | -0.150 | -0.174 | -0.097 |
|---|
| JUN | | 26 | 52 | 179 | 177 | 0.200 | 0.051 | 0.220 | undef | 0.200 |
|---|
| SPP1 | | 26 | 52 | 83 | 91 | 0.130 | 0.119 | 0.184 | 0.204 | 0.153 |
|---|
| RPN1 | | 1 | 1195 | 1294 | 1316 | 0.091 | -0.037 | 0.068 | 0.054 | 0.147 |
|---|
| NEFL | | 1 | 1195 | 1294 | 1316 | -0.051 | 0.026 | 0.016 | 0.180 | -0.050 |
|---|
| SCHIP1 | | 10 | 167 | 478 | 459 | 0.130 | 0.136 | 0.105 | -0.022 | 0.198 |
|---|
| WT1 | | 33 | 37 | 1 | 21 | 0.254 | -0.039 | 0.036 | undef | 0.172 |
|---|
| BRD7 | | 23 | 66 | 457 | 437 | -0.090 | 0.019 | -0.188 | undef | -0.086 |
|---|
| AK3 | | 1 | 1195 | 1294 | 1316 | 0.136 | -0.170 | undef | undef | undef |
|---|
| SP1 | | 72 | 10 | 83 | 77 | 0.222 | -0.254 | 0.239 | 0.020 | 0.082 |
|---|
| MYB | | 28 | 47 | 366 | 344 | -0.028 | 0.075 | 0.002 | 0.065 | -0.012 |
|---|
| RIPK3 | | 19 | 85 | 179 | 186 | -0.014 | 0.040 | undef | 0.173 | undef |
|---|
| PIK3R1 | | 127 | 2 | 1 | 2 | -0.237 | 0.381 | 0.065 | undef | -0.002 |
|---|
| ITGA5 | | 26 | 52 | 179 | 177 | 0.031 | 0.192 | 0.125 | 0.133 | 0.202 |
|---|
| DNASE2 | | 1 | 1195 | 1294 | 1316 | 0.041 | -0.078 | -0.283 | -0.021 | -0.101 |
|---|
| SF3A2 | | 3 | 557 | 1203 | 1187 | 0.038 | -0.181 | 0.094 | -0.172 | -0.067 |
|---|
| EGFR | | 117 | 3 | 1 | 3 | -0.195 | 0.240 | -0.205 | -0.187 | 0.065 |
|---|
| MAP1B | | 69 | 12 | 1 | 9 | -0.123 | 0.263 | -0.107 | 0.304 | 0.100 |
|---|
| EPRS | | 2 | 743 | 1116 | 1121 | 0.043 | -0.045 | -0.125 | 0.152 | 0.120 |
|---|
| NCBP1 | | 3 | 557 | 1294 | 1276 | 0.027 | -0.115 | 0.006 | -0.024 | -0.093 |
|---|
| INSR | | 96 | 6 | 236 | 221 | 0.063 | 0.173 | 0.135 | -0.014 | -0.072 |
|---|
| PMEPA1 | | 3 | 557 | 1294 | 1276 | -0.085 | 0.137 | 0.167 | 0.087 | 0.102 |
|---|
| IGFBP5 | | 48 | 23 | 83 | 80 | -0.076 | 0.110 | 0.074 | 0.278 | 0.181 |
|---|
| PML | | 6 | 301 | 478 | 473 | -0.068 | -0.010 | -0.007 | -0.153 | -0.070 |
|---|
| FNBP1L | | 3 | 557 | 1294 | 1276 | -0.088 | 0.204 | undef | 0.154 | undef |
|---|
| AHR | | 8 | 222 | 478 | 461 | 0.180 | 0.067 | 0.091 | -0.182 | -0.129 |
|---|
| IGF2 | | 14 | 117 | 570 | 553 | -0.022 | 0.172 | 0.145 | 0.087 | 0.116 |
|---|
| PKIA | | 11 | 148 | 780 | 759 | -0.120 | 0.085 | 0.249 | 0.164 | 0.044 |
|---|
GO Enrichment output for subnetwork 6831 in each dataset
| Name | Accession Number | Link | P-val | Corrected P-val |
|---|
| negative regulation of protein amino acid phosphorylation | GO:0001933 |  | 7.164E-09 | 1.75E-05 |
|---|
| mitochondrial electron transport. ubiquinol to cytochrome c | GO:0006122 | | 1.08E-08 | 1.319E-05 |
|---|
| negative regulation of insulin receptor signaling pathway | GO:0046627 | | 2.51E-08 | 2.044E-05 |
|---|
| cellular response to insulin stimulus | GO:0032869 | | 4.549E-08 | 2.778E-05 |
|---|
| induction of positive chemotaxis | GO:0050930 | | 8.962E-08 | 4.379E-05 |
|---|
| negative regulation of phosphorylation | GO:0042326 | | 1.458E-07 | 5.935E-05 |
|---|
| regulation of insulin receptor signaling pathway | GO:0046626 | | 1.488E-07 | 5.192E-05 |
|---|
| response to insulin stimulus | GO:0032868 | | 1.701E-07 | 5.196E-05 |
|---|
| negative regulation of phosphorus metabolic process | GO:0010563 | | 2.237E-07 | 6.072E-05 |
|---|
| Wnt receptor signaling pathway through beta-catenin | GO:0060070 | | 2.328E-07 | 5.688E-05 |
|---|
| negative regulation of glucose import | GO:0046325 | | 2.328E-07 | 5.17E-05 |
|---|
| Name | Accession Number | Link | P-val | Corrected P-val |
|---|
| negative regulation of protein amino acid phosphorylation | GO:0001933 | | 9.491E-09 | 2.284E-05 |
|---|
| mitochondrial electron transport. ubiquinol to cytochrome c | GO:0006122 | | 1.356E-08 | 1.631E-05 |
|---|
| negative regulation of insulin receptor signaling pathway | GO:0046627 | | 3.151E-08 | 2.527E-05 |
|---|
| cellular response to insulin stimulus | GO:0032869 | | 5.356E-08 | 3.221E-05 |
|---|
| induction of positive chemotaxis | GO:0050930 | | 1.124E-07 | 5.411E-05 |
|---|
| Wnt receptor signaling pathway through beta-catenin | GO:0060070 | | 1.866E-07 | 7.483E-05 |
|---|
| regulation of insulin receptor signaling pathway | GO:0046626 | | 1.866E-07 | 6.414E-05 |
|---|
| negative regulation of phosphorylation | GO:0042326 | | 1.927E-07 | 5.795E-05 |
|---|
| response to insulin stimulus | GO:0032868 | | 2.071E-07 | 5.535E-05 |
|---|
| negative regulation of glucose import | GO:0046325 | | 2.92E-07 | 7.024E-05 |
|---|
| insulin receptor signaling pathway | GO:0008286 | | 2.955E-07 | 6.464E-05 |
|---|
| Name | Accession Number | Link | P-val | Corrected P-val |
|---|
| negative regulation of protein amino acid phosphorylation | GO:0001933 | | 1.8E-08 | 4.139E-05 |
|---|
| mitochondrial electron transport. ubiquinol to cytochrome c | GO:0006122 | | 3.24E-08 | 3.727E-05 |
|---|
| negative regulation of insulin receptor signaling pathway | GO:0046627 | | 7.521E-08 | 5.766E-05 |
|---|
| cellular response to insulin stimulus | GO:0032869 | | 1.114E-07 | 6.405E-05 |
|---|
| induction of positive chemotaxis | GO:0050930 | | 1.496E-07 | 6.882E-05 |
|---|
| regulation of insulin receptor signaling pathway | GO:0046626 | | 2.679E-07 | 1.027E-04 |
|---|
| negative regulation of phosphorylation | GO:0042326 | | 4.452E-07 | 1.463E-04 |
|---|
| response to insulin stimulus | GO:0032868 | | 4.799E-07 | 1.38E-04 |
|---|
| insulin receptor signaling pathway | GO:0008286 | | 5.592E-07 | 1.429E-04 |
|---|
| protein amino acid autophosphorylation | GO:0046777 | | 6.34E-07 | 1.458E-04 |
|---|
| regulation of positive chemotaxis | GO:0050926 | | 6.94E-07 | 1.451E-04 |
|---|
VanDeVijver file
| Name | Accession Number | Link | P-val | Corrected P-val |
|---|
| regulation of intracellular protein transport | GO:0033157 | | 1.058E-06 | 1.949E-03 |
|---|
| regulation of nucleocytoplasmic transport | GO:0046822 | | 1.589E-06 | 1.464E-03 |
|---|
| protein amino acid autophosphorylation | GO:0046777 | | 1.923E-06 | 1.181E-03 |
|---|
| regulation of intracellular transport | GO:0032386 | | 3.266E-06 | 1.505E-03 |
|---|
| localization within membrane | GO:0051668 | | 8.495E-06 | 3.131E-03 |
|---|
| regulation of mRNA processing | GO:0050684 | | 1.479E-05 | 4.542E-03 |
|---|
| regulation of T cell differentiation | GO:0045580 | | 4.139E-05 | 0.01089824 |
|---|
| regulation of protein transport | GO:0051223 | | 4.853E-05 | 0.01118067 |
|---|
| negative regulation of nucleocytoplasmic transport | GO:0046823 | | 4.987E-05 | 0.01021239 |
|---|
| positive regulation of nucleocytoplasmic transport | GO:0046824 | | 6.82E-05 | 0.01256904 |
|---|
| positive regulation of nitric oxide biosynthetic process | GO:0045429 | | 6.82E-05 | 0.0114264 |
|---|
| Name | Accession Number | Link | P-val | Corrected P-val |
|---|
| negative regulation of protein amino acid phosphorylation | GO:0001933 | | 1.8E-08 | 4.139E-05 |
|---|
| mitochondrial electron transport. ubiquinol to cytochrome c | GO:0006122 | | 3.24E-08 | 3.727E-05 |
|---|
| negative regulation of insulin receptor signaling pathway | GO:0046627 | | 7.521E-08 | 5.766E-05 |
|---|
| cellular response to insulin stimulus | GO:0032869 | | 1.114E-07 | 6.405E-05 |
|---|
| induction of positive chemotaxis | GO:0050930 | | 1.496E-07 | 6.882E-05 |
|---|
| regulation of insulin receptor signaling pathway | GO:0046626 | | 2.679E-07 | 1.027E-04 |
|---|
| negative regulation of phosphorylation | GO:0042326 | | 4.452E-07 | 1.463E-04 |
|---|
| response to insulin stimulus | GO:0032868 | | 4.799E-07 | 1.38E-04 |
|---|
| insulin receptor signaling pathway | GO:0008286 | | 5.592E-07 | 1.429E-04 |
|---|
| protein amino acid autophosphorylation | GO:0046777 | | 6.34E-07 | 1.458E-04 |
|---|
| regulation of positive chemotaxis | GO:0050926 | | 6.94E-07 | 1.451E-04 |
|---|

