Study Desmedt-ER-neg
Study informations
165 subnetworks in total page | file
2310 genes associated page | file
Enriched GO terms page
General informations
General Index page
Study Index page
Subnetwork 6682
score
| Dataset | Score | P-val 1 | P-val 2 | P-val 3 | Fisher Score |
|---|
| IPC | 0.7518 | 3.647e-03 | 6.000e-04 | 7.759e-01 | 1.698e-06 |
|---|
| Loi | 0.2310 | 7.917e-02 | 1.107e-02 | 4.255e-01 | 3.730e-04 |
|---|
| Schmidt | 0.6742 | 0.000e+00 | 0.000e+00 | 4.408e-02 | 0.000e+00 |
|---|
| VanDeVijver | 0.7909 | 0.000e+00 | 0.000e+00 | 3.454e-03 | 0.000e+00 |
|---|
| Wang | 0.2627 | 2.535e-03 | 4.250e-02 | 3.901e-01 | 4.203e-05 |
|---|
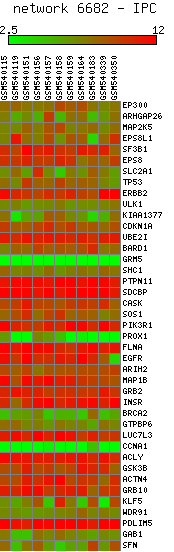
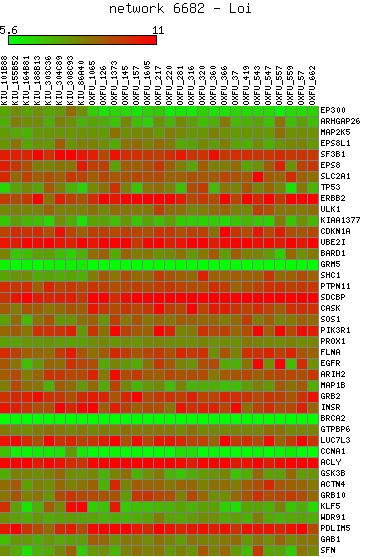
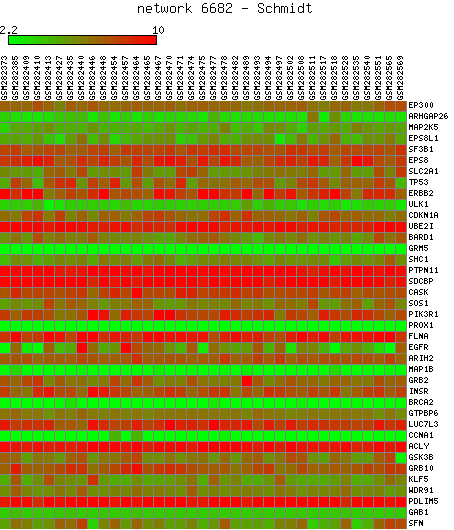
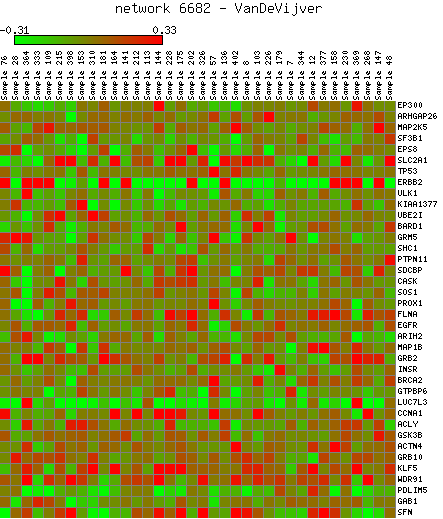
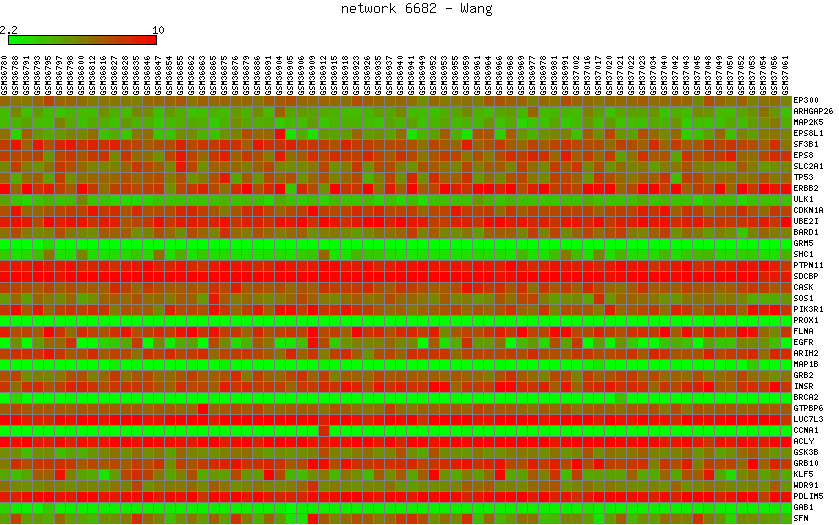
Expression data for subnetwork 6682 in each dataset
IPC |
Loi |
Schmidt |
VanDeVijver |
Wang |
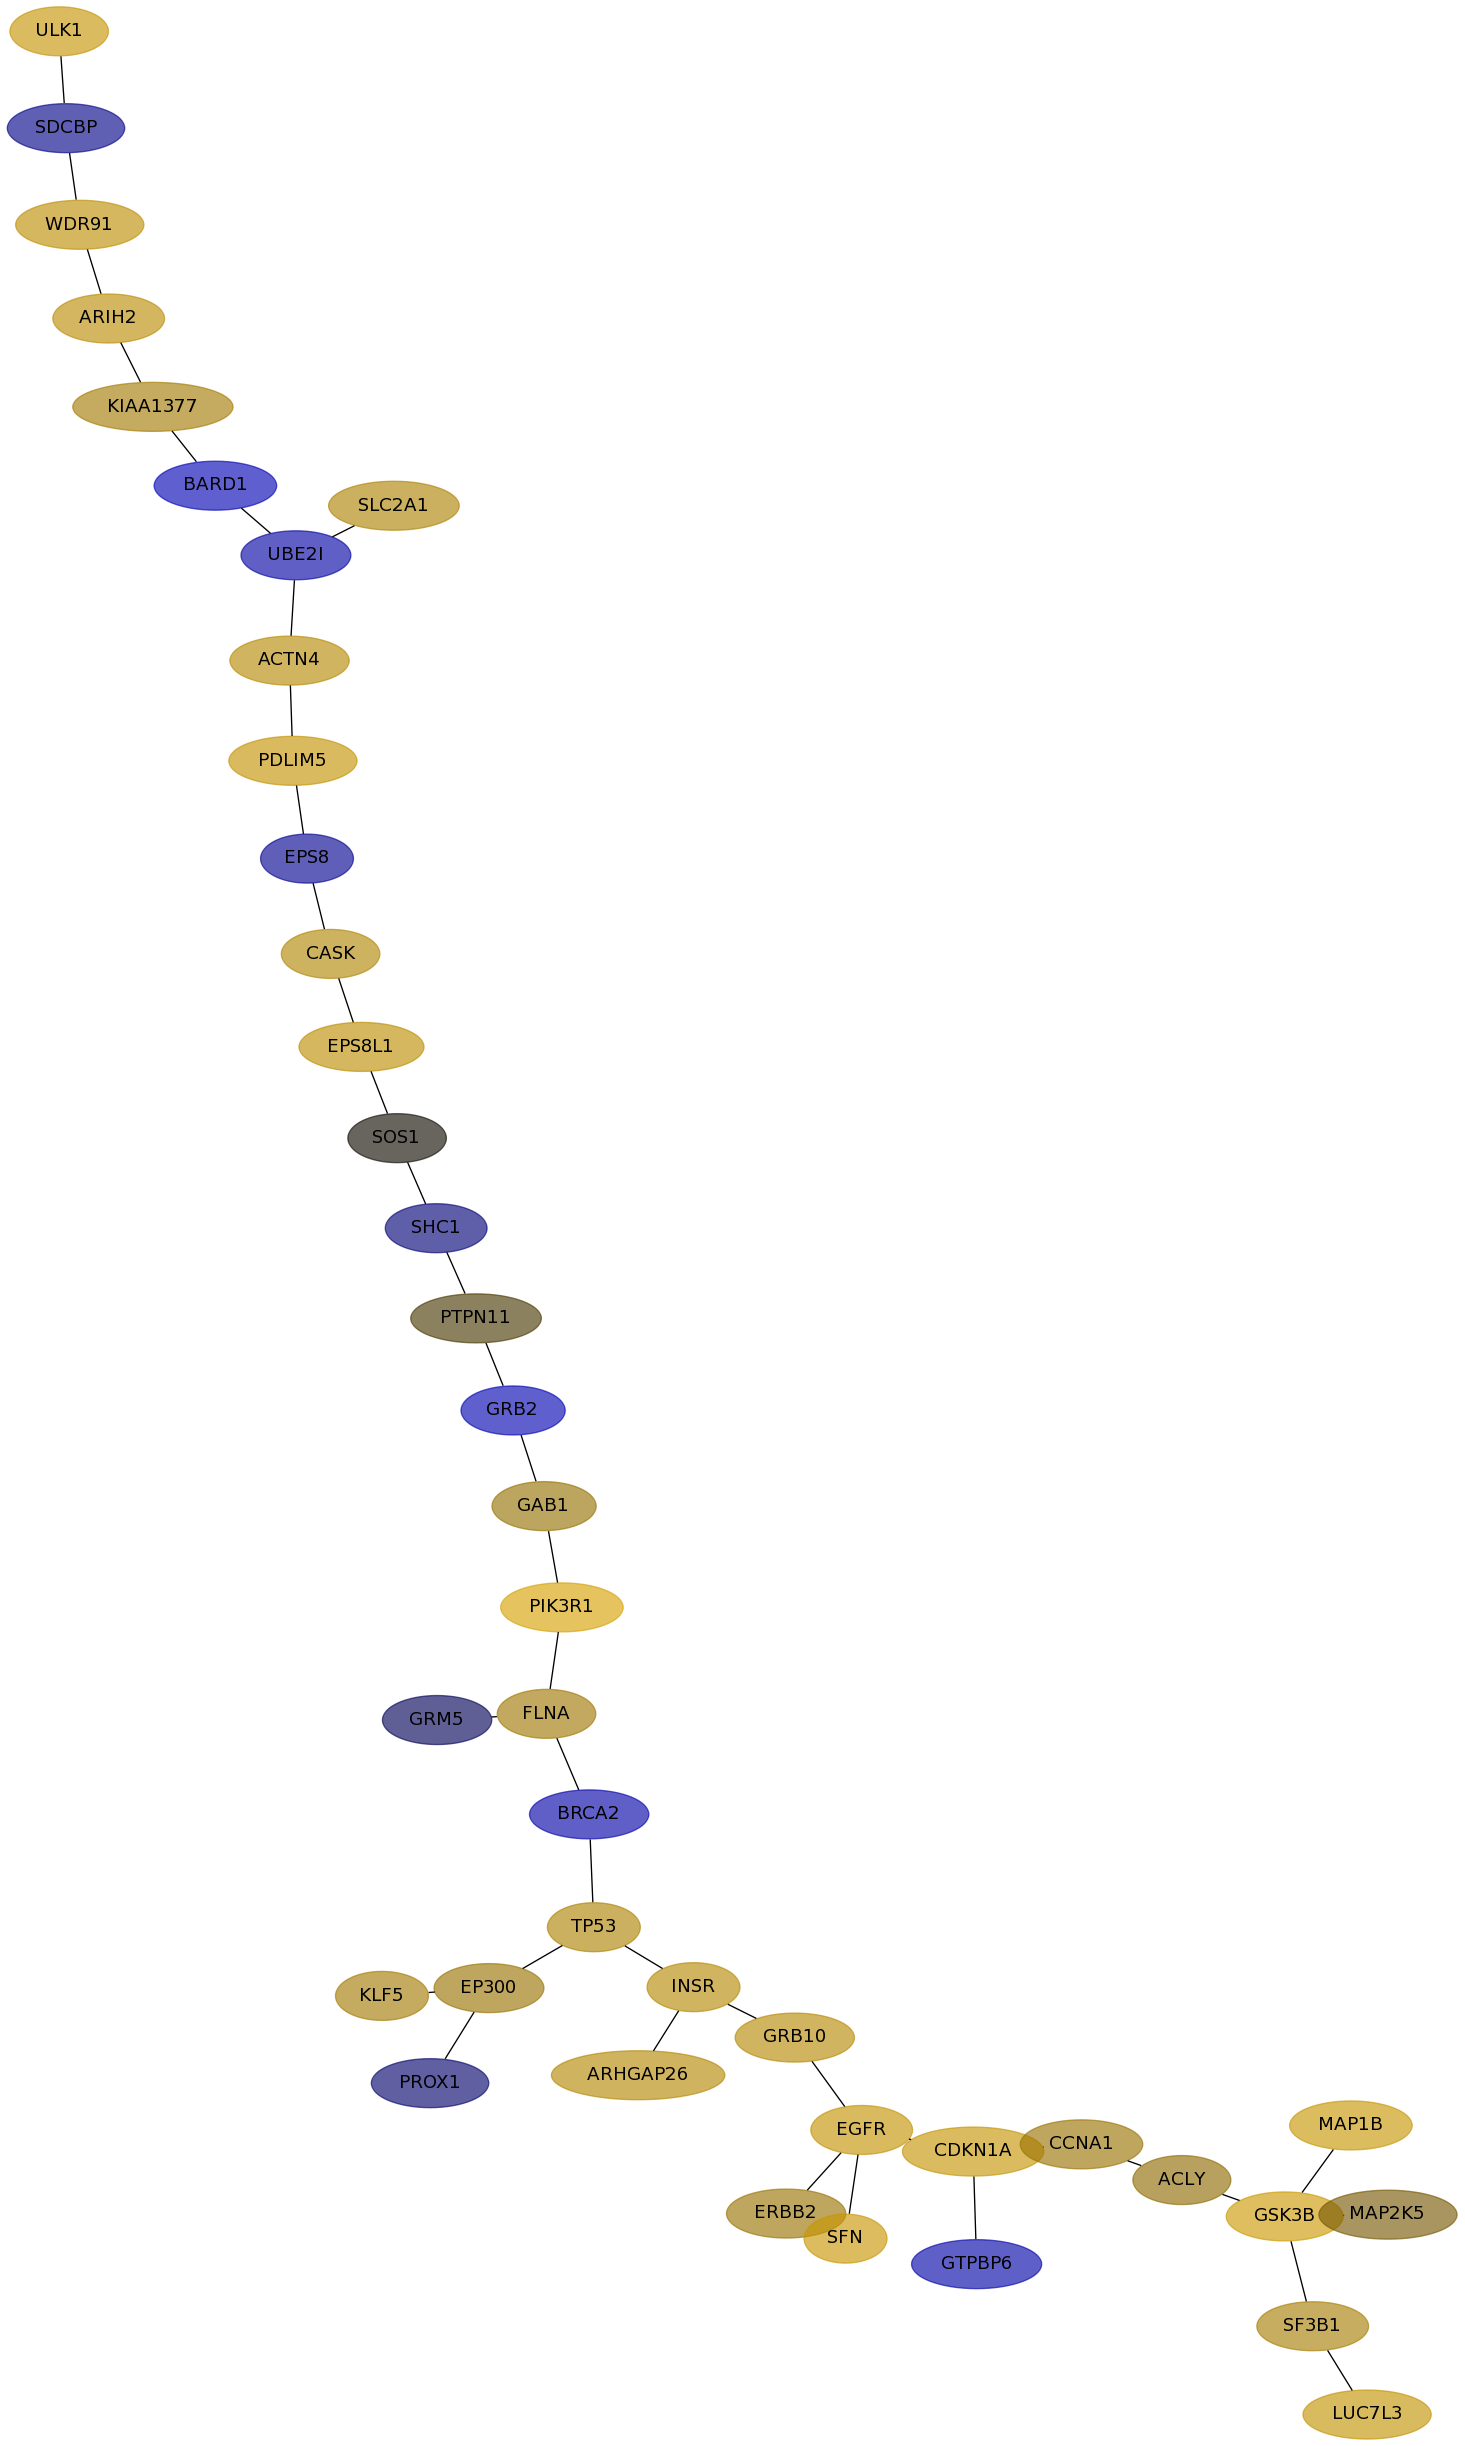
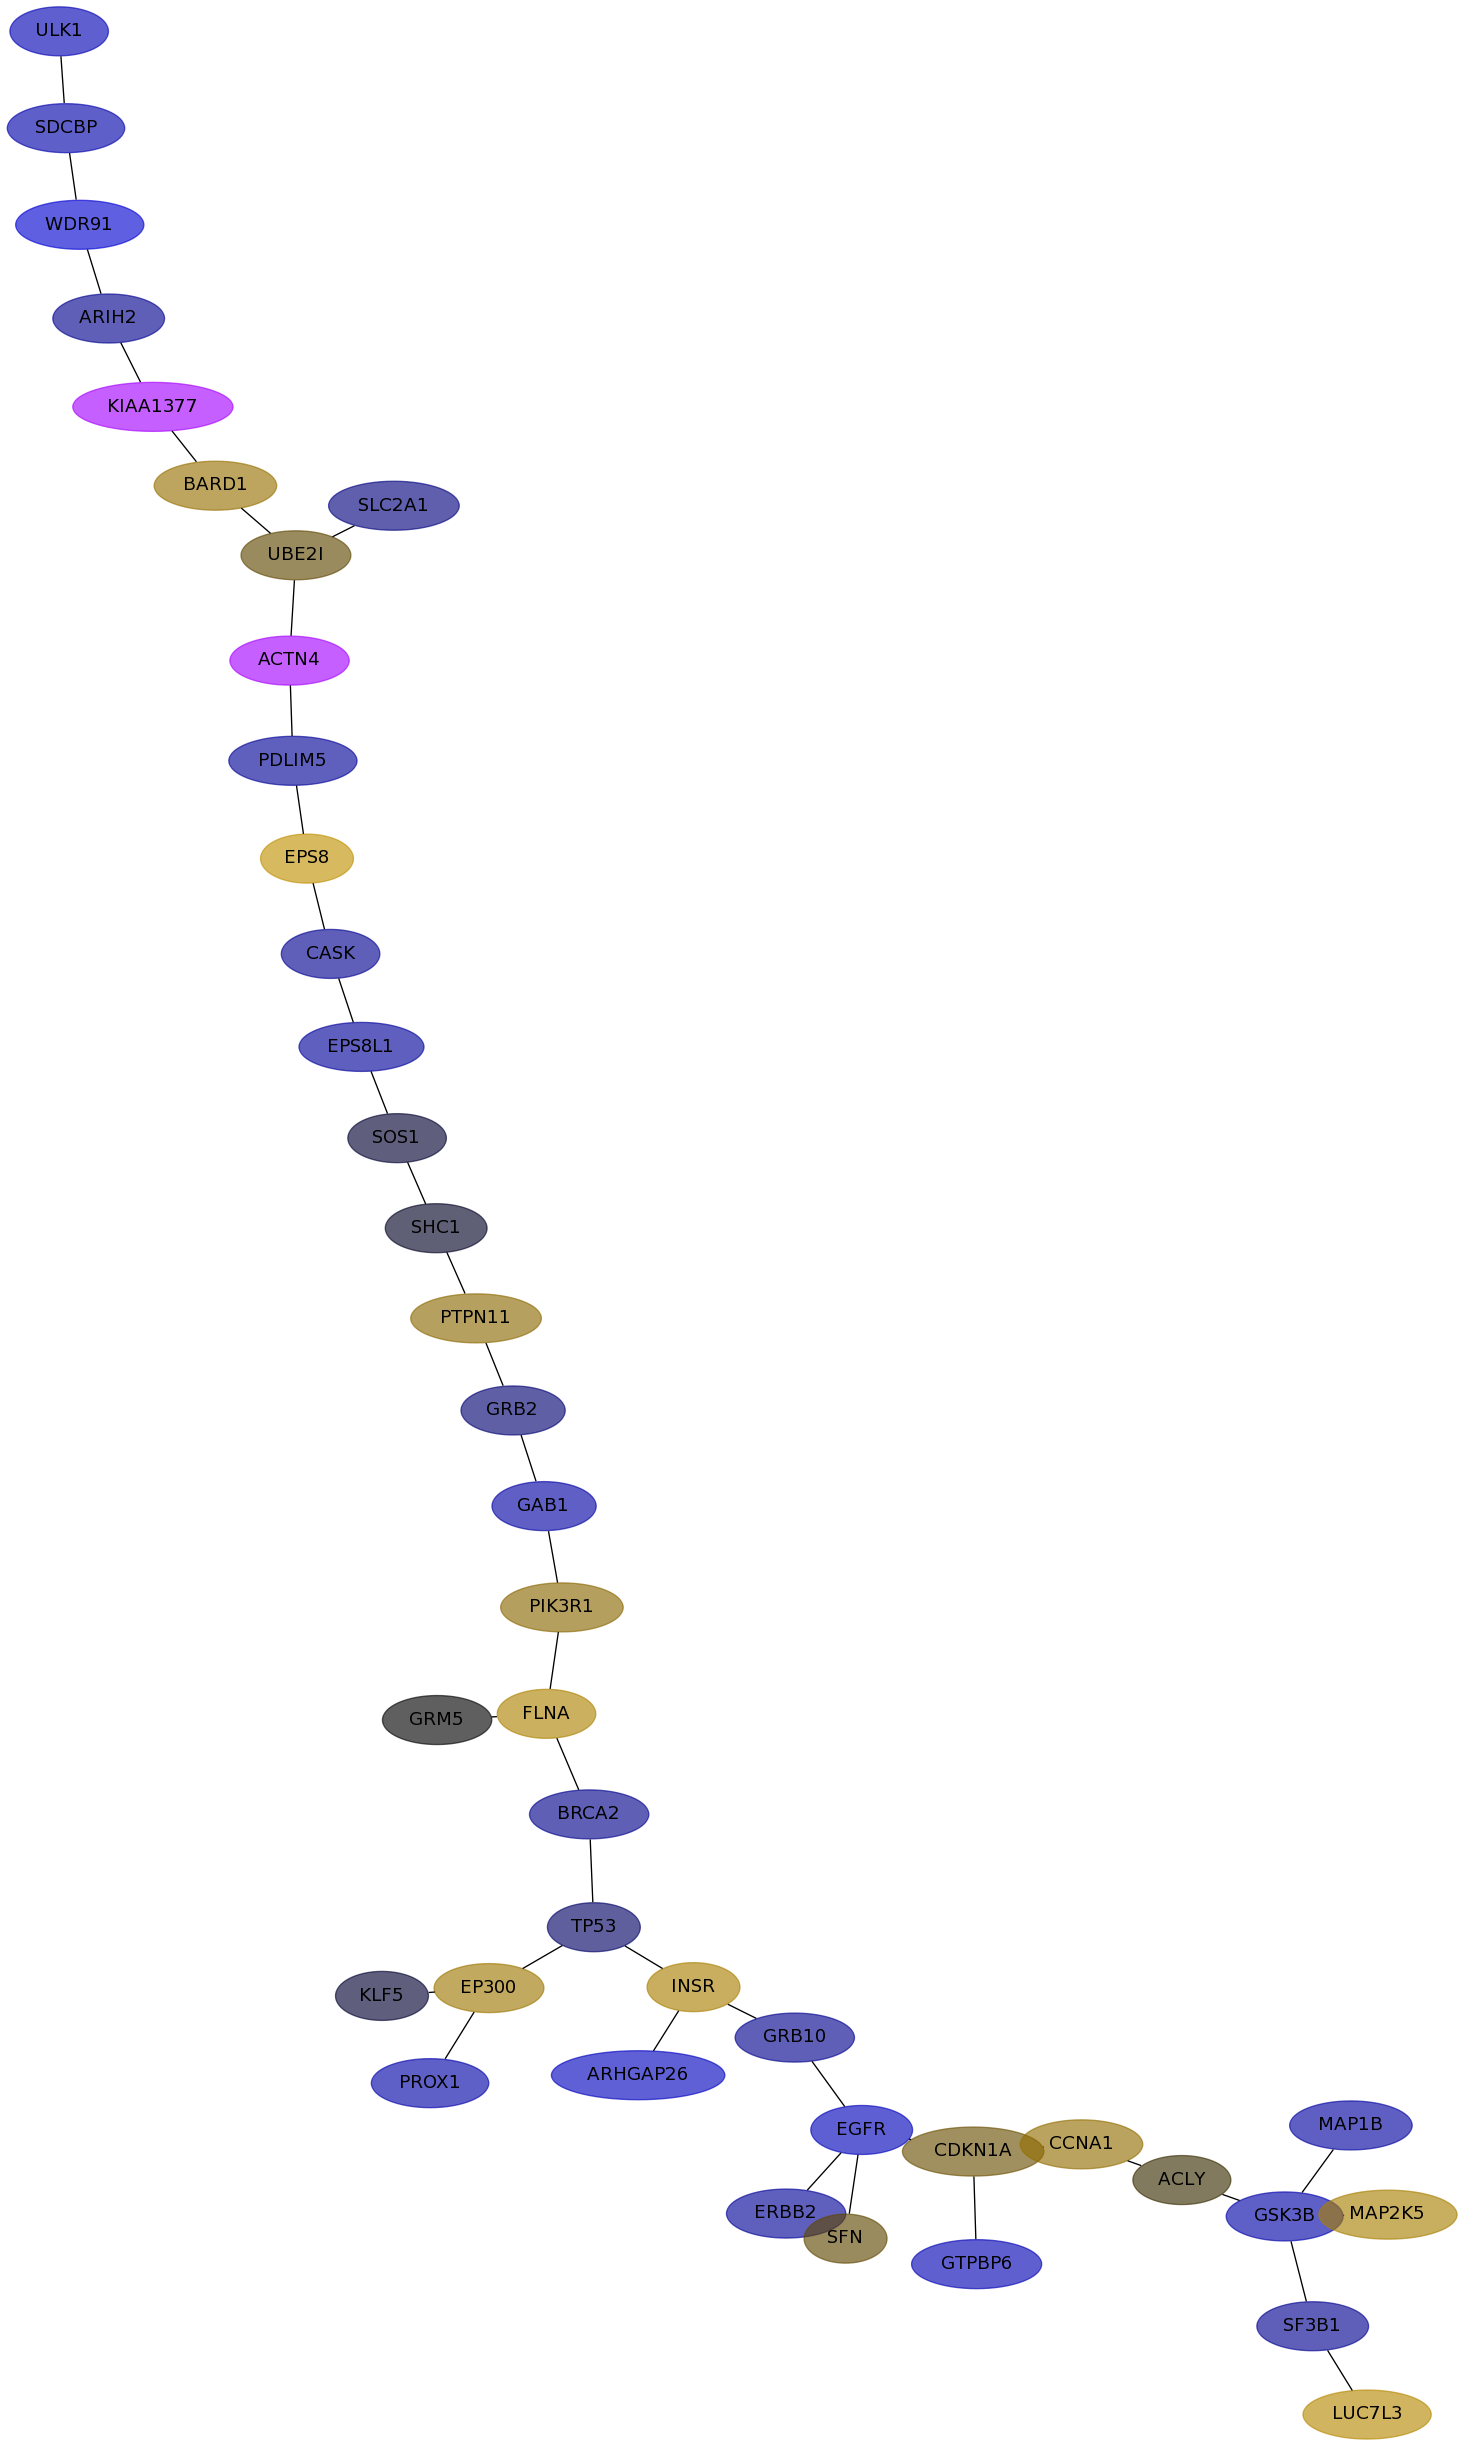
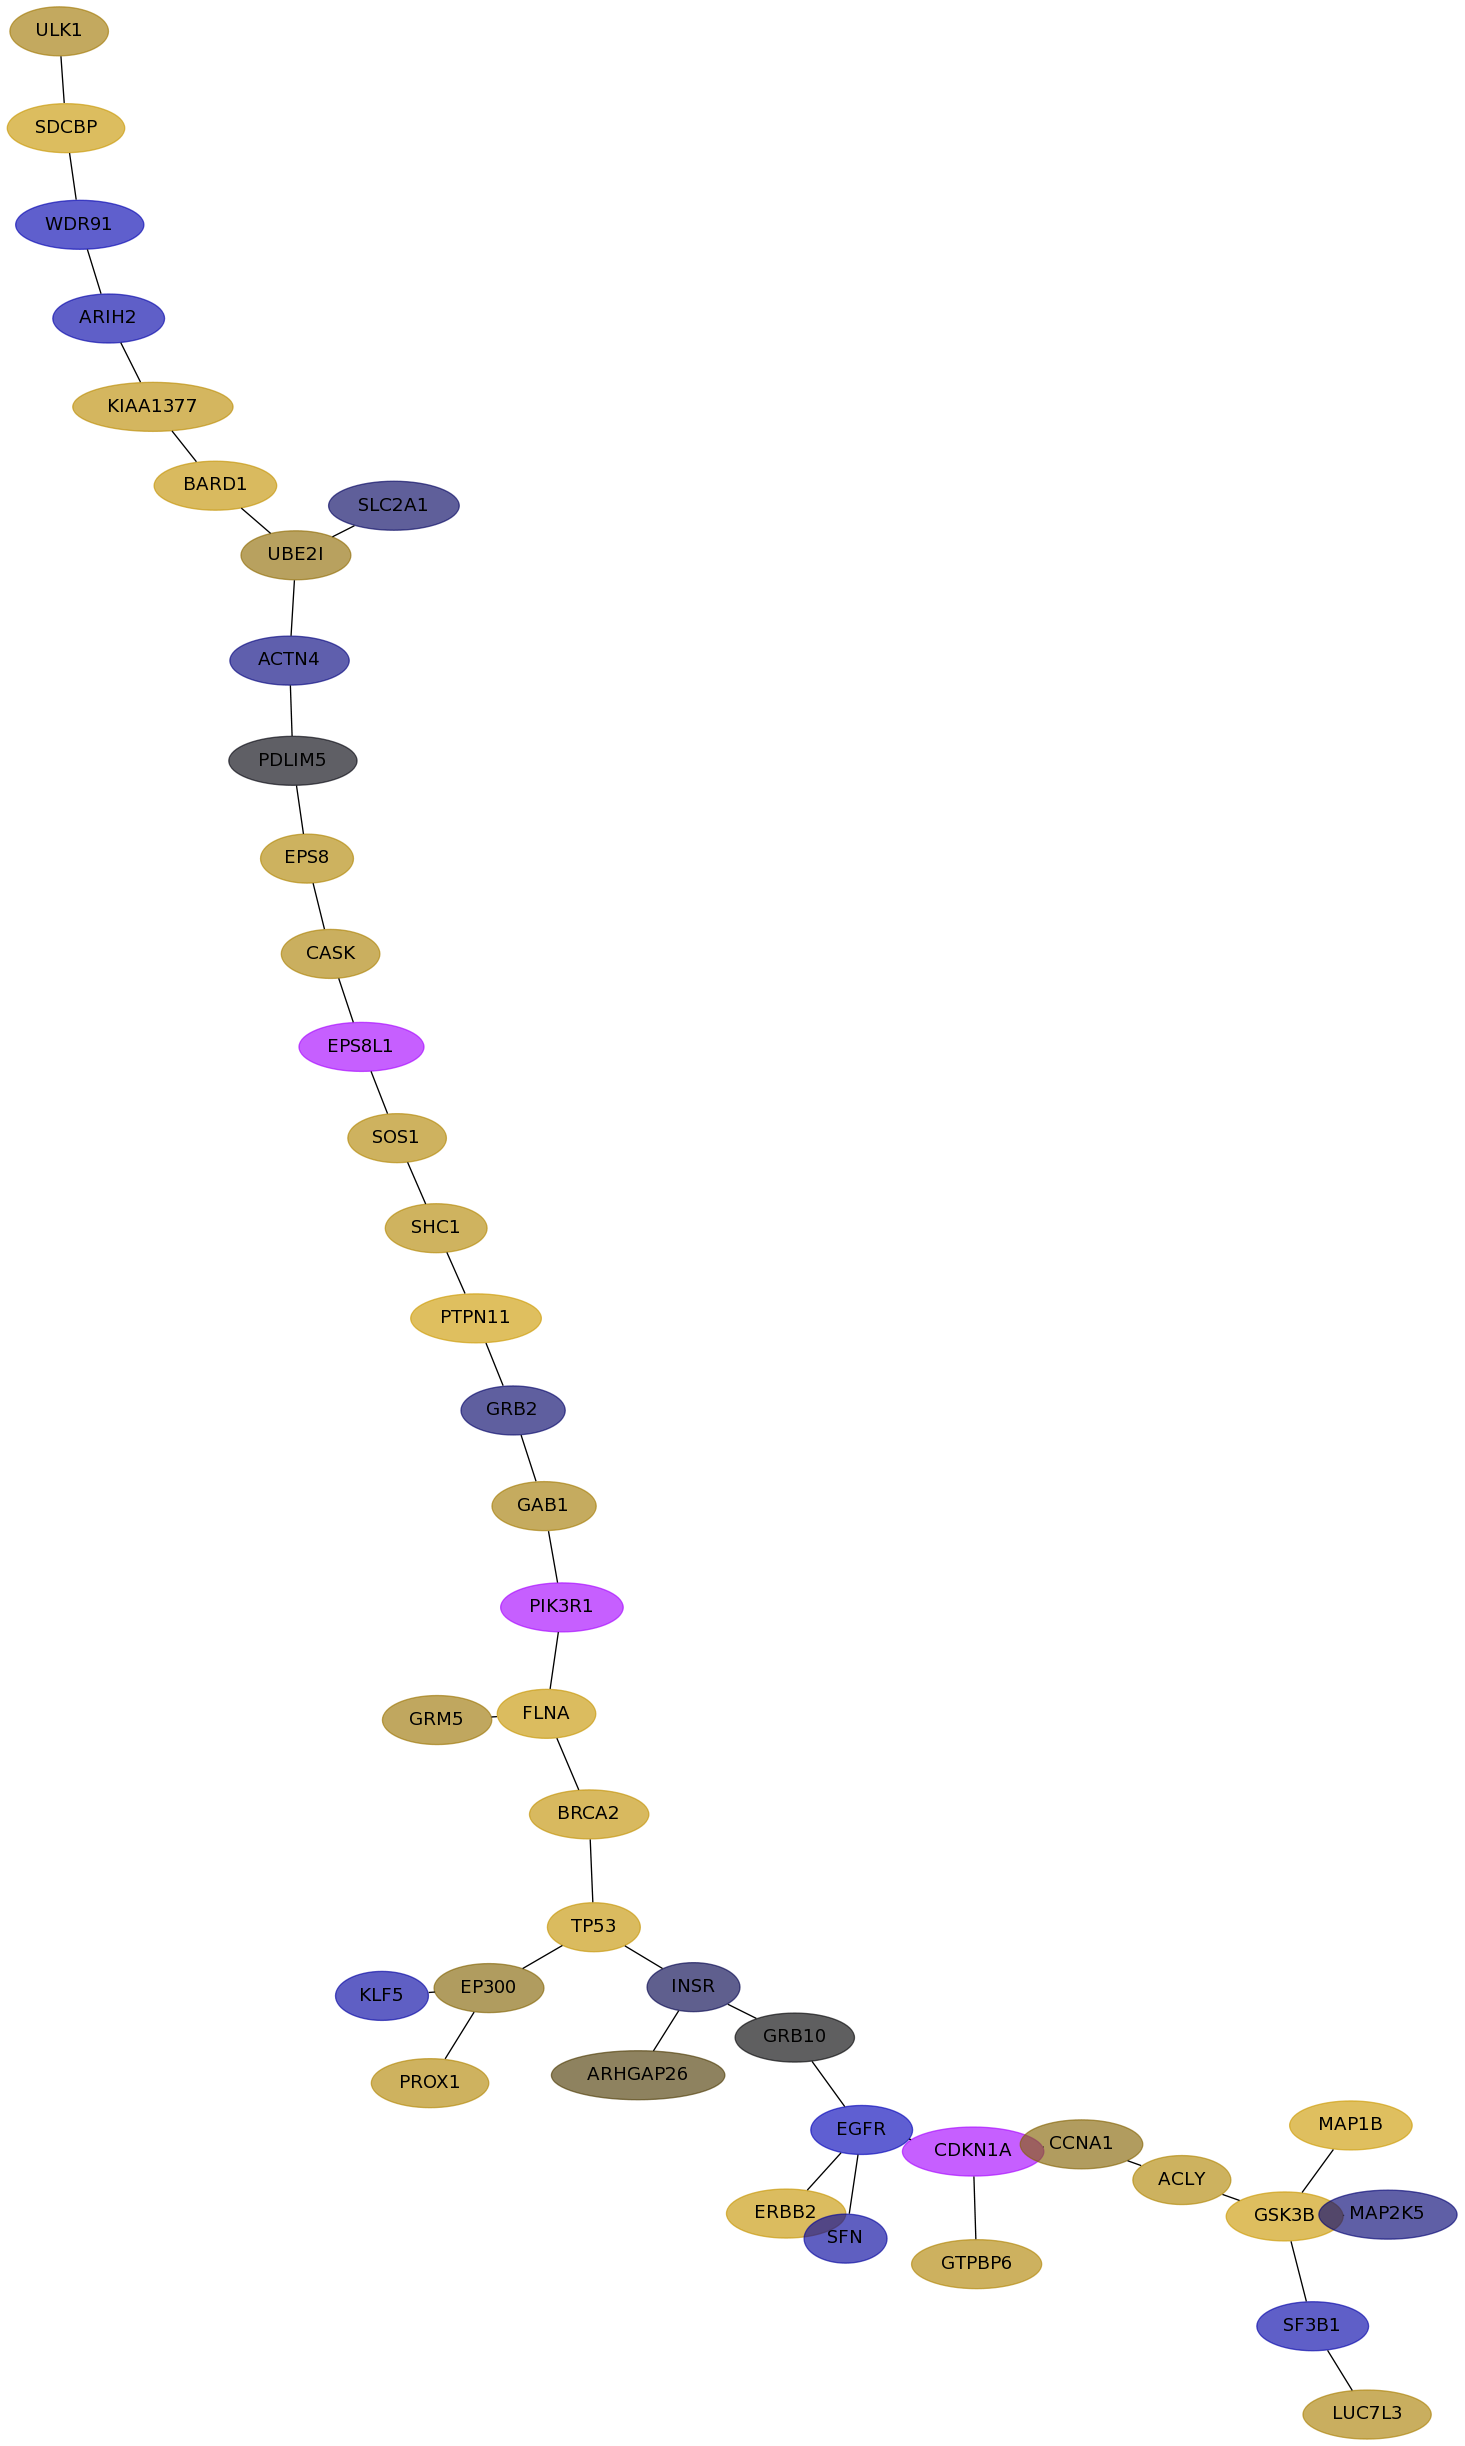
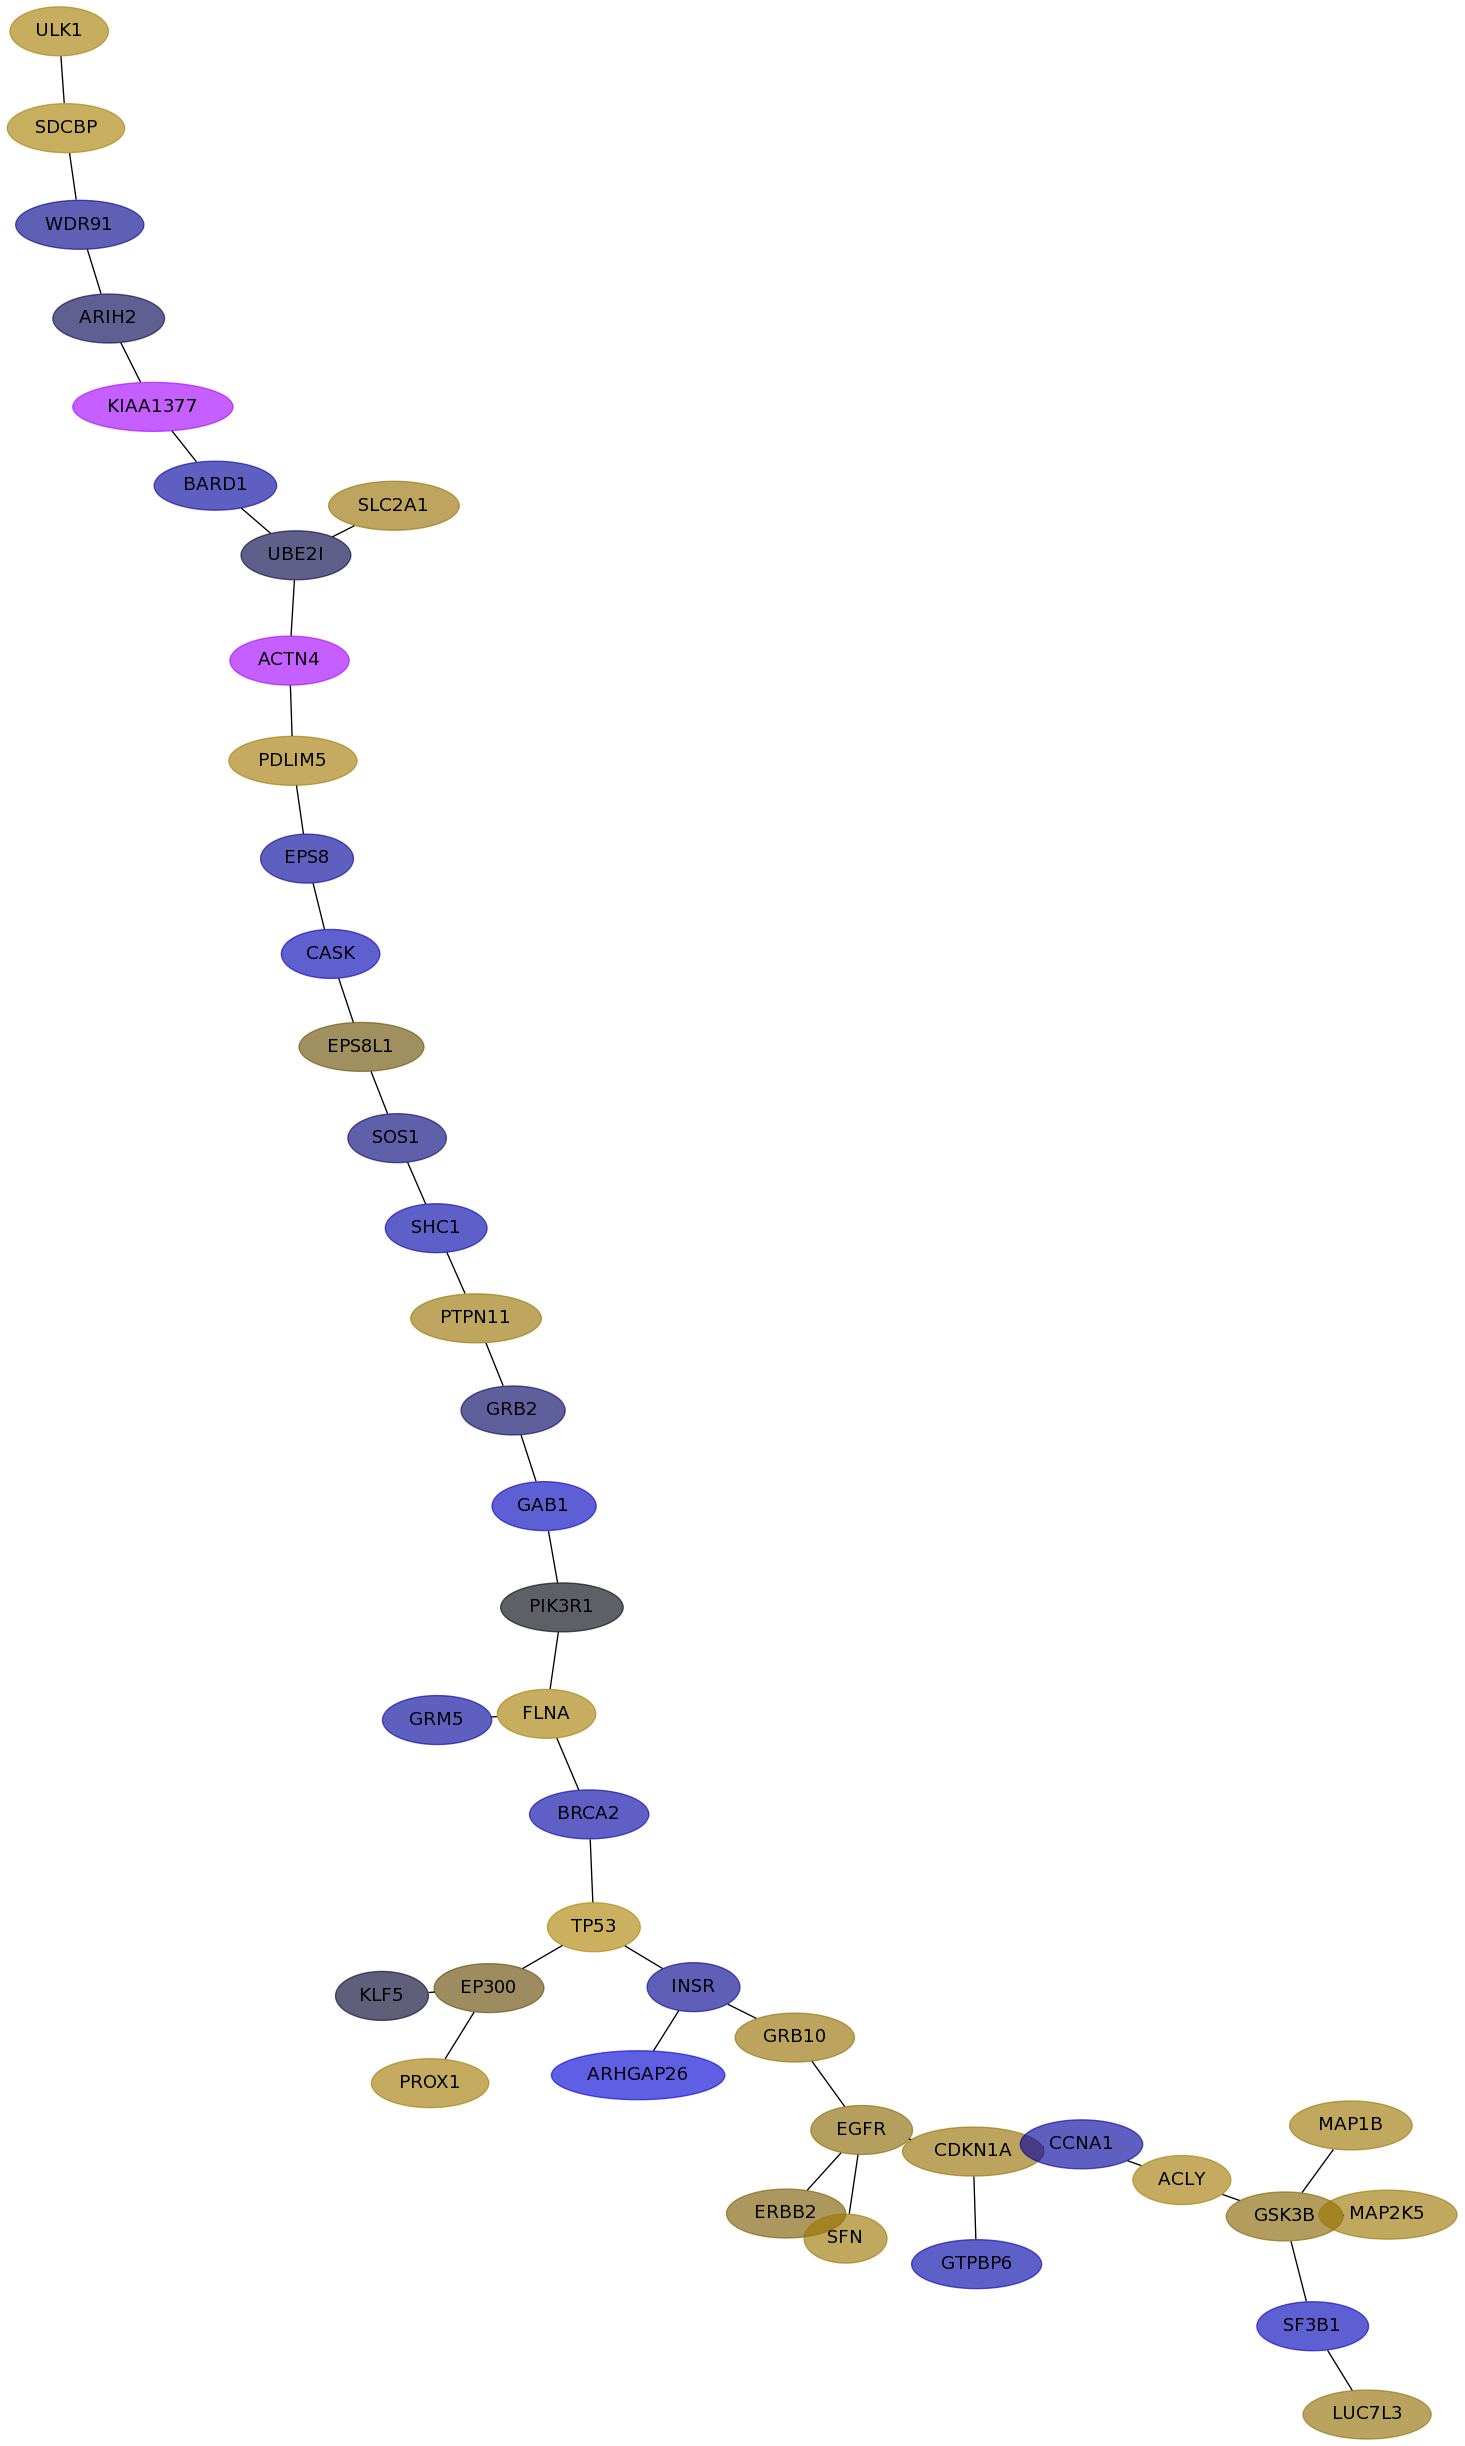
Subnetwork structure for each dataset
- IPC
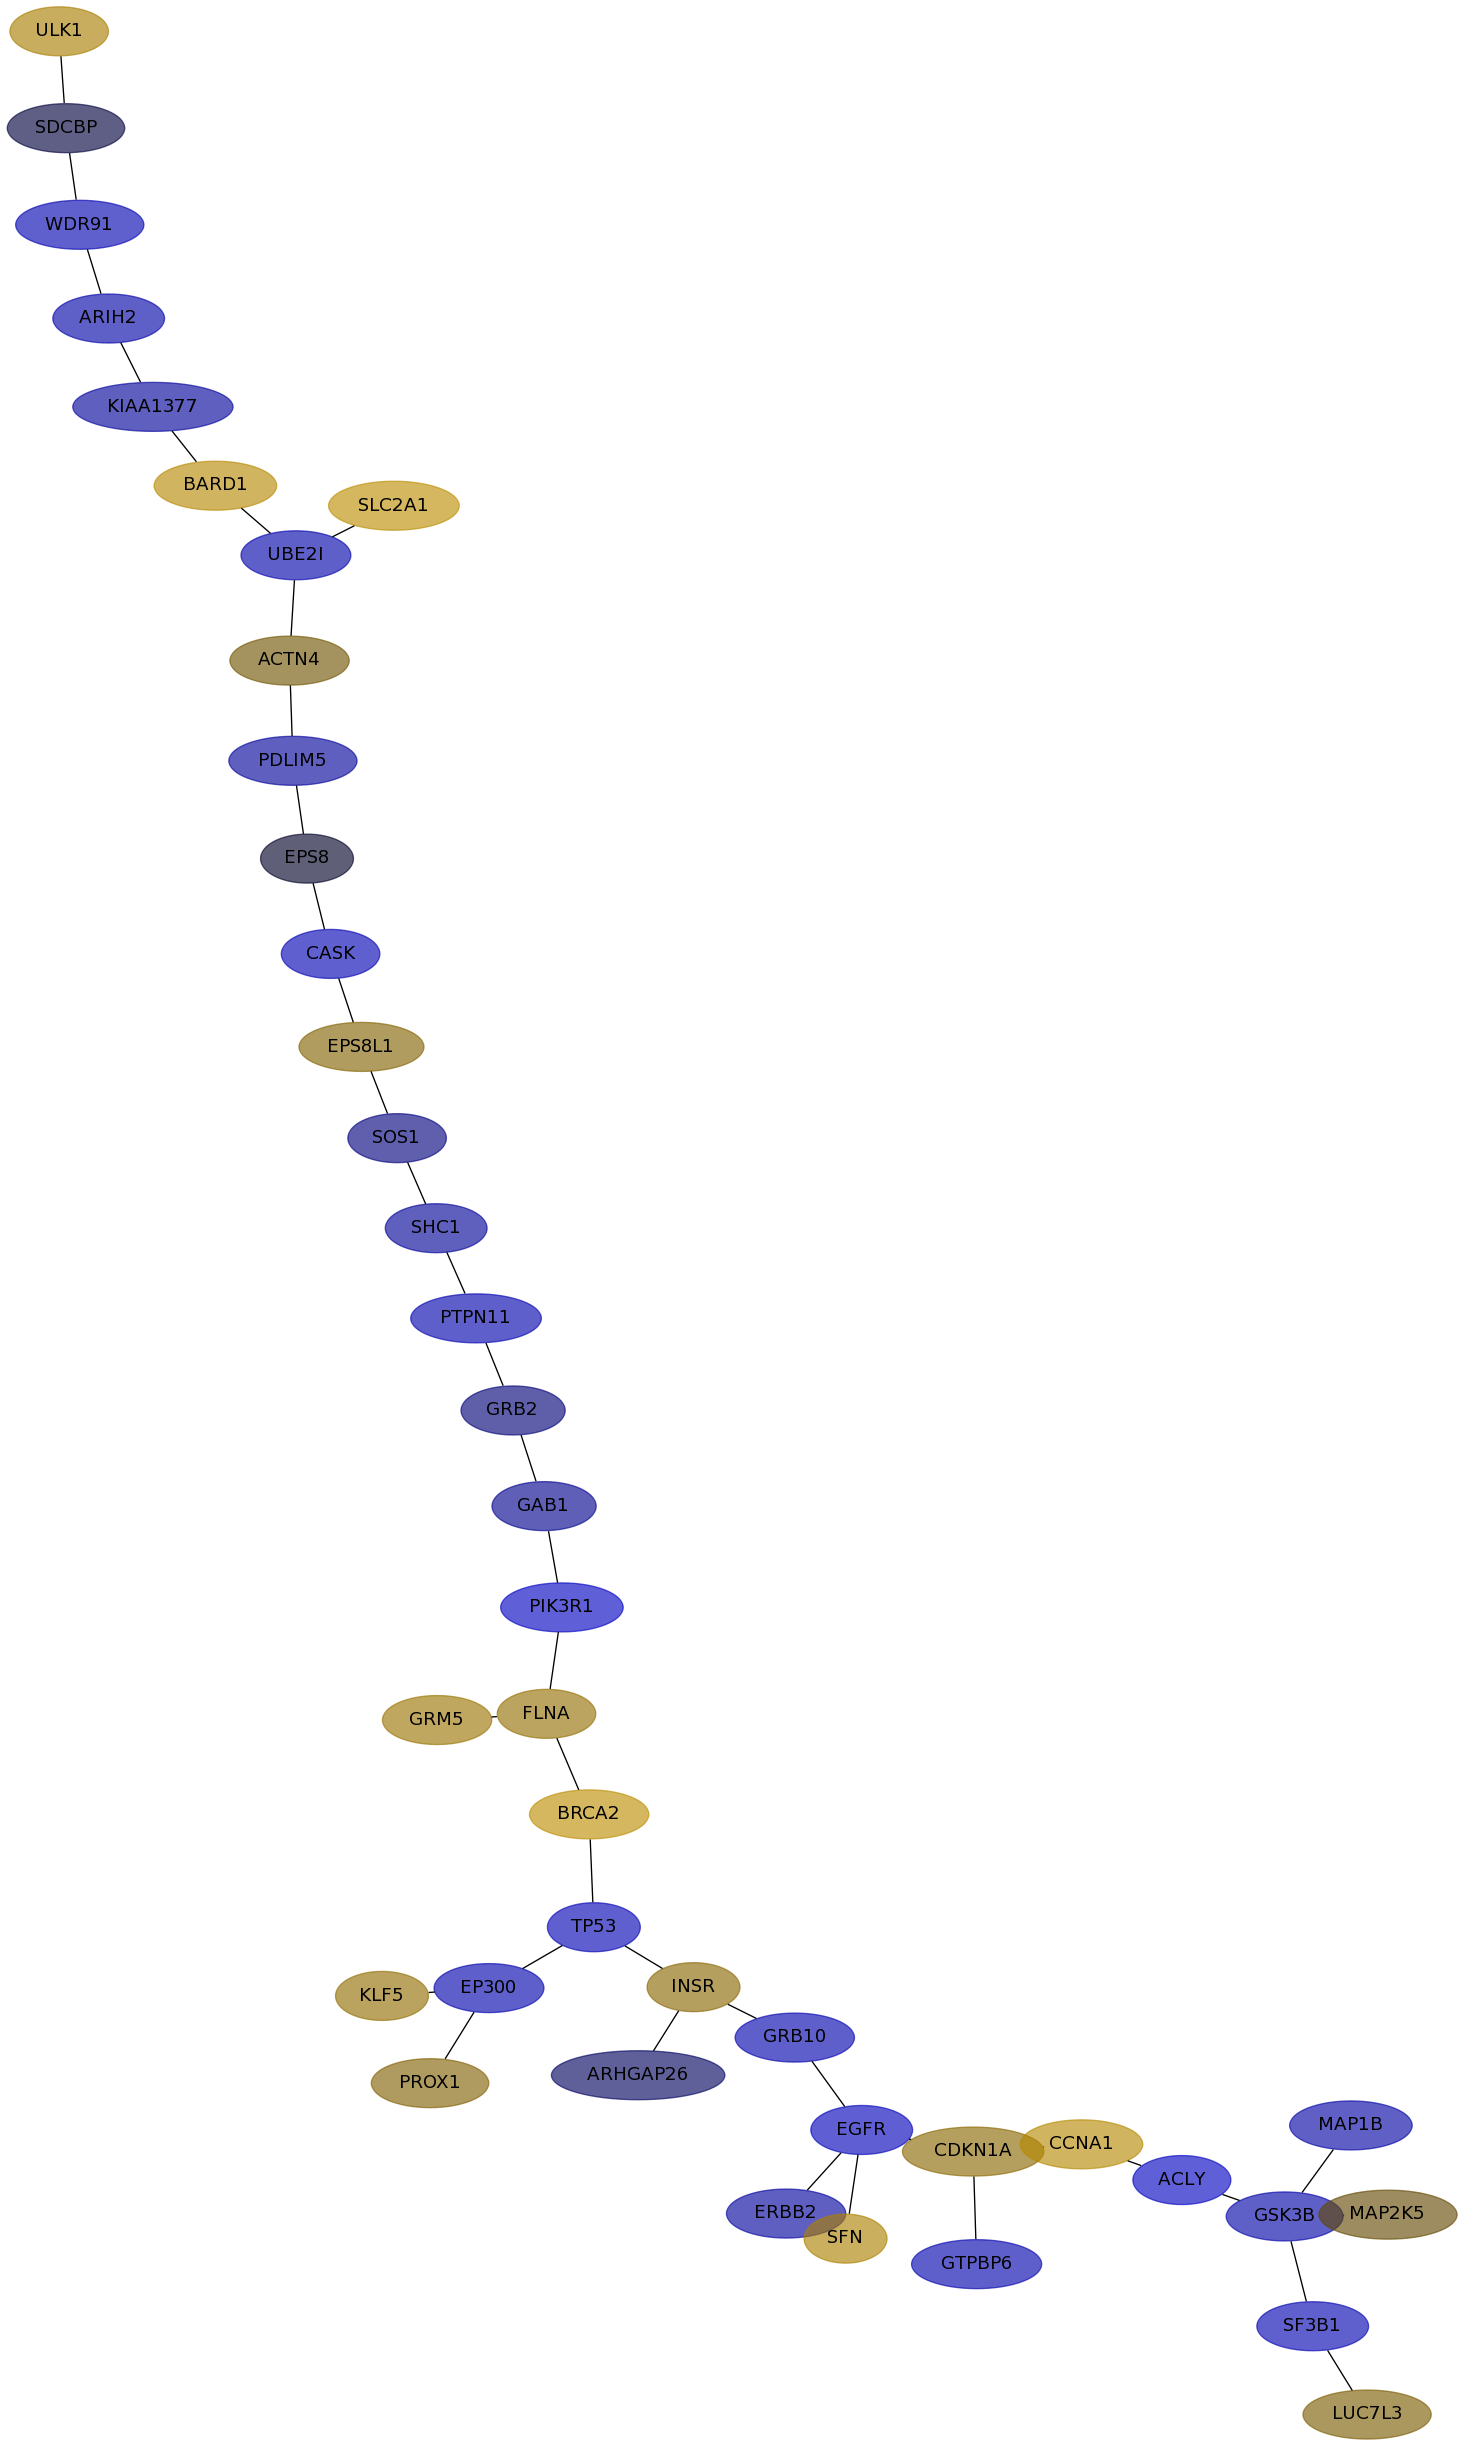
Score for each gene in subnetwork 6682 in each dataset
| Gene Symbol | Links | Frequency | Frequency Rank | Subnetwork score rank | Global rank |
IPC | Loi | Schmidt | VanDeVijver | Wang |
|---|
| EP300 |   | 113 | 4 | 1 | 4 | -0.149 | 0.087 | 0.102 | 0.052 | 0.025 |
|---|
| ARHGAP26 | | 21 | 73 | 457 | 438 | -0.023 | 0.171 | -0.222 | 0.015 | -0.348 |
|---|
| MAP2K5 | | 2 | 743 | 296 | 336 | 0.024 | 0.039 | 0.130 | -0.036 | 0.096 |
|---|
| EPS8L1 | | 2 | 743 | 1274 | 1260 | 0.054 | 0.202 | -0.095 | undef | 0.029 |
|---|
| SF3B1 | | 18 | 86 | 296 | 280 | -0.154 | 0.126 | -0.073 | -0.131 | -0.204 |
|---|
| EPS8 | | 1 | 1195 | 1433 | 1454 | -0.005 | -0.074 | 0.226 | 0.160 | -0.093 |
|---|
| SLC2A1 | | 7 | 256 | 236 | 237 | 0.205 | 0.143 | -0.050 | -0.023 | 0.086 |
|---|
| TP53 | | 85 | 7 | 1 | 6 | -0.167 | 0.148 | -0.027 | 0.252 | 0.147 |
|---|
| ERBB2 | | 141 | 1 | 1 | 1 | -0.103 | 0.092 | -0.090 | 0.267 | 0.046 |
|---|
| ULK1 | | 1 | 1195 | 1433 | 1454 | 0.127 | 0.252 | -0.172 | 0.106 | 0.125 |
|---|
| KIAA1377 | | 18 | 86 | 141 | 136 | -0.095 | 0.116 | undef | 0.198 | undef |
|---|
| CDKN1A | | 110 | 5 | 1 | 5 | 0.064 | 0.254 | 0.030 | undef | 0.082 |
|---|
| UBE2I | | 1 | 1195 | 1433 | 1454 | -0.141 | -0.113 | 0.023 | 0.070 | -0.012 |
|---|
| BARD1 | | 69 | 12 | 141 | 132 | 0.179 | -0.165 | 0.086 | 0.245 | -0.104 |
|---|
| GRM5 | | 15 | 111 | 179 | 191 | 0.094 | -0.019 | 0.000 | 0.093 | -0.093 |
|---|
| SHC1 | | 4 | 440 | 478 | 479 | -0.090 | -0.041 | -0.005 | 0.169 | -0.138 |
|---|
| PTPN11 | | 20 | 81 | 83 | 94 | -0.152 | 0.014 | 0.066 | 0.304 | 0.089 |
|---|
| SDCBP | | 3 | 557 | 1433 | 1415 | -0.010 | -0.059 | -0.141 | 0.279 | 0.131 |
|---|
| CASK | | 2 | 743 | 1274 | 1260 | -0.170 | 0.160 | -0.077 | 0.139 | -0.166 |
|---|
| SOS1 | | 5 | 360 | 478 | 476 | -0.049 | 0.002 | -0.007 | 0.160 | -0.042 |
|---|
| PIK3R1 | | 127 | 2 | 1 | 2 | -0.237 | 0.381 | 0.065 | undef | -0.002 |
|---|
| PROX1 | | 4 | 440 | 614 | 618 | 0.050 | -0.030 | -0.128 | 0.161 | 0.112 |
|---|
| FLNA | | 50 | 20 | 1 | 14 | 0.081 | 0.107 | 0.148 | 0.268 | 0.126 |
|---|
| EGFR | | 117 | 3 | 1 | 3 | -0.195 | 0.240 | -0.205 | -0.187 | 0.065 |
|---|
| ARIH2 | | 5 | 360 | 236 | 242 | -0.131 | 0.196 | -0.071 | -0.127 | -0.016 |
|---|
| MAP1B | | 69 | 12 | 1 | 9 | -0.123 | 0.263 | -0.107 | 0.304 | 0.100 |
|---|
| GRB2 | | 13 | 124 | 318 | 316 | -0.040 | -0.159 | -0.036 | -0.028 | -0.024 |
|---|
| INSR | | 96 | 6 | 236 | 221 | 0.063 | 0.173 | 0.135 | -0.014 | -0.072 |
|---|
| BRCA2 | | 41 | 28 | 236 | 222 | 0.206 | -0.124 | -0.066 | 0.233 | -0.116 |
|---|
| GTPBP6 | | 6 | 301 | 928 | 907 | -0.143 | -0.131 | -0.167 | 0.155 | -0.129 |
|---|
| LUC7L3 | | 16 | 104 | 296 | 281 | 0.043 | 0.237 | 0.175 | 0.135 | 0.074 |
|---|
| CCNA1 | | 33 | 37 | 412 | 393 | 0.174 | 0.092 | 0.078 | 0.055 | -0.098 |
|---|
| ACLY | | 6 | 301 | 1260 | 1224 | -0.236 | 0.071 | 0.009 | 0.158 | 0.115 |
|---|
| GSK3B | | 79 | 8 | 179 | 169 | -0.130 | 0.292 | -0.129 | 0.291 | 0.057 |
|---|
| ACTN4 | | 14 | 117 | 318 | 315 | 0.035 | 0.180 | undef | -0.048 | undef |
|---|
| GRB10 | | 3 | 557 | 727 | 728 | -0.149 | 0.182 | -0.070 | -0.000 | 0.081 |
|---|
| KLF5 | | 76 | 9 | 1 | 7 | 0.077 | 0.117 | -0.007 | -0.110 | -0.006 |
|---|
| WDR91 | | 2 | 743 | 236 | 272 | -0.160 | 0.208 | -0.347 | -0.157 | -0.065 |
|---|
| PDLIM5 | | 4 | 440 | 318 | 337 | -0.091 | 0.242 | -0.085 | -0.001 | 0.117 |
|---|
| GAB1 | | 5 | 360 | 1102 | 1076 | -0.069 | 0.084 | -0.117 | 0.116 | -0.212 |
|---|
| SFN | | 25 | 59 | 478 | 454 | 0.141 | 0.270 | 0.023 | -0.102 | 0.101 |
|---|
GO Enrichment output for subnetwork 6682 in each dataset
| Name | Accession Number | Link | P-val | Corrected P-val |
|---|
| regulation of protein export from nucleus | GO:0046825 |  | 1.872E-14 | 4.574E-11 |
|---|
| cellular response to hormone stimulus | GO:0032870 | | 1.094E-12 | 1.336E-09 |
|---|
| insulin receptor signaling pathway | GO:0008286 | | 8.12E-12 | 6.613E-09 |
|---|
| epidermal growth factor receptor signaling pathway | GO:0007173 | | 1.079E-11 | 6.592E-09 |
|---|
| nerve growth factor receptor signaling pathway | GO:0048011 | | 9.13E-11 | 4.461E-08 |
|---|
| cellular response to insulin stimulus | GO:0032869 | | 1.115E-10 | 4.539E-08 |
|---|
| regulation of intracellular protein transport | GO:0033157 | | 2.353E-10 | 8.212E-08 |
|---|
| regulation of nucleocytoplasmic transport | GO:0046822 | | 4.61E-10 | 1.408E-07 |
|---|
| response to insulin stimulus | GO:0032868 | | 5.399E-10 | 1.466E-07 |
|---|
| regulation of intracellular transport | GO:0032386 | | 2.199E-09 | 5.373E-07 |
|---|
| positive regulation of MAP kinase activity | GO:0043406 | | 2.727E-09 | 6.056E-07 |
|---|
| Name | Accession Number | Link | P-val | Corrected P-val |
|---|
| regulation of protein export from nucleus | GO:0046825 | | 3.652E-14 | 8.787E-11 |
|---|
| cellular response to hormone stimulus | GO:0032870 | | 7.676E-11 | 9.235E-08 |
|---|
| nerve growth factor receptor signaling pathway | GO:0048011 | | 1.593E-10 | 1.278E-07 |
|---|
| regulation of intracellular protein transport | GO:0033157 | | 5.059E-10 | 3.043E-07 |
|---|
| regulation of nucleocytoplasmic transport | GO:0046822 | | 9.897E-10 | 4.763E-07 |
|---|
| insulin receptor signaling pathway | GO:0008286 | | 1.124E-09 | 4.509E-07 |
|---|
| epidermal growth factor receptor signaling pathway | GO:0007173 | | 1.441E-09 | 4.952E-07 |
|---|
| regulation of intracellular transport | GO:0032386 | | 4.703E-09 | 1.415E-06 |
|---|
| positive regulation of MAP kinase activity | GO:0043406 | | 6.422E-09 | 1.717E-06 |
|---|
| DNA damage response. signal transduction | GO:0042770 | | 6.798E-09 | 1.636E-06 |
|---|
| organ growth | GO:0035265 | | 1.079E-08 | 2.359E-06 |
|---|
| Name | Accession Number | Link | P-val | Corrected P-val |
|---|
| regulation of protein export from nucleus | GO:0046825 | | 1.104E-14 | 2.539E-11 |
|---|
| cellular response to hormone stimulus | GO:0032870 | | 8.407E-11 | 9.668E-08 |
|---|
| nerve growth factor receptor signaling pathway | GO:0048011 | | 1.335E-10 | 1.024E-07 |
|---|
| regulation of intracellular protein transport | GO:0033157 | | 3.008E-10 | 1.73E-07 |
|---|
| regulation of nucleocytoplasmic transport | GO:0046822 | | 1.174E-09 | 5.401E-07 |
|---|
| insulin receptor signaling pathway | GO:0008286 | | 1.386E-09 | 5.312E-07 |
|---|
| epidermal growth factor receptor signaling pathway | GO:0007173 | | 2.352E-09 | 7.728E-07 |
|---|
| negative regulation of peptide secretion | GO:0002792 | | 2.593E-09 | 7.454E-07 |
|---|
| regulation of intracellular transport | GO:0032386 | | 3.638E-09 | 9.296E-07 |
|---|
| positive regulation of MAP kinase activity | GO:0043406 | | 7.924E-09 | 1.823E-06 |
|---|
| DNA damage response. signal transduction | GO:0042770 | | 9.556E-09 | 1.998E-06 |
|---|
VanDeVijver file
| Name | Accession Number | Link | P-val | Corrected P-val |
|---|
| epidermal growth factor receptor signaling pathway | GO:0007173 | | 9.15E-09 | 1.686E-05 |
|---|
| positive regulation of MAP kinase activity | GO:0043406 | | 4.965E-08 | 4.576E-05 |
|---|
| regulation of intracellular protein transport | GO:0033157 | | 5.555E-08 | 3.413E-05 |
|---|
| regulation of nucleocytoplasmic transport | GO:0046822 | | 8.389E-08 | 3.865E-05 |
|---|
| protein amino acid autophosphorylation | GO:0046777 | | 1.018E-07 | 3.753E-05 |
|---|
| regulation of intracellular transport | GO:0032386 | | 1.744E-07 | 5.358E-05 |
|---|
| regulation of MAP kinase activity | GO:0043405 | | 3.065E-07 | 8.071E-05 |
|---|
| ER overload response | GO:0006983 | | 1.484E-06 | 3.418E-04 |
|---|
| positive regulation of protein kinase activity | GO:0045860 | | 1.494E-06 | 3.058E-04 |
|---|
| regulation of catabolic process | GO:0009894 | | 1.5E-06 | 2.765E-04 |
|---|
| positive regulation of transferase activity | GO:0051347 | | 1.711E-06 | 2.867E-04 |
|---|
| Name | Accession Number | Link | P-val | Corrected P-val |
|---|
| regulation of protein export from nucleus | GO:0046825 | | 1.104E-14 | 2.539E-11 |
|---|
| cellular response to hormone stimulus | GO:0032870 | | 8.407E-11 | 9.668E-08 |
|---|
| nerve growth factor receptor signaling pathway | GO:0048011 | | 1.335E-10 | 1.024E-07 |
|---|
| regulation of intracellular protein transport | GO:0033157 | | 3.008E-10 | 1.73E-07 |
|---|
| regulation of nucleocytoplasmic transport | GO:0046822 | | 1.174E-09 | 5.401E-07 |
|---|
| insulin receptor signaling pathway | GO:0008286 | | 1.386E-09 | 5.312E-07 |
|---|
| epidermal growth factor receptor signaling pathway | GO:0007173 | | 2.352E-09 | 7.728E-07 |
|---|
| negative regulation of peptide secretion | GO:0002792 | | 2.593E-09 | 7.454E-07 |
|---|
| regulation of intracellular transport | GO:0032386 | | 3.638E-09 | 9.296E-07 |
|---|
| positive regulation of MAP kinase activity | GO:0043406 | | 7.924E-09 | 1.823E-06 |
|---|
| DNA damage response. signal transduction | GO:0042770 | | 9.556E-09 | 1.998E-06 |
|---|

