Study Desmedt-ER-neg
Study informations
165 subnetworks in total page | file
2310 genes associated page | file
Enriched GO terms page
General informations
General Index page
Study Index page
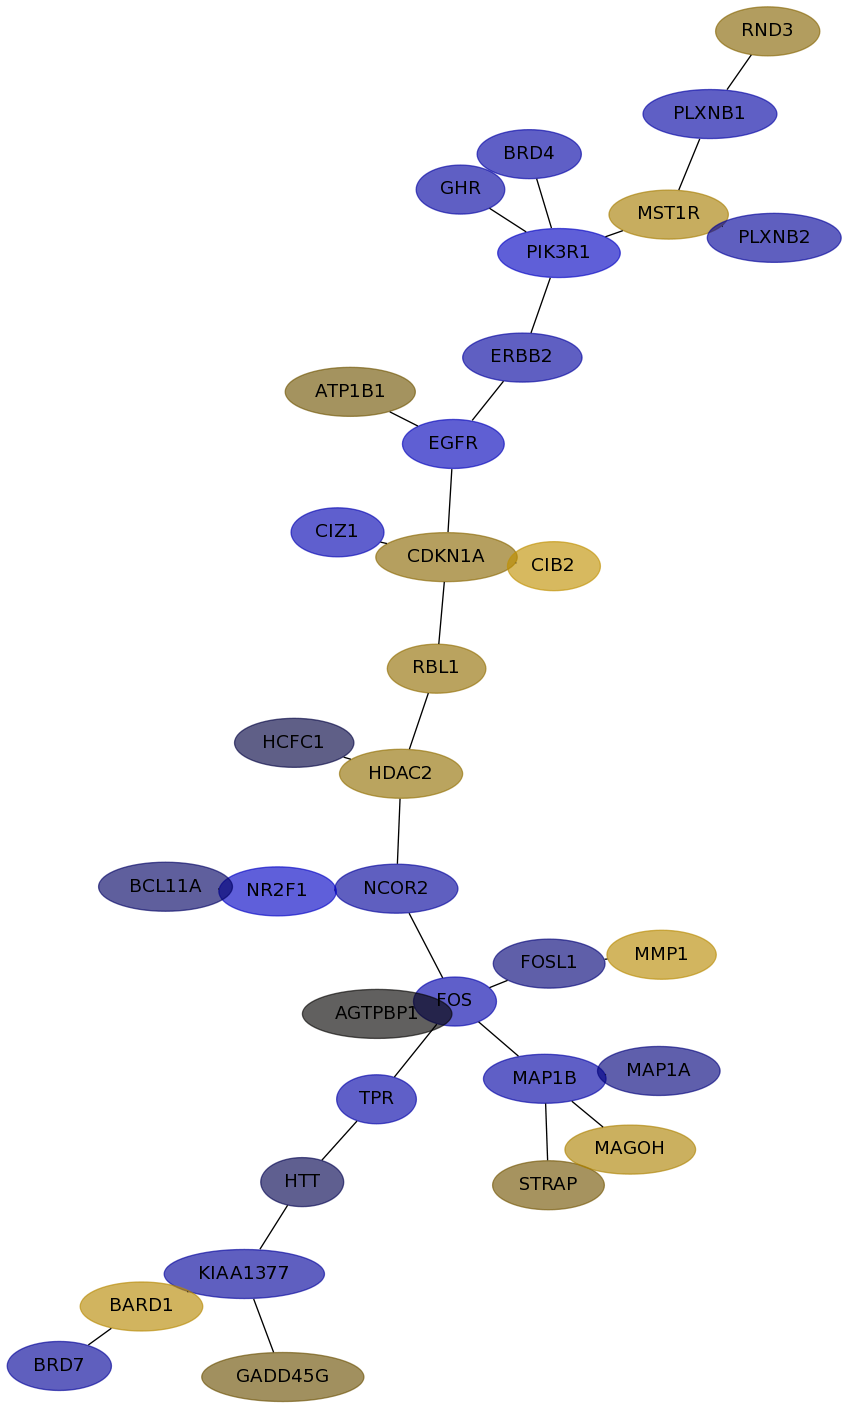
Subnetwork 6642
score
| Dataset | Score | P-val 1 | P-val 2 | P-val 3 | Fisher Score |
|---|
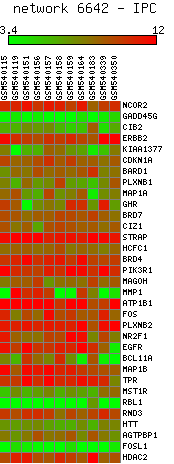
| IPC | 0.7527 | 3.588e-03 | 5.870e-04 | 7.736e-01 | 1.629e-06 |
|---|
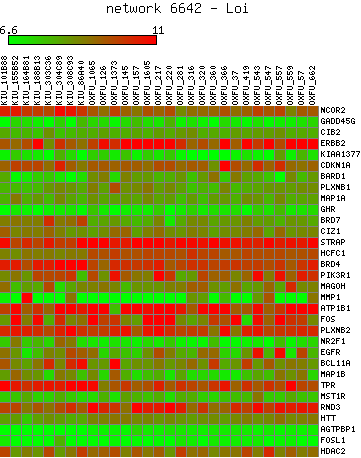
| Loi | 0.2306 | 7.982e-02 | 1.124e-02 | 4.271e-01 | 3.833e-04 |
|---|
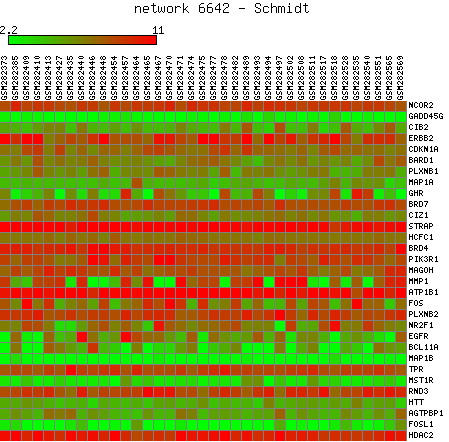
| Schmidt | 0.6740 | 0.000e+00 | 0.000e+00 | 4.424e-02 | 0.000e+00 |
|---|
| VanDeVijver | 0.7908 | 0.000e+00 | 0.000e+00 | 3.464e-03 | 0.000e+00 |
|---|
| Wang | 0.2625 | 2.559e-03 | 4.272e-02 | 3.912e-01 | 4.276e-05 |
|---|
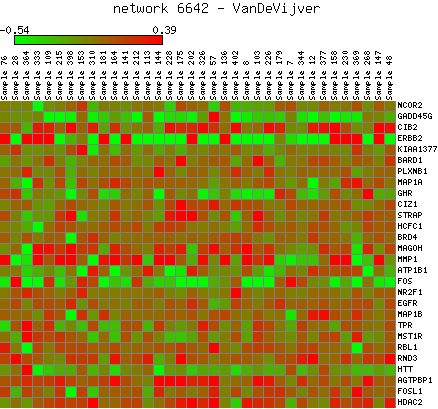
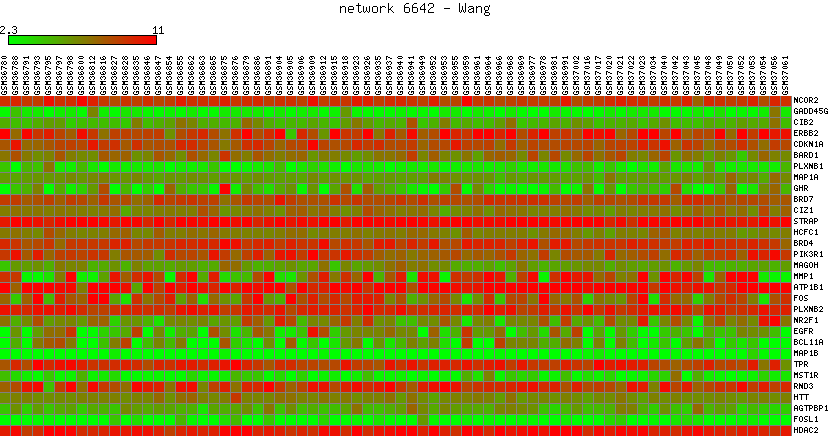
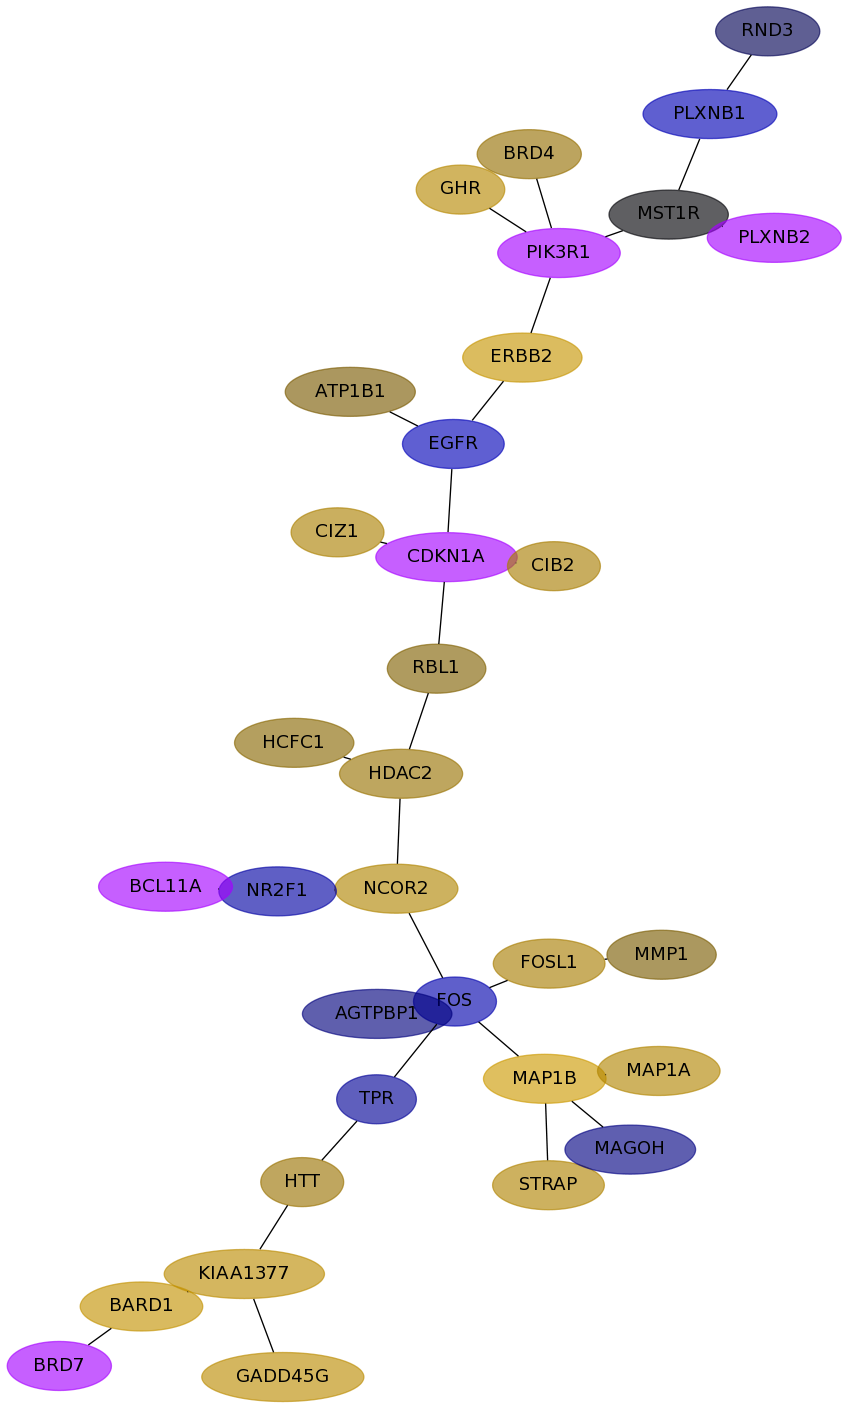
Expression data for subnetwork 6642 in each dataset
IPC |
Loi |
Schmidt |
VanDeVijver |
Wang |
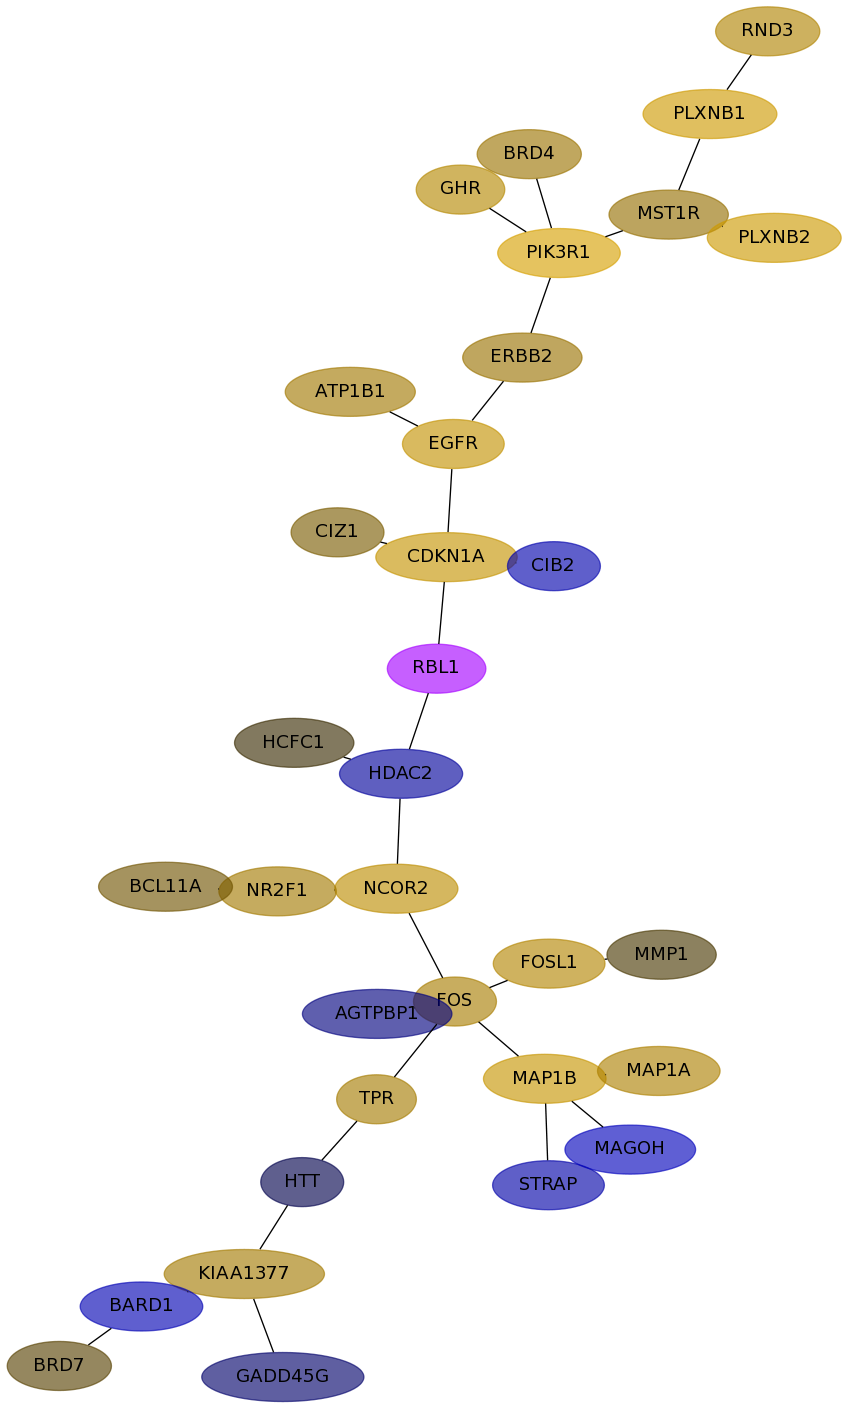
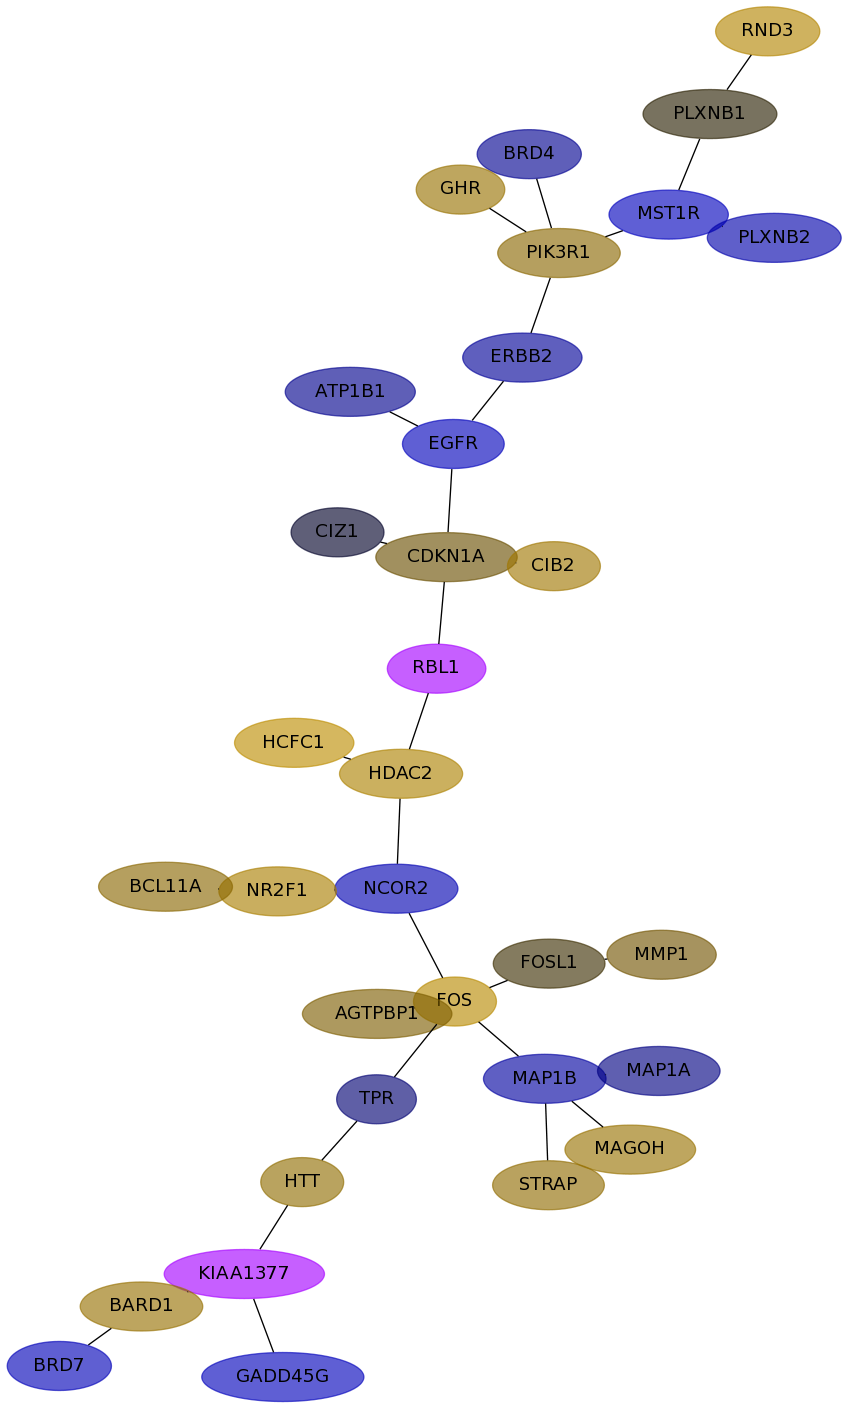
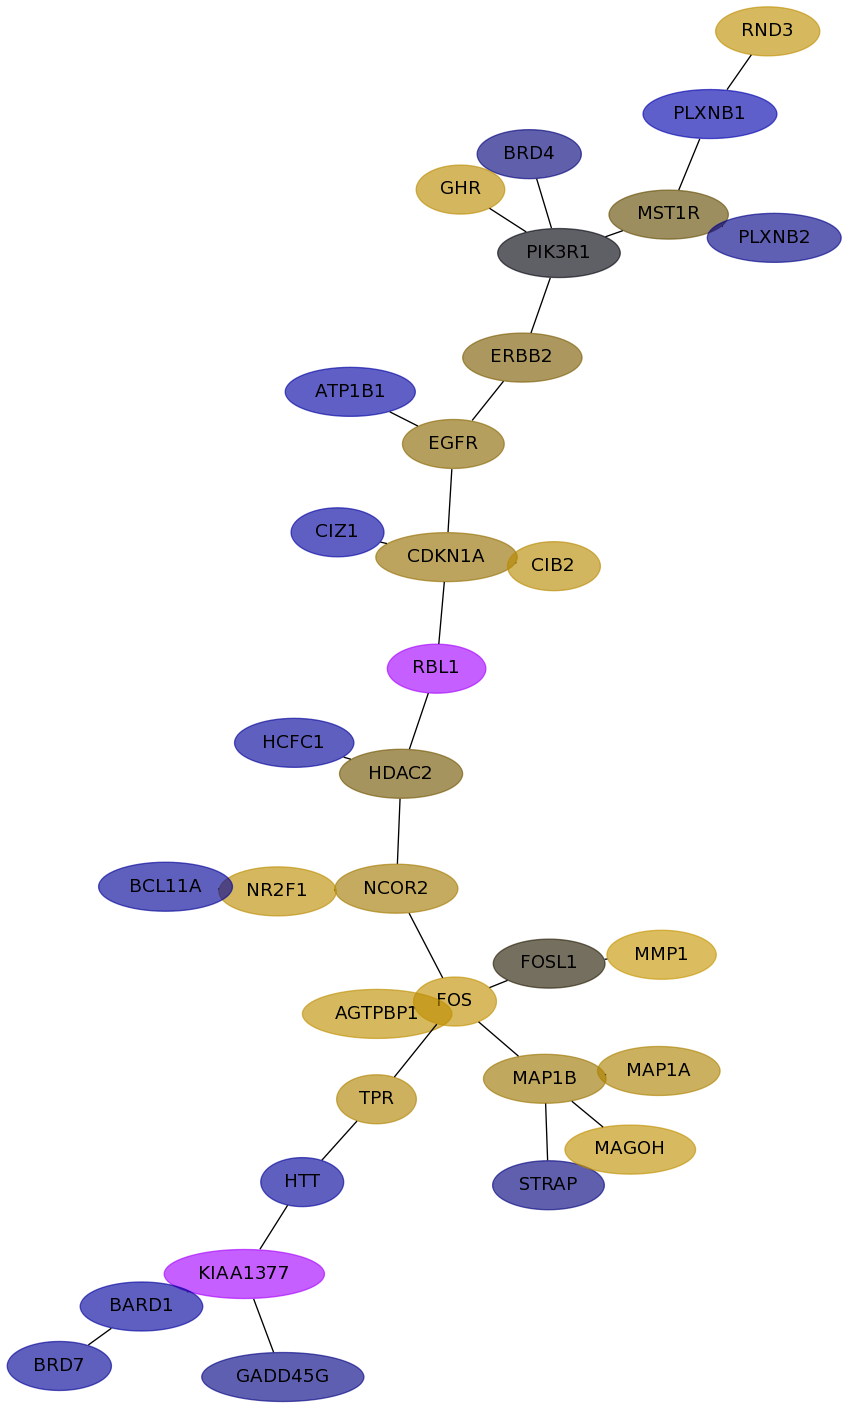
Subnetwork structure for each dataset
- IPC
Score for each gene in subnetwork 6642 in each dataset
| Gene Symbol | Links | Frequency | Frequency Rank | Subnetwork score rank | Global rank |
IPC | Loi | Schmidt | VanDeVijver | Wang |
|---|
| NCOR2 |   | 32 | 40 | 318 | 290 | -0.096 | 0.211 | -0.163 | 0.158 | 0.114 |
|---|
| GADD45G | | 43 | 25 | 141 | 134 | 0.030 | -0.029 | -0.207 | 0.201 | -0.055 |
|---|
| CIB2 | | 18 | 86 | 590 | 564 | 0.228 | -0.149 | 0.106 | 0.127 | 0.190 |
|---|
| ERBB2 | | 141 | 1 | 1 | 1 | -0.103 | 0.092 | -0.090 | 0.267 | 0.046 |
|---|
| KIAA1377 | | 18 | 86 | 141 | 136 | -0.095 | 0.116 | undef | 0.198 | undef |
|---|
| CDKN1A | | 110 | 5 | 1 | 5 | 0.064 | 0.254 | 0.030 | undef | 0.082 |
|---|
| BARD1 | | 69 | 12 | 141 | 132 | 0.179 | -0.165 | 0.086 | 0.245 | -0.104 |
|---|
| PLXNB1 | | 4 | 440 | 1047 | 1032 | -0.117 | 0.312 | 0.006 | -0.172 | -0.146 |
|---|
| MAP1A | | 12 | 140 | 1 | 36 | -0.045 | 0.143 | -0.054 | 0.162 | 0.147 |
|---|
| GHR | | 35 | 34 | 83 | 83 | -0.112 | 0.174 | 0.090 | 0.176 | 0.201 |
|---|
| BRD7 | | 23 | 66 | 457 | 437 | -0.090 | 0.019 | -0.188 | undef | -0.086 |
|---|
| CIZ1 | | 2 | 743 | 1047 | 1055 | -0.162 | 0.045 | -0.006 | 0.139 | -0.108 |
|---|
| STRAP | | 7 | 256 | 412 | 414 | 0.035 | -0.128 | 0.074 | 0.154 | -0.049 |
|---|
| HCFC1 | | 4 | 440 | 648 | 645 | -0.011 | 0.009 | 0.209 | 0.061 | -0.093 |
|---|
| BRD4 | | 11 | 148 | 1047 | 1003 | -0.119 | 0.095 | -0.075 | 0.081 | -0.044 |
|---|
| PIK3R1 | | 127 | 2 | 1 | 2 | -0.237 | 0.381 | 0.065 | undef | -0.002 |
|---|
| MAGOH | | 2 | 743 | 1346 | 1333 | 0.144 | -0.199 | 0.089 | -0.052 | 0.228 |
|---|
| MMP1 | | 11 | 148 | 366 | 360 | 0.192 | 0.014 | 0.036 | 0.044 | 0.260 |
|---|
| ATP1B1 | | 1 | 1195 | 1346 | 1380 | 0.034 | 0.111 | -0.067 | 0.043 | -0.118 |
|---|
| FOS | | 42 | 27 | 1 | 17 | -0.137 | 0.129 | 0.185 | -0.144 | 0.234 |
|---|
| PLXNB2 | | 4 | 440 | 590 | 585 | -0.092 | 0.308 | -0.136 | undef | -0.062 |
|---|
| NR2F1 | | 25 | 59 | 83 | 92 | -0.252 | 0.113 | 0.133 | -0.116 | 0.207 |
|---|
| EGFR | | 117 | 3 | 1 | 3 | -0.195 | 0.240 | -0.205 | -0.187 | 0.065 |
|---|
| BCL11A | | 2 | 743 | 1346 | 1333 | -0.026 | 0.035 | 0.064 | undef | -0.087 |
|---|
| MAP1B | | 69 | 12 | 1 | 9 | -0.123 | 0.263 | -0.107 | 0.304 | 0.100 |
|---|
| TPR | | 11 | 148 | 727 | 701 | -0.130 | 0.120 | -0.036 | -0.085 | 0.156 |
|---|
| MST1R | | 5 | 360 | 236 | 242 | 0.124 | 0.083 | -0.212 | -0.001 | 0.026 |
|---|
| RBL1 | | 21 | 73 | 1 | 27 | 0.078 | undef | undef | 0.051 | undef |
|---|
| RND3 | | 2 | 743 | 1346 | 1333 | 0.056 | 0.154 | 0.167 | -0.018 | 0.218 |
|---|
| HTT | | 14 | 117 | 141 | 140 | -0.016 | -0.015 | 0.075 | 0.092 | -0.093 |
|---|
| AGTPBP1 | | 1 | 1195 | 1346 | 1380 | 0.000 | -0.049 | 0.047 | -0.047 | 0.220 |
|---|
| FOSL1 | | 11 | 148 | 366 | 360 | -0.040 | 0.164 | 0.010 | 0.128 | 0.005 |
|---|
| HDAC2 | | 13 | 124 | 318 | 316 | 0.079 | -0.094 | 0.148 | 0.089 | 0.037 |
|---|
GO Enrichment output for subnetwork 6642 in each dataset
| Name | Accession Number | Link | P-val | Corrected P-val |
|---|
| phosphoinositide 3-kinase cascade | GO:0014065 |  | 7.327E-07 | 1.79E-03 |
|---|
| insulin-like growth factor receptor signaling pathway | GO:0048009 | | 1.097E-06 | 1.34E-03 |
|---|
| positive regulation of axonogenesis | GO:0050772 | | 5.882E-06 | 4.79E-03 |
|---|
| positive regulation of epithelial cell proliferation | GO:0050679 | | 2.576E-05 | 0.01573286 |
|---|
| positive regulation of cell projection organization | GO:0031346 | | 3.703E-05 | 0.01809511 |
|---|
| response to hypoxia | GO:0001666 | | 4.403E-05 | 0.01792885 |
|---|
| response to oxygen levels | GO:0070482 | | 4.846E-05 | 0.0169121 |
|---|
| nuclear-transcribed mRNA catabolic process. nonsense-mediated decay | GO:0000184 | | 5.114E-05 | 0.01561673 |
|---|
| 2-oxoglutarate metabolic process | GO:0006103 | | 5.625E-05 | 0.01526965 |
|---|
| valine metabolic process | GO:0006573 | | 5.625E-05 | 0.01374269 |
|---|
| regulation of phospholipase A2 activity | GO:0032429 | | 5.625E-05 | 0.01249335 |
|---|
| Name | Accession Number | Link | P-val | Corrected P-val |
|---|
| phosphoinositide 3-kinase cascade | GO:0014065 | | 8.232E-07 | 1.981E-03 |
|---|
| insulin-like growth factor receptor signaling pathway | GO:0048009 | | 1.233E-06 | 1.483E-03 |
|---|
| positive regulation of axonogenesis | GO:0050772 | | 6.605E-06 | 5.297E-03 |
|---|
| positive regulation of epithelial cell proliferation | GO:0050679 | | 2.208E-05 | 0.01327954 |
|---|
| positive regulation of cell projection organization | GO:0031346 | | 4.156E-05 | 0.01999808 |
|---|
| nuclear-transcribed mRNA catabolic process. nonsense-mediated decay | GO:0000184 | | 4.646E-05 | 0.01863148 |
|---|
| zinc ion transport | GO:0006829 | | 5.738E-05 | 0.01972094 |
|---|
| 2-oxoglutarate metabolic process | GO:0006103 | | 6.089E-05 | 0.01831398 |
|---|
| valine metabolic process | GO:0006573 | | 6.089E-05 | 0.0162791 |
|---|
| regulation of phospholipase A2 activity | GO:0032429 | | 6.089E-05 | 0.01465119 |
|---|
| regulation of axonogenesis | GO:0050770 | | 6.984E-05 | 0.01527684 |
|---|
| Name | Accession Number | Link | P-val | Corrected P-val |
|---|
| insulin-like growth factor receptor signaling pathway | GO:0048009 | | 1.819E-06 | 4.184E-03 |
|---|
| phosphoinositide 3-kinase cascade | GO:0014065 | | 1.819E-06 | 2.092E-03 |
|---|
| positive regulation of axonogenesis | GO:0050772 | | 1.166E-05 | 8.94E-03 |
|---|
| zinc ion transport | GO:0006829 | | 2.163E-05 | 0.01243968 |
|---|
| positive regulation of epithelial cell proliferation | GO:0050679 | | 3.069E-05 | 0.0141157 |
|---|
| positive regulation of cell projection organization | GO:0031346 | | 6.336E-05 | 0.02428737 |
|---|
| nuclear-transcribed mRNA catabolic process. nonsense-mediated decay | GO:0000184 | | 6.336E-05 | 0.02081775 |
|---|
| nuclear-transcribed mRNA catabolic process | GO:0000956 | | 1.016E-04 | 0.0292116 |
|---|
| 2-oxoglutarate metabolic process | GO:0006103 | | 1.038E-04 | 0.02652501 |
|---|
| valine metabolic process | GO:0006573 | | 1.038E-04 | 0.02387251 |
|---|
| regulation of axonogenesis | GO:0050770 | | 1.131E-04 | 0.02364137 |
|---|
VanDeVijver file
| Name | Accession Number | Link | P-val | Corrected P-val |
|---|
| positive regulation of protein kinase activity | GO:0045860 | | 7.651E-06 | 0.01410105 |
|---|
| positive regulation of transferase activity | GO:0051347 | | 8.569E-06 | 7.896E-03 |
|---|
| positive regulation of epithelial cell proliferation | GO:0050679 | | 1.16E-05 | 7.126E-03 |
|---|
| positive regulation of MAP kinase activity | GO:0043406 | | 1.821E-05 | 8.389E-03 |
|---|
| multicellular organismal metabolic process | GO:0044236 | | 3.055E-05 | 0.01125909 |
|---|
| regulation of MAP kinase activity | GO:0043405 | | 5.964E-05 | 0.01832006 |
|---|
| protein amino acid autophosphorylation | GO:0046777 | | 1.013E-04 | 0.02666036 |
|---|
| 2-oxoglutarate metabolic process | GO:0006103 | | 1.063E-04 | 0.02448036 |
|---|
| insulin-like growth factor receptor signaling pathway | GO:0048009 | | 1.063E-04 | 0.02176032 |
|---|
| regulation of phospholipase A2 activity | GO:0032429 | | 1.063E-04 | 0.01958429 |
|---|
| DNA methylation | GO:0006306 | | 1.063E-04 | 0.0178039 |
|---|
| Name | Accession Number | Link | P-val | Corrected P-val |
|---|
| insulin-like growth factor receptor signaling pathway | GO:0048009 | | 1.819E-06 | 4.184E-03 |
|---|
| phosphoinositide 3-kinase cascade | GO:0014065 | | 1.819E-06 | 2.092E-03 |
|---|
| positive regulation of axonogenesis | GO:0050772 | | 1.166E-05 | 8.94E-03 |
|---|
| zinc ion transport | GO:0006829 | | 2.163E-05 | 0.01243968 |
|---|
| positive regulation of epithelial cell proliferation | GO:0050679 | | 3.069E-05 | 0.0141157 |
|---|
| positive regulation of cell projection organization | GO:0031346 | | 6.336E-05 | 0.02428737 |
|---|
| nuclear-transcribed mRNA catabolic process. nonsense-mediated decay | GO:0000184 | | 6.336E-05 | 0.02081775 |
|---|
| nuclear-transcribed mRNA catabolic process | GO:0000956 | | 1.016E-04 | 0.0292116 |
|---|
| 2-oxoglutarate metabolic process | GO:0006103 | | 1.038E-04 | 0.02652501 |
|---|
| valine metabolic process | GO:0006573 | | 1.038E-04 | 0.02387251 |
|---|
| regulation of axonogenesis | GO:0050770 | | 1.131E-04 | 0.02364137 |
|---|

