Study Desmedt-ER-neg
Study informations
165 subnetworks in total page | file
2310 genes associated page | file
Enriched GO terms page
General informations
General Index page
Study Index page
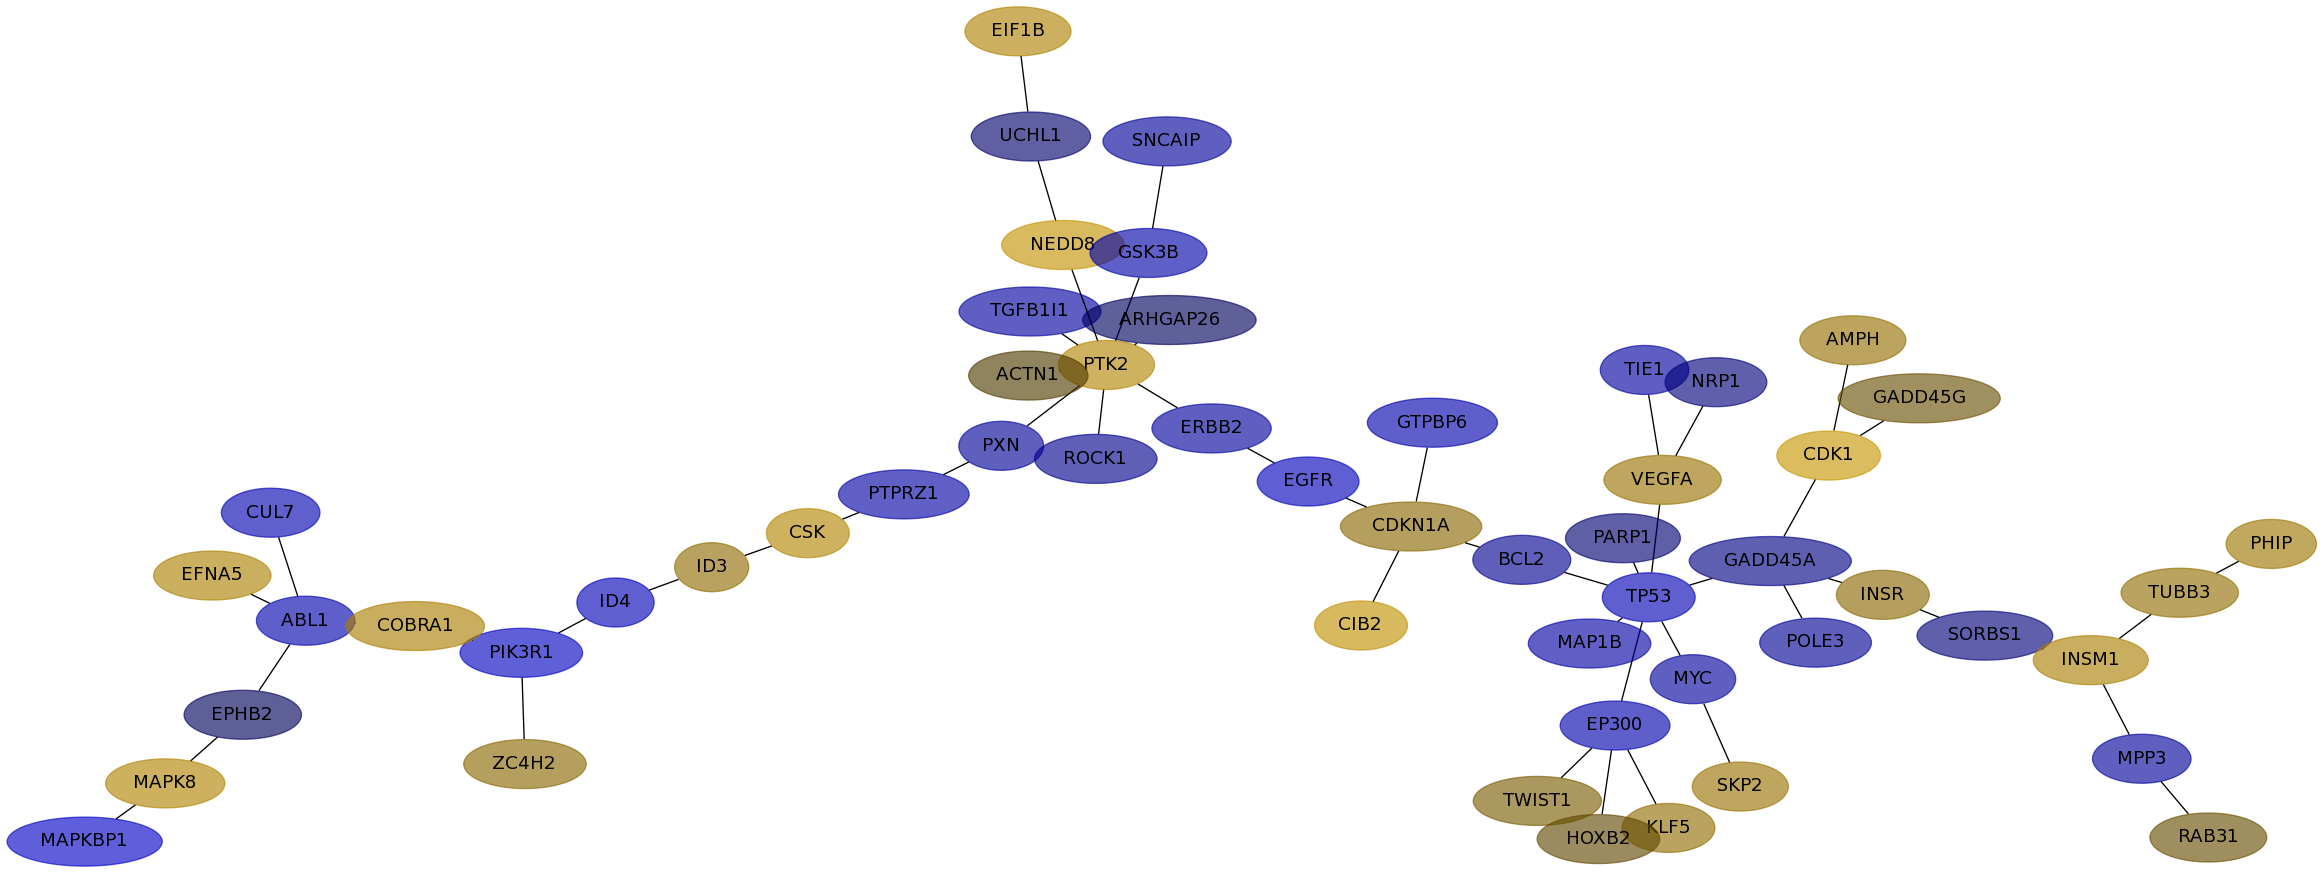
Subnetwork 6551
score
| Dataset | Score | P-val 1 | P-val 2 | P-val 3 | Fisher Score |
|---|
| IPC | 0.7546 | 3.470e-03 | 5.630e-04 | 7.688e-01 | 1.502e-06 |
|---|
| Loi | 0.2306 | 7.987e-02 | 1.125e-02 | 4.272e-01 | 3.841e-04 |
|---|
| Schmidt | 0.6728 | 0.000e+00 | 0.000e+00 | 4.553e-02 | 0.000e+00 |
|---|
| VanDeVijver | 0.7908 | 0.000e+00 | 0.000e+00 | 3.464e-03 | 0.000e+00 |
|---|
| Wang | 0.2616 | 2.671e-03 | 4.375e-02 | 3.961e-01 | 4.629e-05 |
|---|
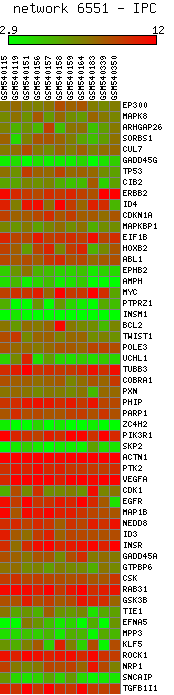
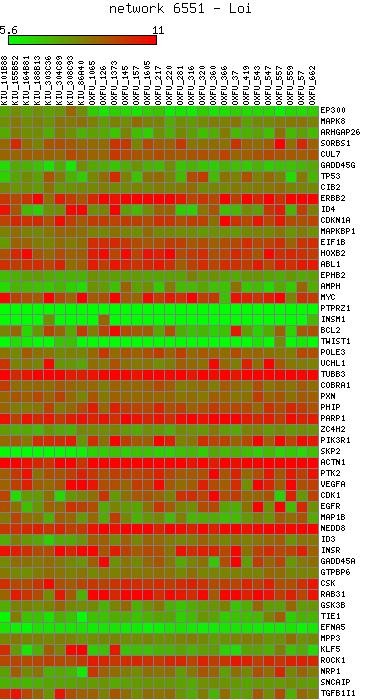
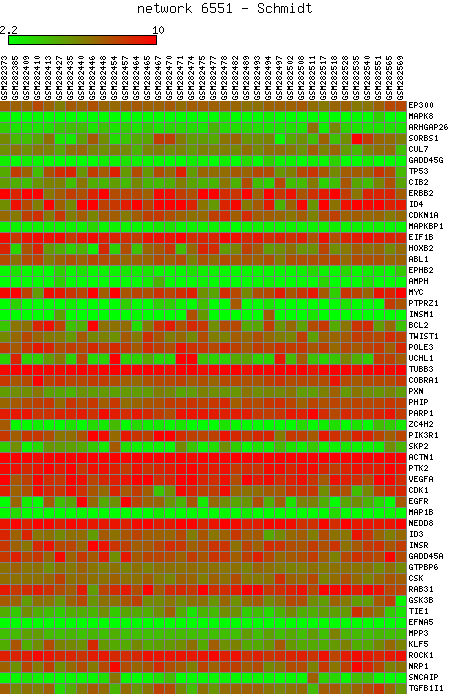
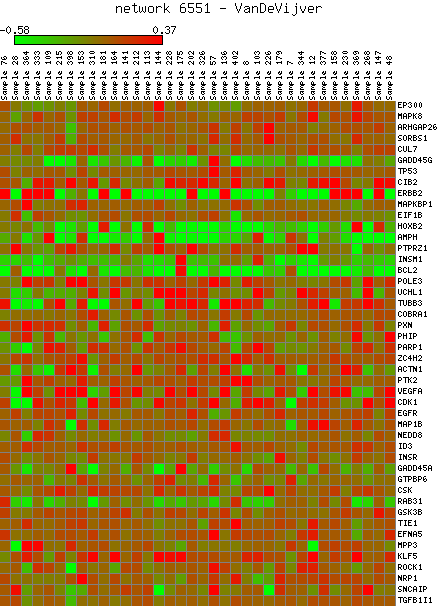
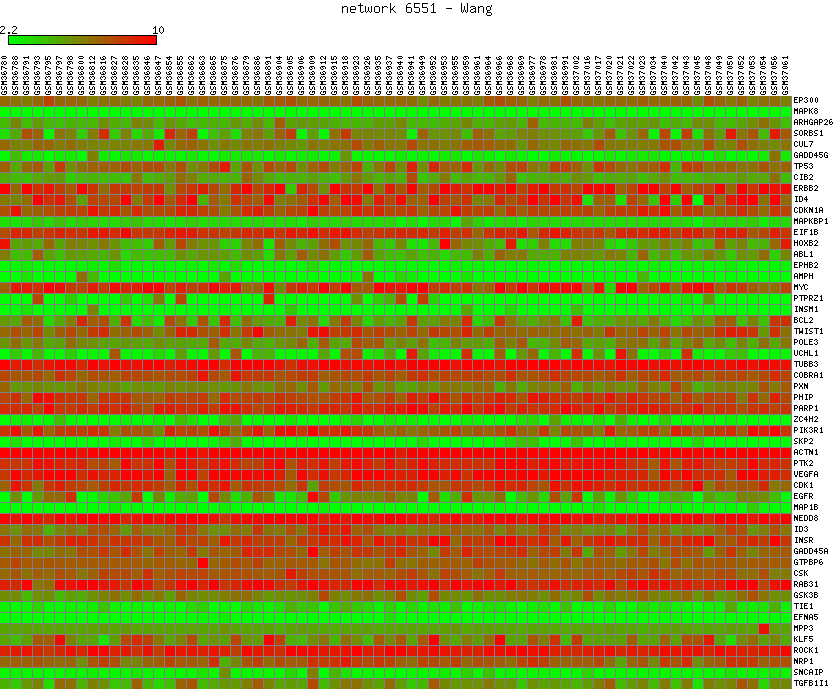
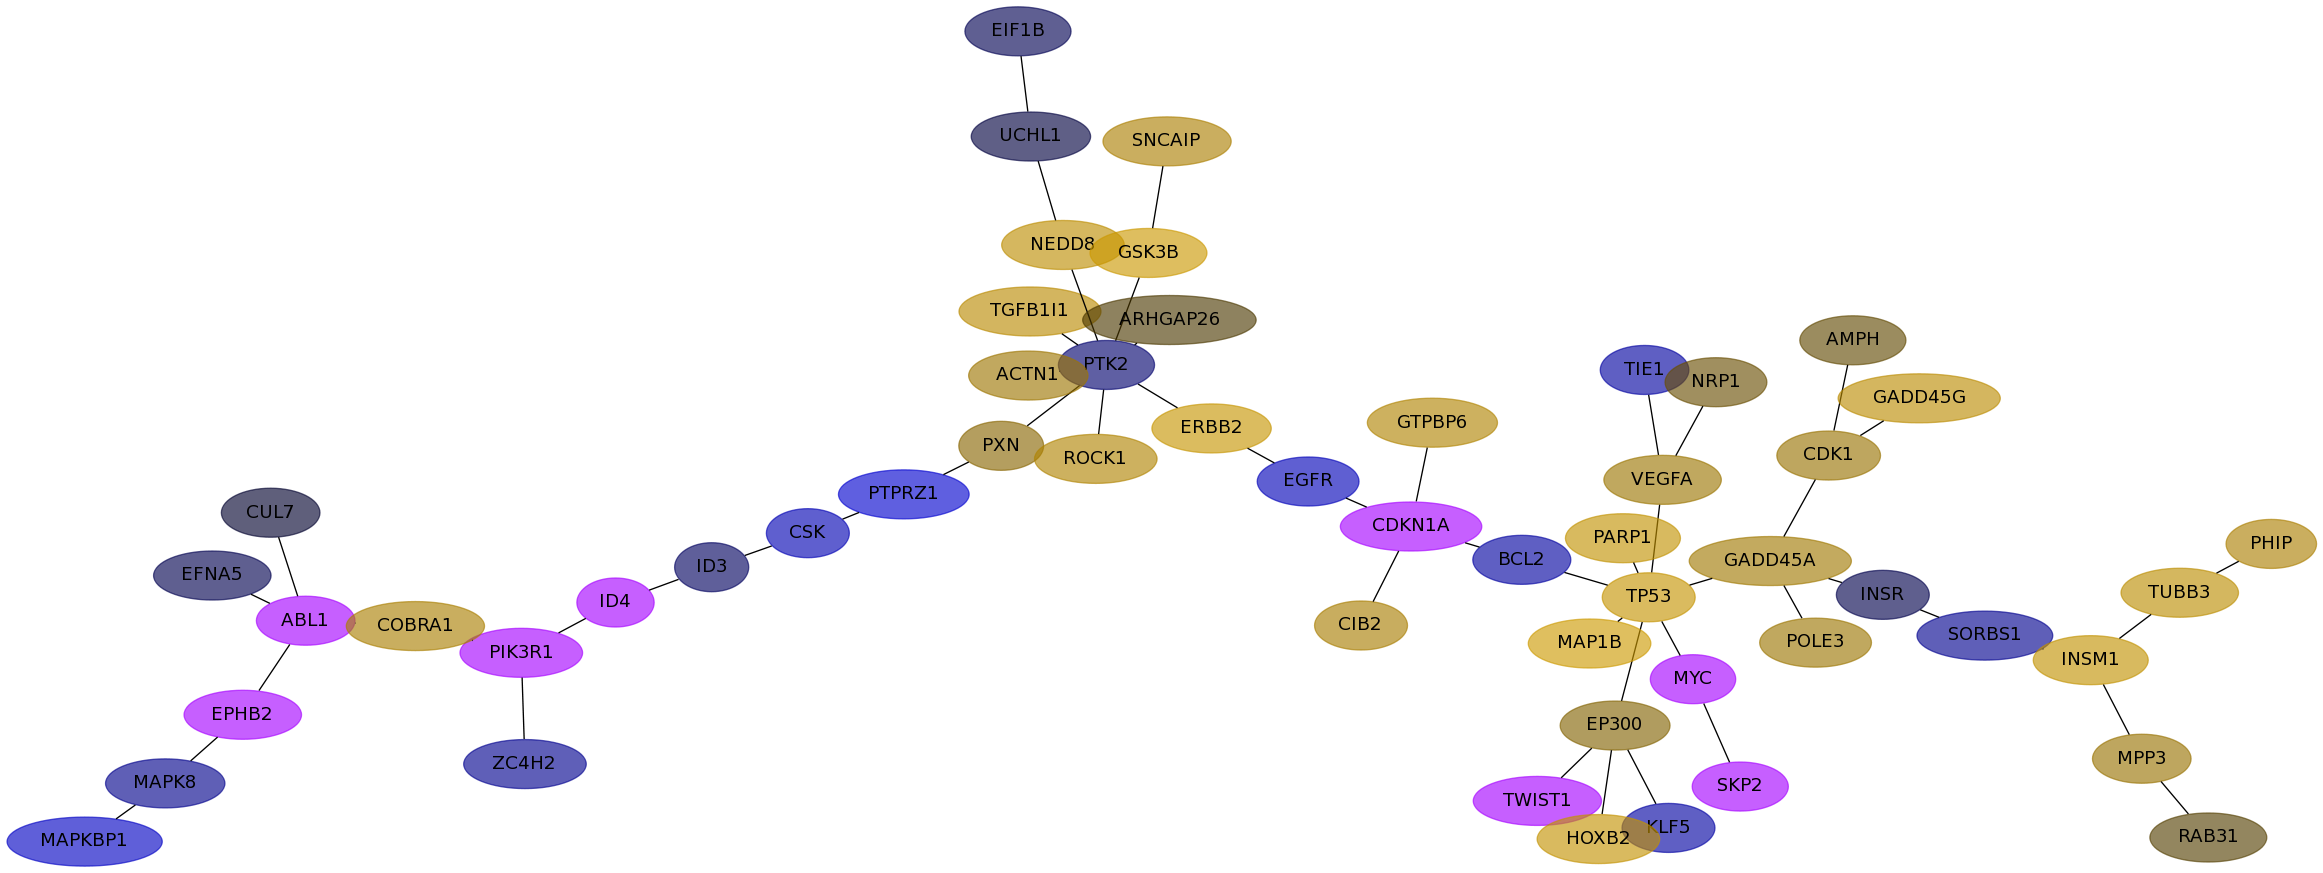
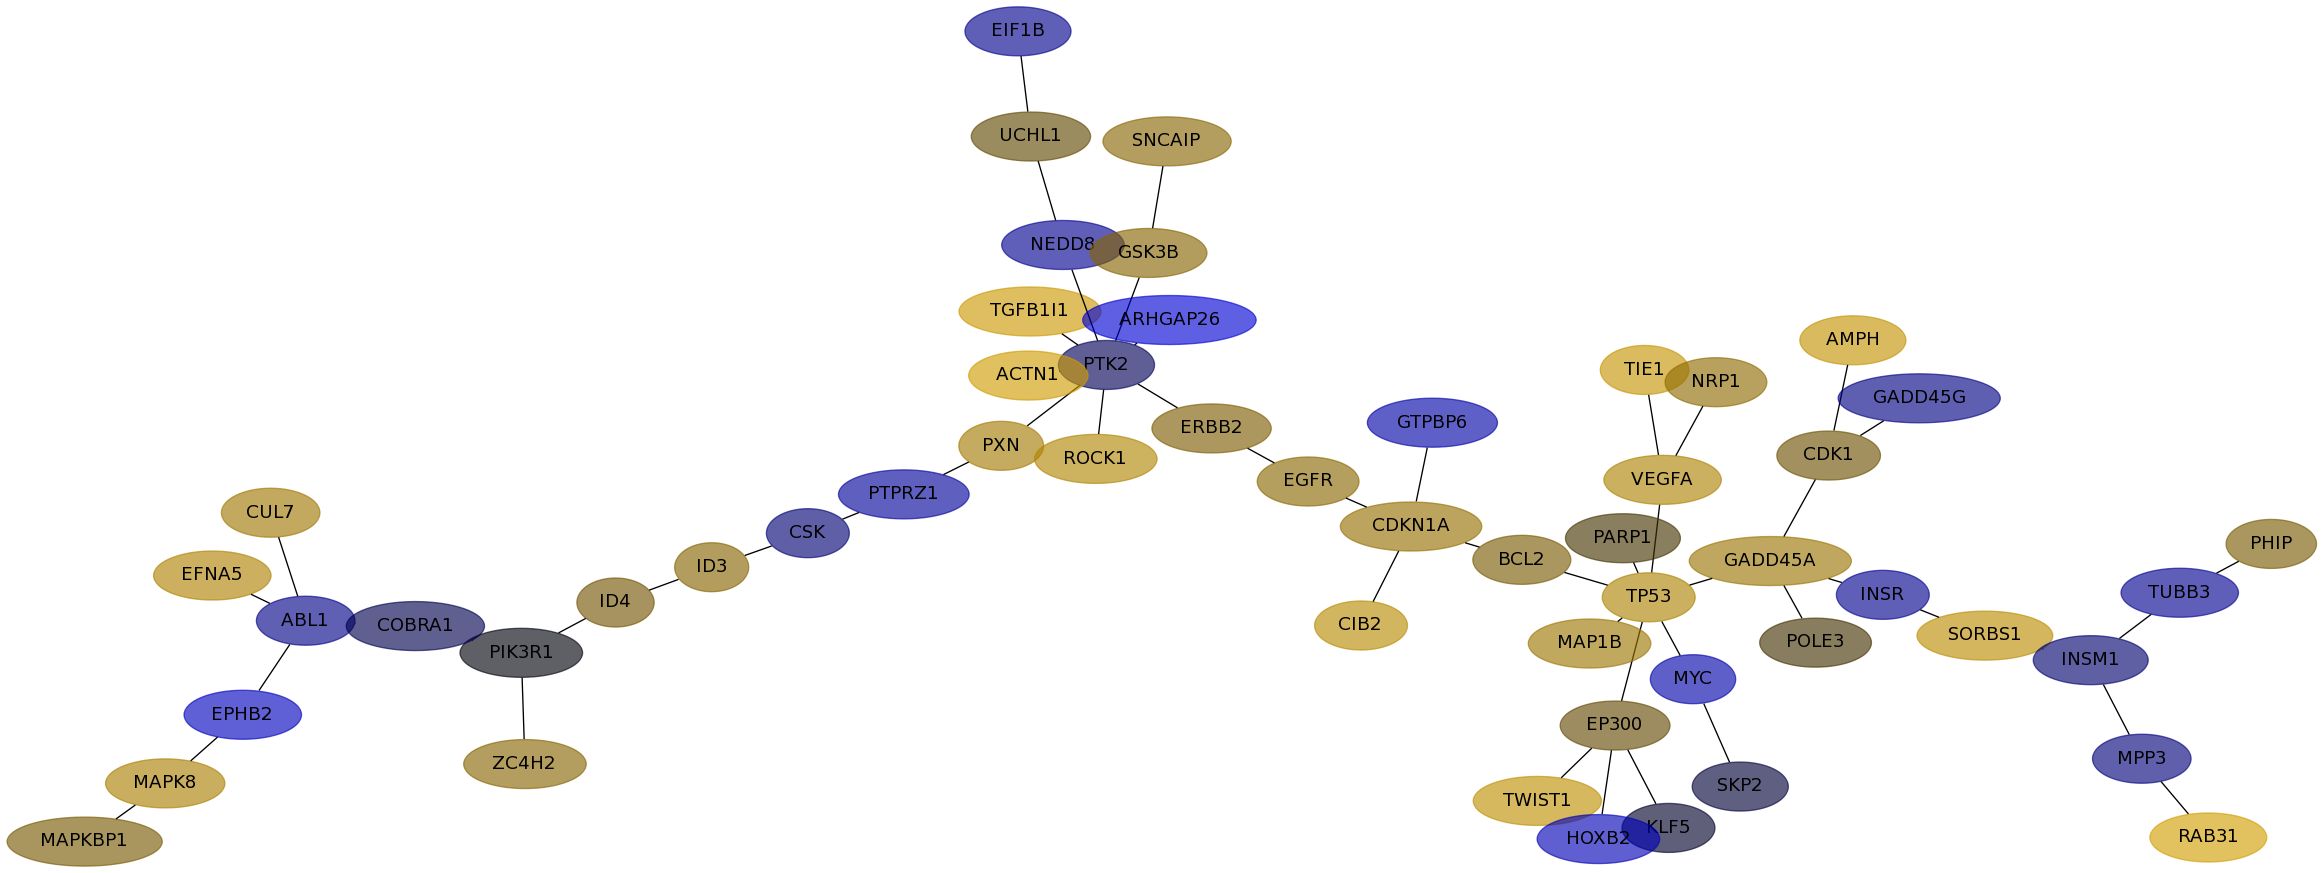
Expression data for subnetwork 6551 in each dataset
IPC |
Loi |
Schmidt |
VanDeVijver |
Wang |
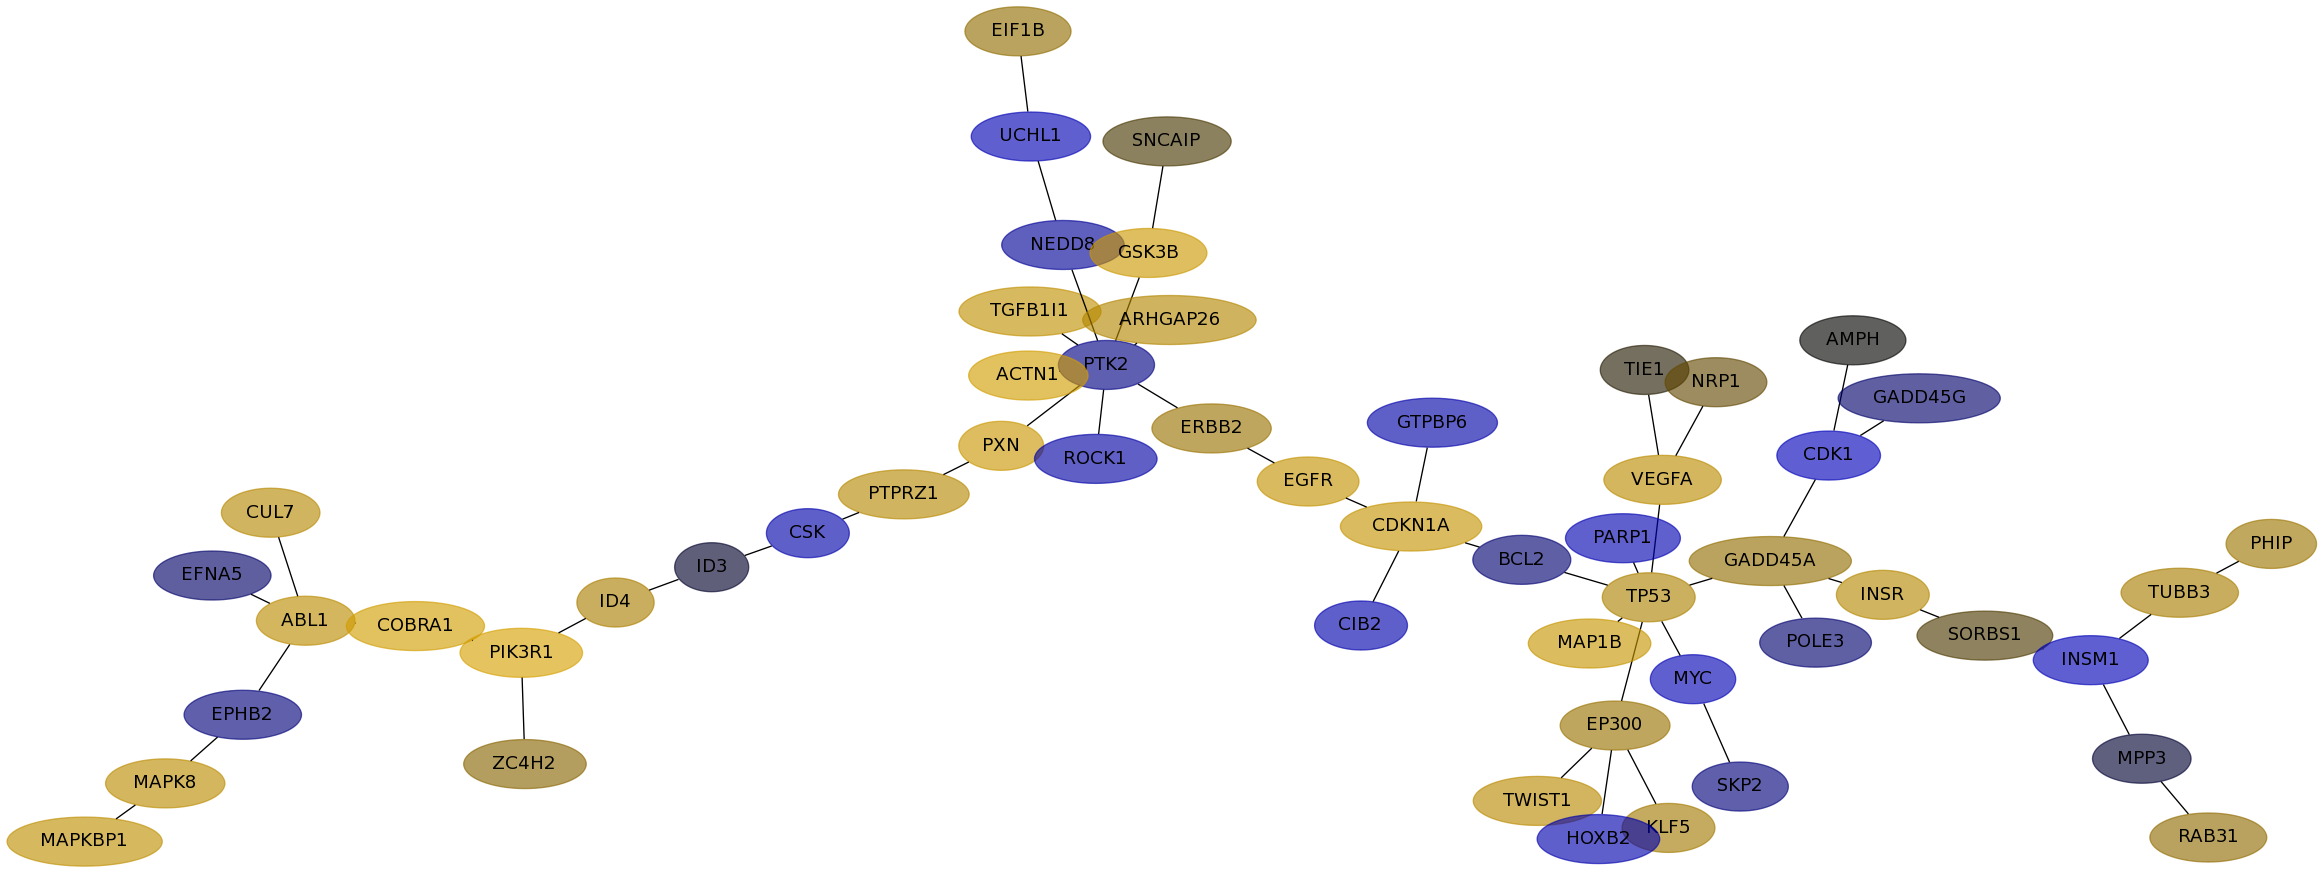
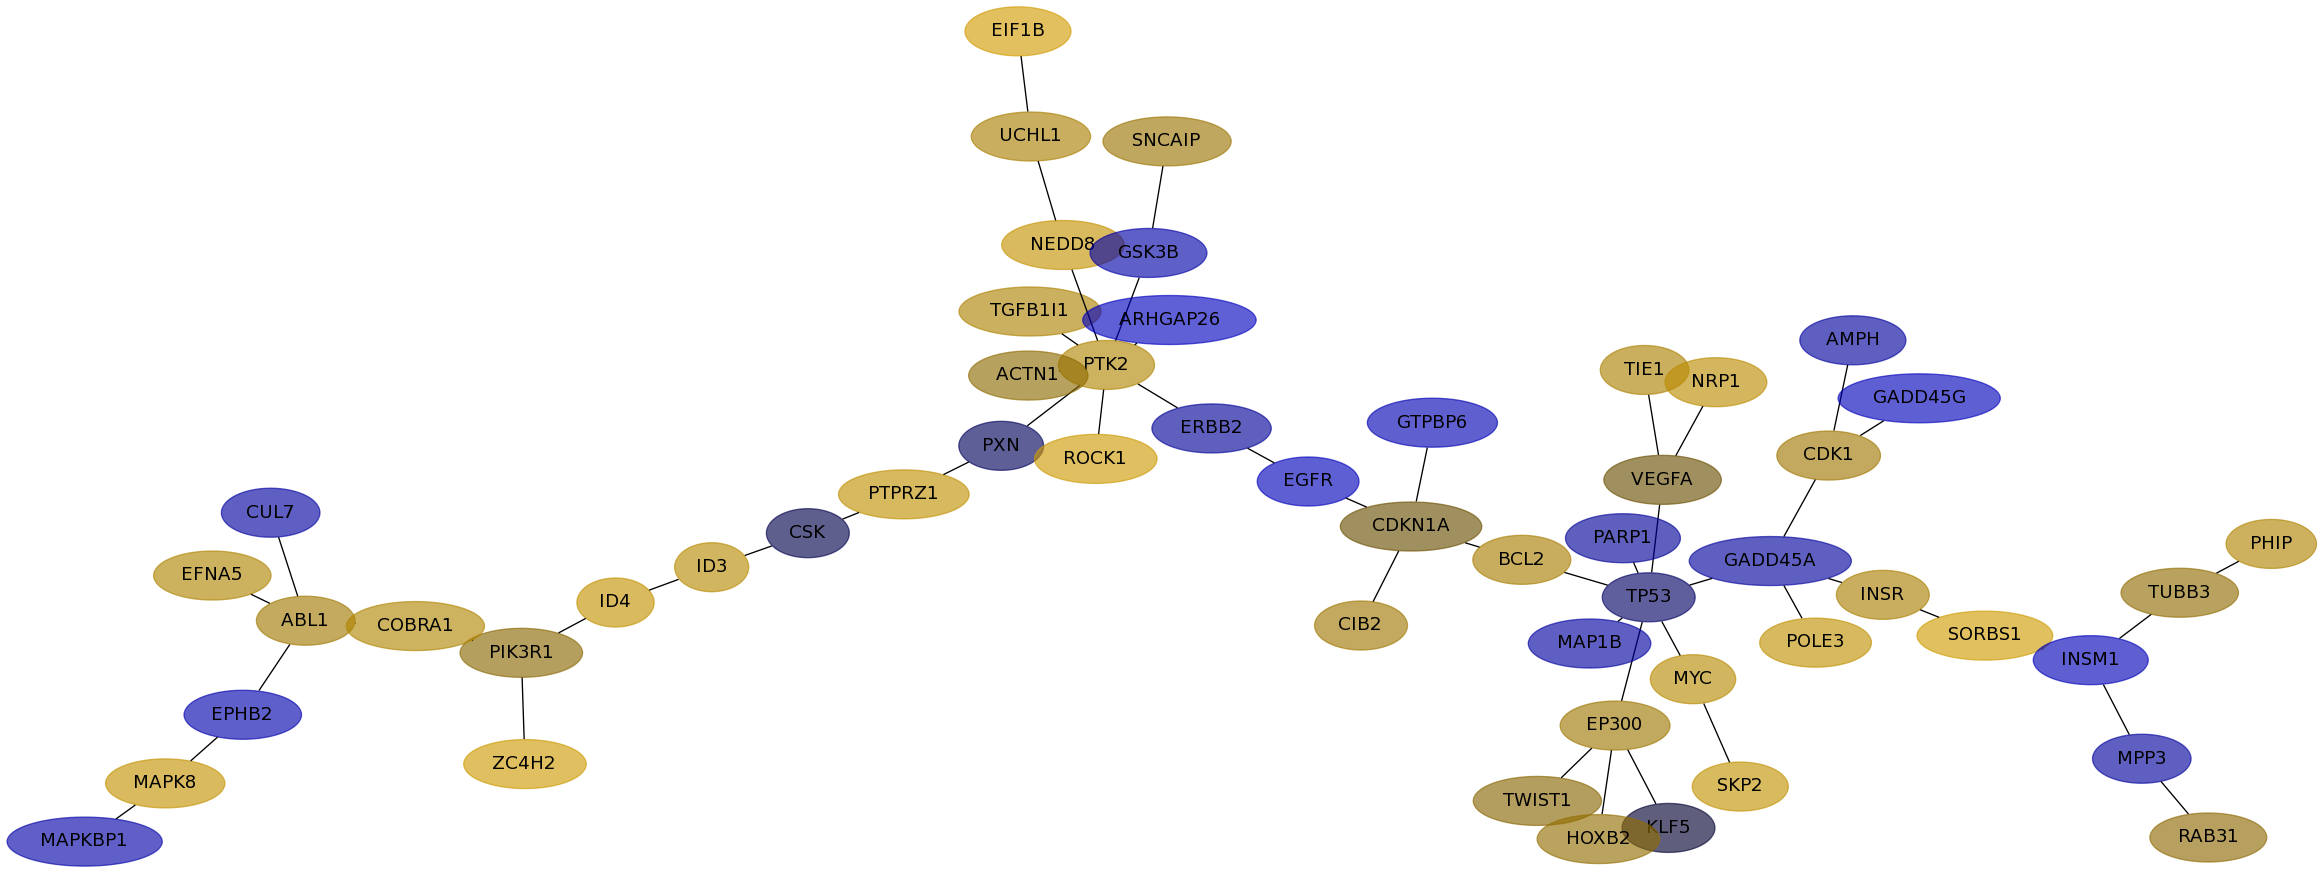
Subnetwork structure for each dataset
- IPC
Score for each gene in subnetwork 6551 in each dataset
| Gene Symbol | Links | Frequency | Frequency Rank | Subnetwork score rank | Global rank |
IPC | Loi | Schmidt | VanDeVijver | Wang |
|---|
| EP300 |   | 113 | 4 | 1 | 4 | -0.149 | 0.087 | 0.102 | 0.052 | 0.025 |
|---|
| MAPK8 | | 8 | 222 | 696 | 677 | 0.153 | 0.200 | 0.249 | -0.066 | 0.138 |
|---|
| ARHGAP26 | | 21 | 73 | 457 | 438 | -0.023 | 0.171 | -0.222 | 0.015 | -0.348 |
|---|
| SORBS1 | | 57 | 19 | 1 | 13 | -0.043 | 0.015 | 0.314 | -0.072 | 0.200 |
|---|
| CUL7 | | 3 | 557 | 1621 | 1593 | -0.157 | 0.176 | -0.108 | -0.006 | 0.104 |
|---|
| GADD45G | | 43 | 25 | 141 | 134 | 0.030 | -0.029 | -0.207 | 0.201 | -0.055 |
|---|
| TP53 | | 85 | 7 | 1 | 6 | -0.167 | 0.148 | -0.027 | 0.252 | 0.147 |
|---|
| CIB2 | | 18 | 86 | 590 | 564 | 0.228 | -0.149 | 0.106 | 0.127 | 0.190 |
|---|
| ERBB2 | | 141 | 1 | 1 | 1 | -0.103 | 0.092 | -0.090 | 0.267 | 0.046 |
|---|
| ID4 | | 35 | 34 | 236 | 223 | -0.179 | 0.137 | 0.241 | undef | 0.036 |
|---|
| CDKN1A | | 110 | 5 | 1 | 5 | 0.064 | 0.254 | 0.030 | undef | 0.082 |
|---|
| MAPKBP1 | | 1 | 1195 | 1650 | 1667 | -0.265 | 0.219 | -0.124 | -0.249 | 0.040 |
|---|
| EIF1B | | 8 | 222 | 1576 | 1529 | 0.149 | 0.075 | 0.332 | -0.017 | -0.070 |
|---|
| HOXB2 | | 33 | 37 | 318 | 289 | 0.024 | -0.143 | 0.076 | 0.247 | -0.184 |
|---|
| ABL1 | | 13 | 124 | 727 | 699 | -0.152 | 0.200 | 0.108 | undef | -0.059 |
|---|
| EPHB2 | | 1 | 1195 | 1650 | 1667 | -0.022 | -0.044 | -0.146 | undef | -0.213 |
|---|
| AMPH | | 7 | 256 | 83 | 102 | 0.082 | 0.000 | -0.104 | 0.024 | 0.241 |
|---|
| MYC | | 72 | 10 | 1 | 8 | -0.101 | -0.169 | 0.188 | undef | -0.134 |
|---|
| PTPRZ1 | | 9 | 196 | 570 | 554 | -0.114 | 0.183 | 0.233 | -0.316 | -0.095 |
|---|
| INSM1 | | 23 | 66 | 570 | 545 | 0.135 | -0.184 | -0.188 | 0.237 | -0.032 |
|---|
| BCL2 | | 37 | 32 | 83 | 82 | -0.077 | -0.035 | 0.128 | -0.106 | 0.043 |
|---|
| TWIST1 | | 50 | 20 | 1 | 14 | 0.044 | 0.194 | 0.061 | undef | 0.219 |
|---|
| POLE3 | | 17 | 95 | 141 | 138 | -0.083 | -0.033 | 0.231 | 0.096 | 0.011 |
|---|
| UCHL1 | | 2 | 743 | 1650 | 1635 | -0.031 | -0.164 | 0.135 | -0.011 | 0.024 |
|---|
| TUBB3 | | 7 | 256 | 764 | 756 | 0.078 | 0.130 | 0.073 | 0.207 | -0.079 |
|---|
| COBRA1 | | 2 | 743 | 1604 | 1588 | 0.137 | 0.335 | 0.159 | 0.134 | -0.016 |
|---|
| PXN | | 12 | 140 | 1 | 36 | -0.088 | 0.284 | -0.022 | 0.060 | 0.114 |
|---|
| PHIP | | 4 | 440 | 906 | 902 | 0.099 | 0.100 | 0.156 | 0.136 | 0.042 |
|---|
| PARP1 | | 29 | 45 | 83 | 84 | -0.036 | -0.162 | -0.089 | 0.238 | 0.012 |
|---|
| ZC4H2 | | 17 | 95 | 570 | 546 | 0.065 | 0.061 | 0.304 | -0.072 | 0.059 |
|---|
| PIK3R1 | | 127 | 2 | 1 | 2 | -0.237 | 0.381 | 0.065 | undef | -0.002 |
|---|
| SKP2 | | 29 | 45 | 1 | 23 | 0.092 | -0.043 | 0.237 | undef | -0.009 |
|---|
| ACTN1 | | 18 | 86 | 318 | 313 | 0.016 | 0.347 | 0.068 | 0.100 | 0.314 |
|---|
| PTK2 | | 4 | 440 | 1437 | 1414 | 0.166 | -0.056 | 0.160 | -0.032 | -0.020 |
|---|
| VEGFA | | 68 | 14 | 83 | 78 | 0.090 | 0.200 | 0.030 | 0.095 | 0.148 |
|---|
| CDK1 | | 63 | 15 | 83 | 79 | 0.265 | -0.195 | 0.106 | 0.088 | 0.031 |
|---|
| EGFR | | 117 | 3 | 1 | 3 | -0.195 | 0.240 | -0.205 | -0.187 | 0.065 |
|---|
| MAP1B | | 69 | 12 | 1 | 9 | -0.123 | 0.263 | -0.107 | 0.304 | 0.100 |
|---|
| NEDD8 | | 4 | 440 | 1650 | 1612 | 0.250 | -0.085 | 0.251 | 0.211 | -0.073 |
|---|
| ID3 | | 9 | 196 | 658 | 637 | 0.072 | -0.006 | 0.192 | -0.023 | 0.057 |
|---|
| INSR | | 96 | 6 | 236 | 221 | 0.063 | 0.173 | 0.135 | -0.014 | -0.072 |
|---|
| GADD45A | | 11 | 148 | 1351 | 1308 | -0.057 | 0.076 | -0.099 | 0.109 | 0.093 |
|---|
| GTPBP6 | | 6 | 301 | 928 | 907 | -0.143 | -0.131 | -0.167 | 0.155 | -0.129 |
|---|
| CSK | | 1 | 1195 | 1650 | 1667 | 0.166 | -0.140 | -0.014 | -0.166 | -0.039 |
|---|
| RAB31 | | 2 | 743 | 1650 | 1635 | 0.028 | 0.073 | 0.067 | 0.018 | 0.338 |
|---|
| GSK3B | | 79 | 8 | 179 | 169 | -0.130 | 0.292 | -0.129 | 0.291 | 0.057 |
|---|
| TIE1 | | 18 | 86 | 366 | 357 | -0.108 | 0.005 | 0.141 | -0.108 | 0.252 |
|---|
| EFNA5 | | 1 | 1195 | 1650 | 1667 | 0.142 | -0.029 | 0.153 | -0.016 | 0.152 |
|---|
| MPP3 | | 4 | 440 | 1650 | 1612 | -0.095 | -0.007 | -0.098 | 0.087 | -0.046 |
|---|
| KLF5 | | 76 | 9 | 1 | 7 | 0.077 | 0.117 | -0.007 | -0.110 | -0.006 |
|---|
| ROCK1 | | 1 | 1195 | 1650 | 1667 | -0.068 | -0.122 | 0.306 | 0.157 | 0.158 |
|---|
| NRP1 | | 8 | 222 | 1222 | 1186 | -0.043 | 0.025 | 0.201 | 0.029 | 0.071 |
|---|
| SNCAIP | | 10 | 167 | 366 | 362 | -0.091 | 0.013 | 0.092 | 0.136 | 0.059 |
|---|
| TGFB1I1 | | 49 | 22 | 1 | 16 | -0.105 | 0.229 | 0.143 | 0.195 | 0.298 |
|---|
GO Enrichment output for subnetwork 6551 in each dataset
| Name | Accession Number | Link | P-val | Corrected P-val |
|---|
| interphase of mitotic cell cycle | GO:0051329 |  | 9.516E-09 | 2.325E-05 |
|---|
| G1/S transition of mitotic cell cycle | GO:0000082 | | 4.163E-08 | 5.085E-05 |
|---|
| insulin receptor signaling pathway | GO:0008286 | | 9.376E-08 | 7.635E-05 |
|---|
| response to UV | GO:0009411 | | 1.249E-07 | 7.626E-05 |
|---|
| focal adhesion formation | GO:0048041 | | 1.469E-07 | 7.178E-05 |
|---|
| release of cytochrome c from mitochondria | GO:0001836 | | 2.951E-07 | 1.202E-04 |
|---|
| response to peptide hormone stimulus | GO:0043434 | | 3.13E-07 | 1.092E-04 |
|---|
| cellular response to insulin stimulus | GO:0032869 | | 5.616E-07 | 1.715E-04 |
|---|
| activation of MAPKK activity | GO:0000186 | | 6.948E-07 | 1.886E-04 |
|---|
| regulation of mitochondrial membrane permeability | GO:0046902 | | 7.321E-07 | 1.789E-04 |
|---|
| leukocyte tethering or rolling | GO:0050901 | | 7.321E-07 | 1.626E-04 |
|---|
| Name | Accession Number | Link | P-val | Corrected P-val |
|---|
| interphase of mitotic cell cycle | GO:0051329 | | 1.3E-08 | 3.128E-05 |
|---|
| interphase | GO:0051325 | | 1.664E-08 | 2.002E-05 |
|---|
| G1/S transition of mitotic cell cycle | GO:0000082 | | 6.401E-08 | 5.133E-05 |
|---|
| insulin receptor signaling pathway | GO:0008286 | | 1.102E-07 | 6.632E-05 |
|---|
| response to UV | GO:0009411 | | 1.528E-07 | 7.354E-05 |
|---|
| focal adhesion formation | GO:0048041 | | 1.972E-07 | 7.907E-05 |
|---|
| response to peptide hormone stimulus | GO:0043434 | | 3.588E-07 | 1.233E-04 |
|---|
| release of cytochrome c from mitochondria | GO:0001836 | | 3.959E-07 | 1.191E-04 |
|---|
| cellular response to insulin stimulus | GO:0032869 | | 7.018E-07 | 1.876E-04 |
|---|
| regulation of mitochondrial membrane permeability | GO:0046902 | | 9.147E-07 | 2.201E-04 |
|---|
| leukocyte tethering or rolling | GO:0050901 | | 9.147E-07 | 2.001E-04 |
|---|
| Name | Accession Number | Link | P-val | Corrected P-val |
|---|
| interphase of mitotic cell cycle | GO:0051329 | | 2.112E-08 | 4.859E-05 |
|---|
| interphase | GO:0051325 | | 2.536E-08 | 2.917E-05 |
|---|
| G1/S transition of mitotic cell cycle | GO:0000082 | | 1.138E-07 | 8.723E-05 |
|---|
| insulin receptor signaling pathway | GO:0008286 | | 1.669E-07 | 9.596E-05 |
|---|
| response to UV | GO:0009411 | | 1.725E-07 | 7.937E-05 |
|---|
| focal adhesion formation | GO:0048041 | | 2.623E-07 | 1.005E-04 |
|---|
| response to peptide hormone stimulus | GO:0043434 | | 6.371E-07 | 2.093E-04 |
|---|
| release of cytochrome c from mitochondria | GO:0001836 | | 7.856E-07 | 2.259E-04 |
|---|
| cellular response to insulin stimulus | GO:0032869 | | 1.047E-06 | 2.675E-04 |
|---|
| regulation of mitochondrial membrane permeability | GO:0046902 | | 1.542E-06 | 3.548E-04 |
|---|
| leukocyte tethering or rolling | GO:0050901 | | 1.542E-06 | 3.225E-04 |
|---|
VanDeVijver file
| Name | Accession Number | Link | P-val | Corrected P-val |
|---|
| regulation of anatomical structure morphogenesis | GO:0022603 | | 3.435E-07 | 6.331E-04 |
|---|
| axonogenesis | GO:0007409 | | 9.228E-07 | 8.504E-04 |
|---|
| response to peptide hormone stimulus | GO:0043434 | | 9.694E-07 | 5.955E-04 |
|---|
| insulin receptor signaling pathway | GO:0008286 | | 1.034E-06 | 4.765E-04 |
|---|
| positive regulation of cell migration | GO:0030335 | | 1.303E-06 | 4.802E-04 |
|---|
| cell morphogenesis involved in neuron differentiation | GO:0048667 | | 1.468E-06 | 4.51E-04 |
|---|
| T cell lineage commitment | GO:0002360 | | 1.543E-06 | 4.063E-04 |
|---|
| cell part morphogenesis | GO:0032990 | | 1.906E-06 | 4.391E-04 |
|---|
| positive regulation of cell motion | GO:0051272 | | 1.966E-06 | 4.026E-04 |
|---|
| regulation of cell migration | GO:0030334 | | 2.074E-06 | 3.822E-04 |
|---|
| ER overload response | GO:0006983 | | 3.074E-06 | 5.151E-04 |
|---|
| Name | Accession Number | Link | P-val | Corrected P-val |
|---|
| interphase of mitotic cell cycle | GO:0051329 | | 2.112E-08 | 4.859E-05 |
|---|
| interphase | GO:0051325 | | 2.536E-08 | 2.917E-05 |
|---|
| G1/S transition of mitotic cell cycle | GO:0000082 | | 1.138E-07 | 8.723E-05 |
|---|
| insulin receptor signaling pathway | GO:0008286 | | 1.669E-07 | 9.596E-05 |
|---|
| response to UV | GO:0009411 | | 1.725E-07 | 7.937E-05 |
|---|
| focal adhesion formation | GO:0048041 | | 2.623E-07 | 1.005E-04 |
|---|
| response to peptide hormone stimulus | GO:0043434 | | 6.371E-07 | 2.093E-04 |
|---|
| release of cytochrome c from mitochondria | GO:0001836 | | 7.856E-07 | 2.259E-04 |
|---|
| cellular response to insulin stimulus | GO:0032869 | | 1.047E-06 | 2.675E-04 |
|---|
| regulation of mitochondrial membrane permeability | GO:0046902 | | 1.542E-06 | 3.548E-04 |
|---|
| leukocyte tethering or rolling | GO:0050901 | | 1.542E-06 | 3.225E-04 |
|---|

