Study VanDeVijver-ER-pos
Study informations
14 subnetworks in total page | file
272 genes associated page | file
Enriched GO terms page
General informations
General Index page
Study Index page
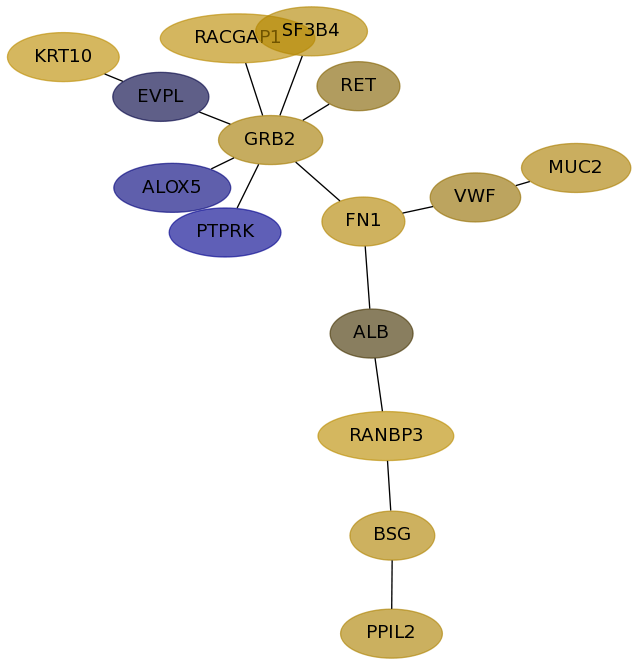
Subnetwork 69
score
| Dataset | Score | P-val 1 | P-val 2 | P-val 3 | Fisher Score |
|---|
| Desmedt | 0.5254 | 0.000e+00 | 0.000e+00 | 3.020e-04 | 0.000e+00 |
|---|
| IPC | 0.3988 | 1.903e-01 | 1.784e-01 | 9.641e-01 | 3.274e-02 |
|---|
| Loi | 0.5122 | 0.000e+00 | 0.000e+00 | 2.385e-03 | 0.000e+00 |
|---|
| Schmidt | 0.3051 | 9.285e-03 | 2.215e-03 | 2.279e-01 | 4.687e-06 |
|---|
| Wang | 0.3132 | 5.800e-04 | 2.500e-05 | 1.230e-01 | 1.784e-09 |
|---|
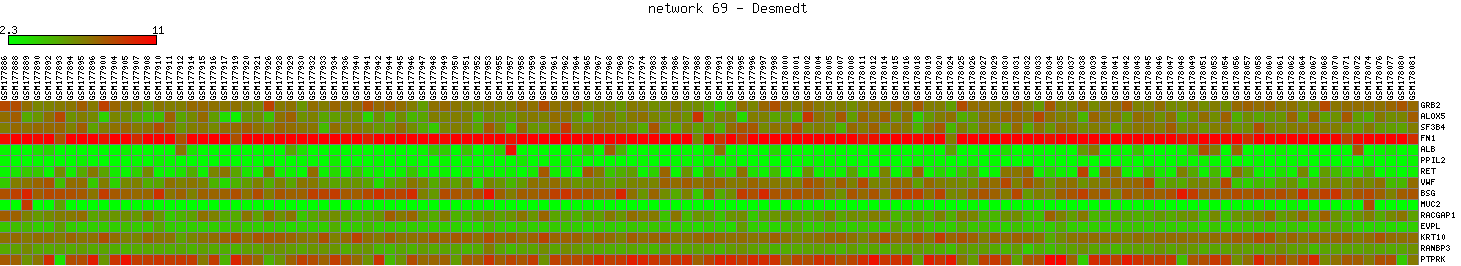
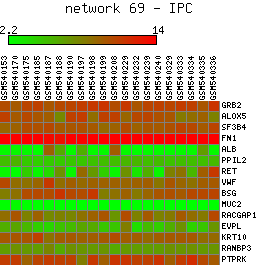
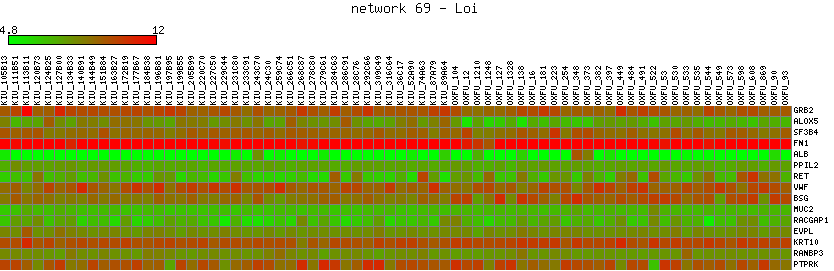
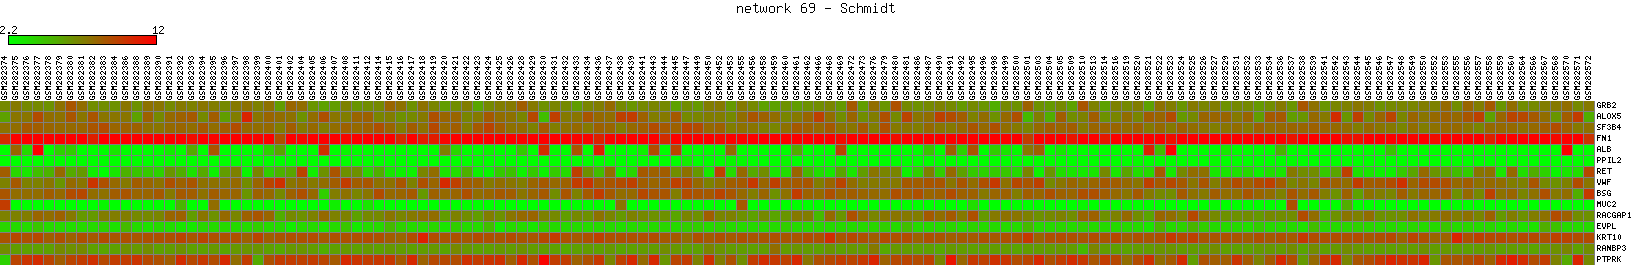
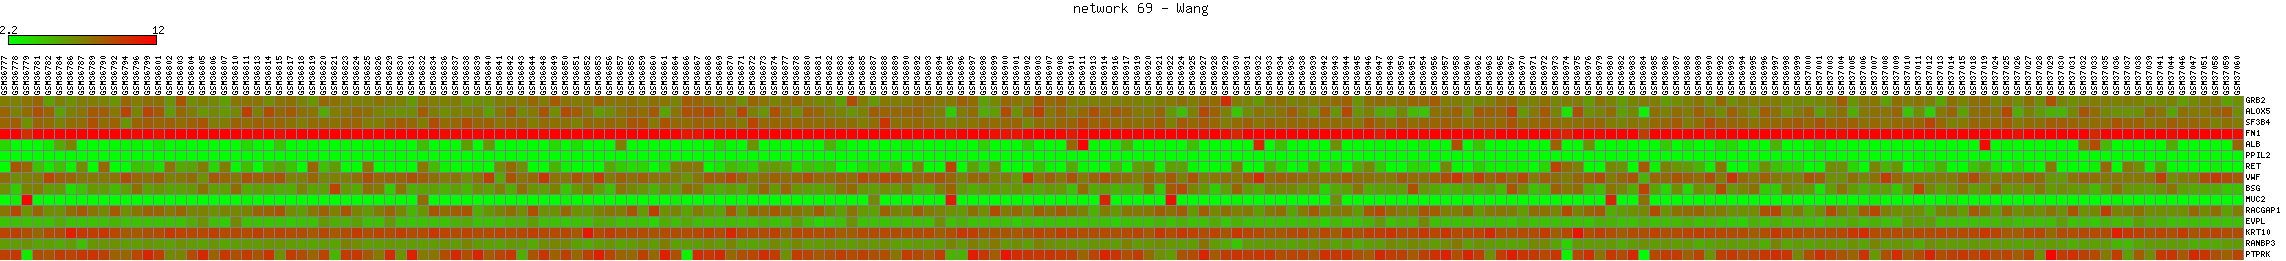
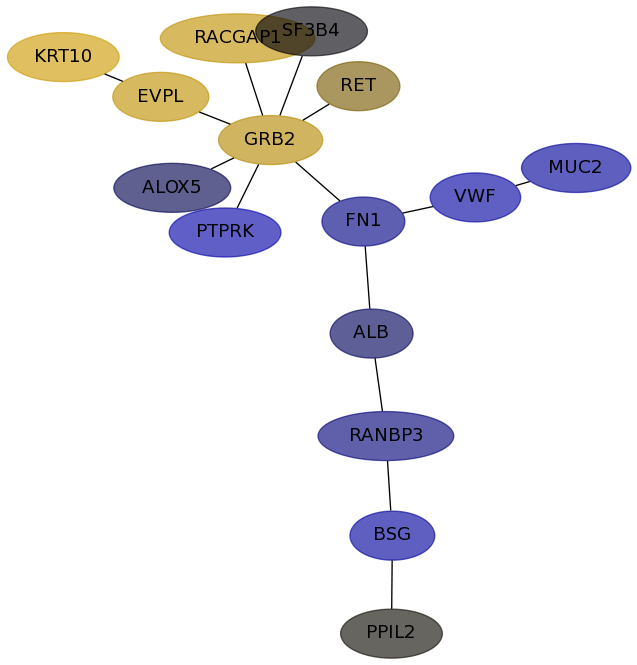
Expression data for subnetwork 69 in each dataset
Desmedt |
IPC |
Loi |
Schmidt |
Wang |
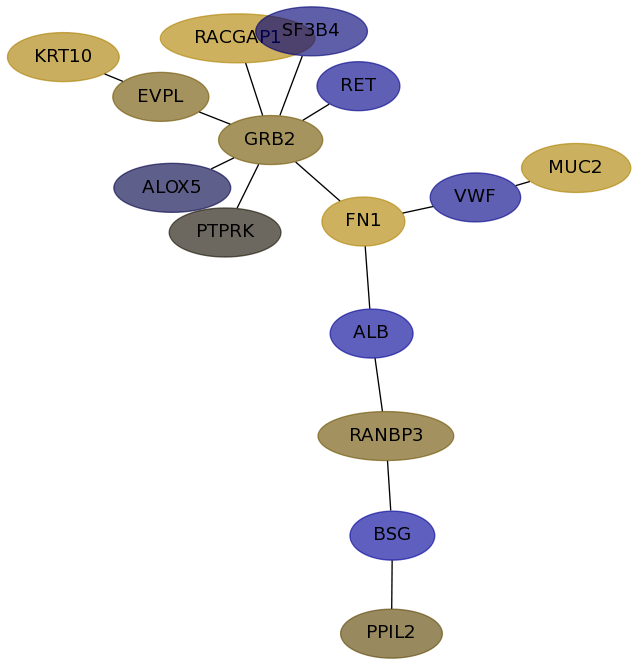
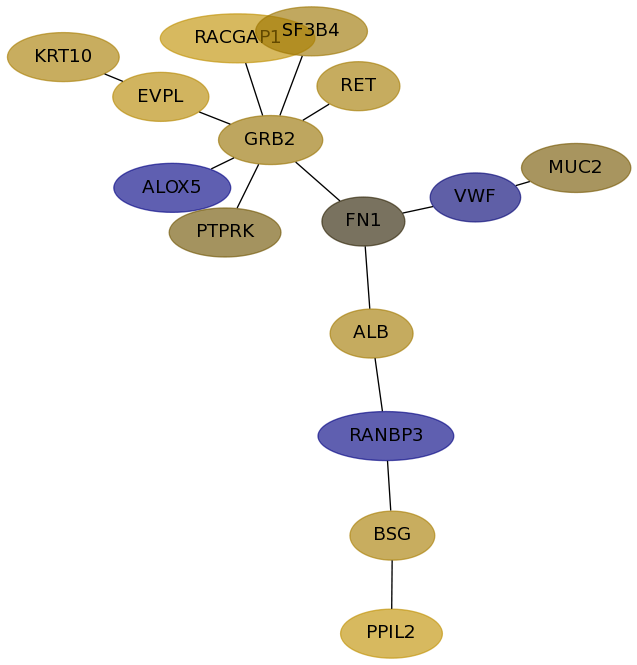
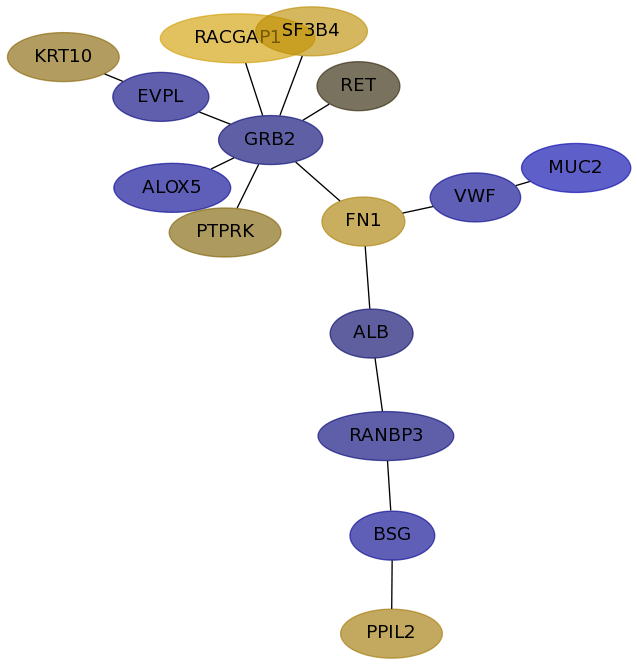
Subnetwork structure for each dataset
- Desmedt
Score for each gene in subnetwork 69 in each dataset
| Gene Symbol | Links | Frequency | Frequency Rank | Subnetwork score rank | Global rank |
Desmedt | IPC | Loi | Schmidt | Wang |
|---|
| GRB2 |   | 7 | 1 | 80 | 80 | 0.121 | 0.037 | 0.087 | 0.182 | -0.037 |
|---|
| ALOX5 | | 1 | 59 | 194 | 195 | -0.046 | -0.013 | -0.055 | -0.016 | -0.074 |
|---|
| SF3B4 | | 1 | 59 | 194 | 195 | 0.171 | -0.041 | 0.100 | -0.001 | 0.205 |
|---|
| FN1 | | 3 | 13 | 80 | 84 | 0.167 | 0.154 | 0.006 | -0.056 | 0.137 |
|---|
| ALB | | 5 | 4 | 80 | 81 | 0.012 | -0.085 | 0.115 | -0.022 | -0.027 |
|---|
| PPIL2 | | 1 | 59 | 194 | 195 | 0.148 | 0.021 | 0.223 | 0.002 | 0.105 |
|---|
| RET | | 4 | 6 | 167 | 167 | 0.055 | -0.063 | 0.119 | 0.041 | 0.006 |
|---|
| VWF | | 3 | 13 | 36 | 37 | 0.081 | -0.060 | -0.038 | -0.112 | -0.069 |
|---|
| BSG | | 1 | 59 | 194 | 195 | 0.156 | -0.093 | 0.128 | -0.100 | -0.071 |
|---|
| MUC2 | | 1 | 59 | 194 | 195 | 0.137 | 0.143 | 0.039 | -0.092 | -0.136 |
|---|
| RACGAP1 | | 3 | 13 | 110 | 111 | 0.199 | 0.154 | 0.232 | 0.232 | 0.337 |
|---|
| EVPL | | 3 | 13 | 80 | 84 | -0.011 | 0.035 | 0.178 | 0.232 | -0.047 |
|---|
| KRT10 | | 1 | 59 | 194 | 195 | 0.210 | 0.137 | 0.127 | 0.304 | 0.056 |
|---|
| RANBP3 | | 2 | 27 | 194 | 194 | 0.206 | 0.033 | -0.052 | -0.043 | -0.041 |
|---|
| PTPRK | | 1 | 59 | 194 | 195 | -0.067 | 0.003 | 0.034 | -0.125 | 0.048 |
|---|
GO Enrichment output for subnetwork 69 in each dataset
| Name | Accession Number | Link | P-val | Corrected P-val |
|---|
| peptide cross-linking | GO:0018149 |  | 3.293E-06 | 7.575E-03 |
|---|
| enteric nervous system development | GO:0048484 | | 2.649E-05 | 0.03046171 |
|---|
| cytokinesis during cell cycle | GO:0033205 | | 3.969E-05 | 0.03043035 |
|---|
| interaction with symbiont | GO:0051702 | | 3.969E-05 | 0.02282276 |
|---|
| neuroblast proliferation | GO:0007405 | | 5.551E-05 | 0.02553518 |
|---|
| mitochondrion localization | GO:0051646 | | 7.394E-05 | 0.02834322 |
|---|
| sulfate transport | GO:0008272 | | 1.186E-04 | 0.0389639 |
|---|
| autonomic nervous system development | GO:0048483 | | 1.736E-04 | 0.04990082 |
|---|
| neuron maturation | GO:0042551 | | 2.388E-04 | 0.06103214 |
|---|
| cellular response to starvation | GO:0009267 | | 2.388E-04 | 0.05492892 |
|---|
| cell killing | GO:0001906 | | 2.388E-04 | 0.04993538 |
|---|
| Name | Accession Number | Link | P-val | Corrected P-val |
|---|
| peptide cross-linking | GO:0018149 | | 1.467E-06 | 3.584E-03 |
|---|
| enteric nervous system development | GO:0048484 | | 1.36E-05 | 0.01661225 |
|---|
| interaction with symbiont | GO:0051702 | | 2.038E-05 | 0.01659979 |
|---|
| cytokinesis during cell cycle | GO:0033205 | | 2.852E-05 | 0.0174167 |
|---|
| mitochondrion localization | GO:0051646 | | 4.881E-05 | 0.02384995 |
|---|
| neuroblast proliferation | GO:0007405 | | 7.446E-05 | 0.030319 |
|---|
| autonomic nervous system development | GO:0048483 | | 8.929E-05 | 0.03116187 |
|---|
| sulfate transport | GO:0008272 | | 1.417E-04 | 0.04328125 |
|---|
| cell killing | GO:0001906 | | 1.417E-04 | 0.03847222 |
|---|
| protein polyubiquitination | GO:0000209 | | 1.619E-04 | 0.03954177 |
|---|
| neural crest cell migration | GO:0001755 | | 2.061E-04 | 0.04576383 |
|---|
| Name | Accession Number | Link | P-val | Corrected P-val |
|---|
| peptide cross-linking | GO:0018149 | | 2.072E-06 | 4.986E-03 |
|---|
| enteric nervous system development | GO:0048484 | | 1.716E-05 | 0.02063882 |
|---|
| interaction with symbiont | GO:0051702 | | 2.571E-05 | 0.02062146 |
|---|
| cytokinesis during cell cycle | GO:0033205 | | 3.597E-05 | 0.02163433 |
|---|
| mitochondrion localization | GO:0051646 | | 6.155E-05 | 0.02962006 |
|---|
| neuroblast proliferation | GO:0007405 | | 9.388E-05 | 0.03764734 |
|---|
| autonomic nervous system development | GO:0048483 | | 1.126E-04 | 0.03869043 |
|---|
| sulfate transport | GO:0008272 | | 1.786E-04 | 0.05372315 |
|---|
| cell killing | GO:0001906 | | 1.786E-04 | 0.04775391 |
|---|
| protein polyubiquitination | GO:0000209 | | 2.04E-04 | 0.04907703 |
|---|
| neural crest cell migration | GO:0001755 | | 2.31E-04 | 0.05052173 |
|---|
| Name | Accession Number | Link | P-val | Corrected P-val |
|---|
| peptide cross-linking | GO:0018149 | | 3.293E-06 | 7.575E-03 |
|---|
| enteric nervous system development | GO:0048484 | | 2.649E-05 | 0.03046171 |
|---|
| cytokinesis during cell cycle | GO:0033205 | | 3.969E-05 | 0.03043035 |
|---|
| interaction with symbiont | GO:0051702 | | 3.969E-05 | 0.02282276 |
|---|
| neuroblast proliferation | GO:0007405 | | 5.551E-05 | 0.02553518 |
|---|
| mitochondrion localization | GO:0051646 | | 7.394E-05 | 0.02834322 |
|---|
| sulfate transport | GO:0008272 | | 1.186E-04 | 0.0389639 |
|---|
| autonomic nervous system development | GO:0048483 | | 1.736E-04 | 0.04990082 |
|---|
| neuron maturation | GO:0042551 | | 2.388E-04 | 0.06103214 |
|---|
| cellular response to starvation | GO:0009267 | | 2.388E-04 | 0.05492892 |
|---|
| cell killing | GO:0001906 | | 2.388E-04 | 0.04993538 |
|---|
| Name | Accession Number | Link | P-val | Corrected P-val |
|---|
| peptide cross-linking | GO:0018149 | | 3.293E-06 | 7.575E-03 |
|---|
| enteric nervous system development | GO:0048484 | | 2.649E-05 | 0.03046171 |
|---|
| cytokinesis during cell cycle | GO:0033205 | | 3.969E-05 | 0.03043035 |
|---|
| interaction with symbiont | GO:0051702 | | 3.969E-05 | 0.02282276 |
|---|
| neuroblast proliferation | GO:0007405 | | 5.551E-05 | 0.02553518 |
|---|
| mitochondrion localization | GO:0051646 | | 7.394E-05 | 0.02834322 |
|---|
| sulfate transport | GO:0008272 | | 1.186E-04 | 0.0389639 |
|---|
| autonomic nervous system development | GO:0048483 | | 1.736E-04 | 0.04990082 |
|---|
| neuron maturation | GO:0042551 | | 2.388E-04 | 0.06103214 |
|---|
| cellular response to starvation | GO:0009267 | | 2.388E-04 | 0.05492892 |
|---|
| cell killing | GO:0001906 | | 2.388E-04 | 0.04993538 |
|---|

