Study VanDeVijver-ER-pos
Study informations
14 subnetworks in total page | file
272 genes associated page | file
Enriched GO terms page
General informations
General Index page
Study Index page
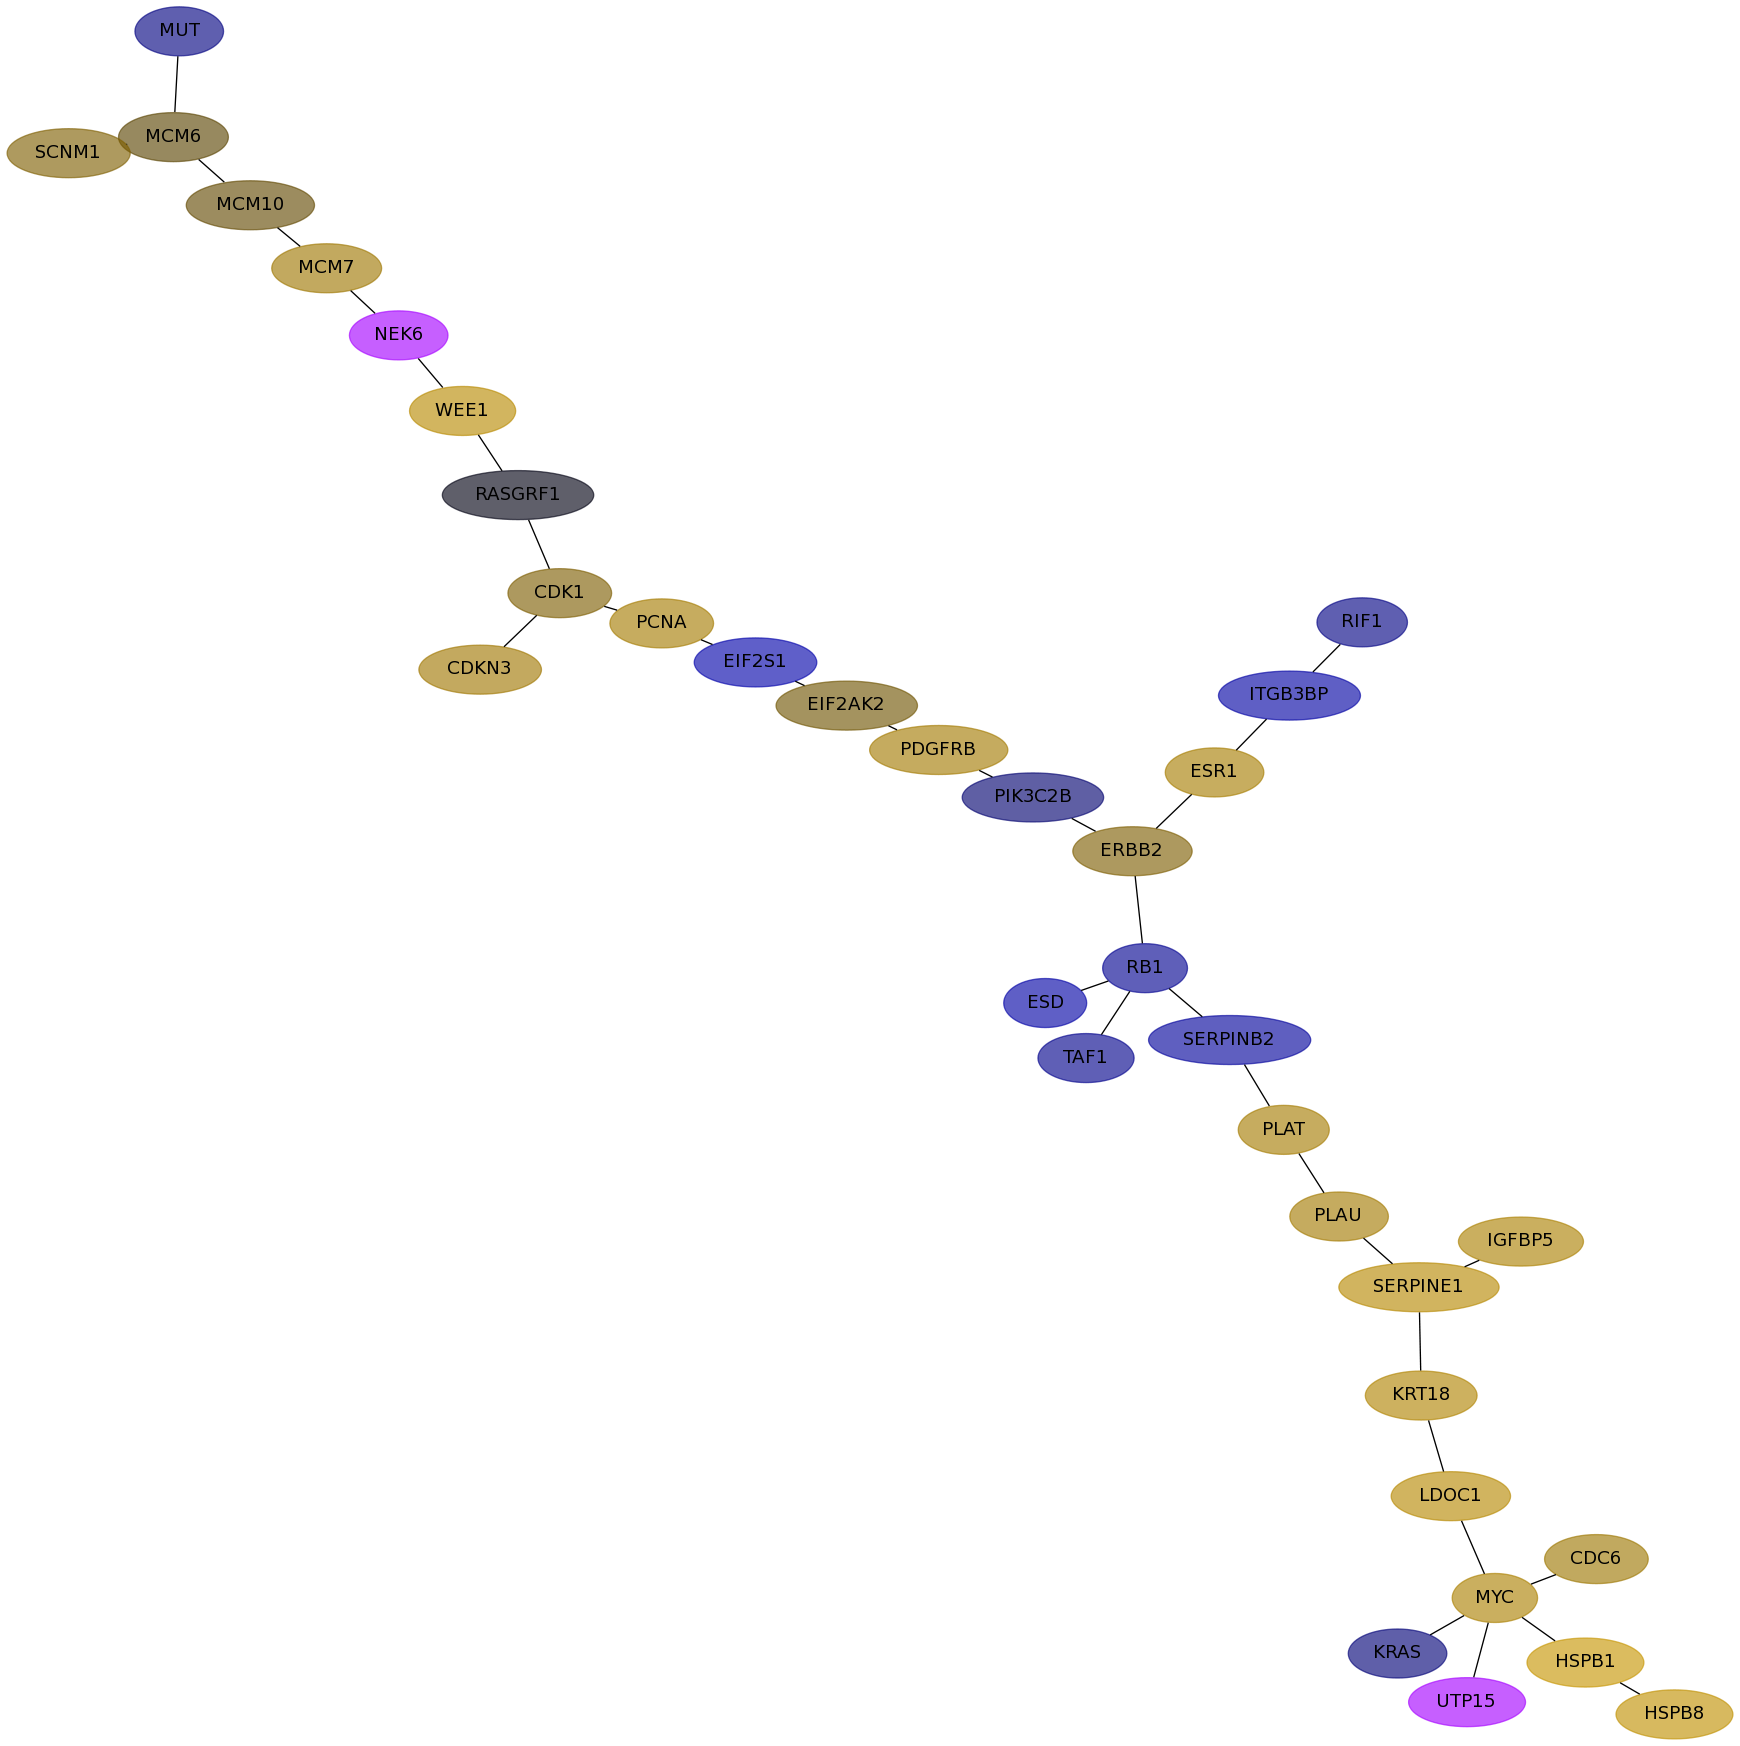
Subnetwork 139
score
| Dataset | Score | P-val 1 | P-val 2 | P-val 3 | Fisher Score |
|---|
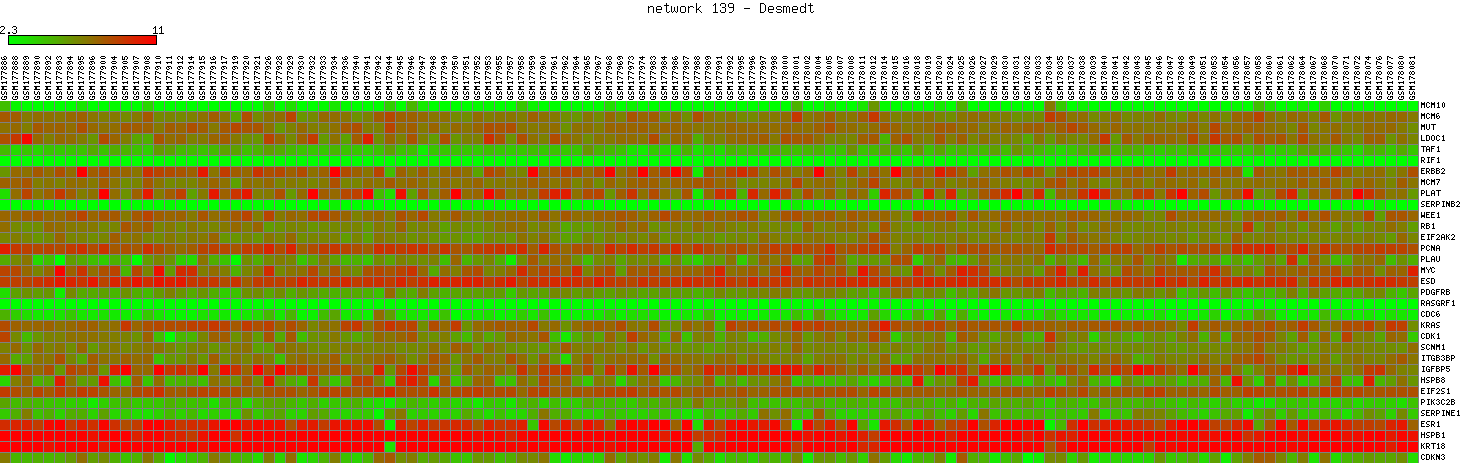
| Desmedt | 0.5243 | 0.000e+00 | 0.000e+00 | 3.240e-04 | 0.000e+00 |
|---|
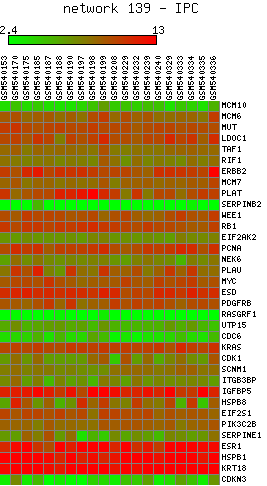
| IPC | 0.6058 | 1.447e-02 | 7.298e-03 | 9.307e-01 | 9.831e-05 |
|---|
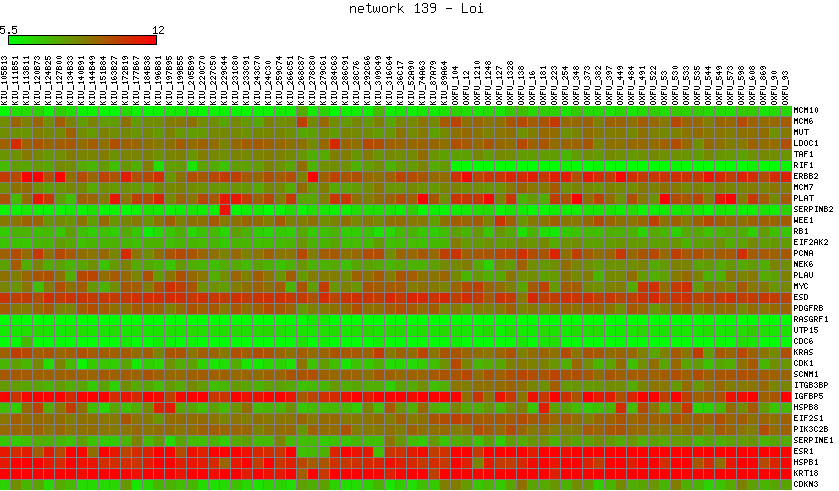
| Loi | 0.4841 | 0.000e+00 | 1.000e-06 | 4.442e-03 | 0.000e+00 |
|---|
| Schmidt | 0.2917 | 1.470e-02 | 4.135e-03 | 3.006e-01 | 1.827e-05 |
|---|
| Wang | 0.3385 | 1.280e-04 | 3.000e-06 | 5.040e-02 | 1.935e-11 |
|---|
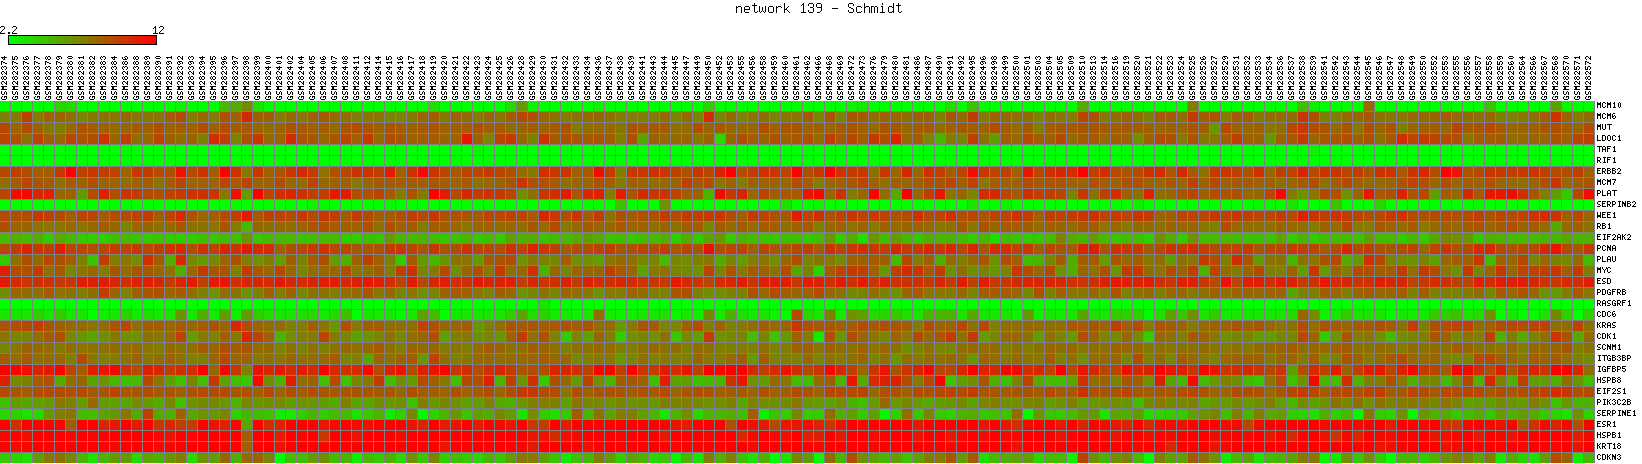
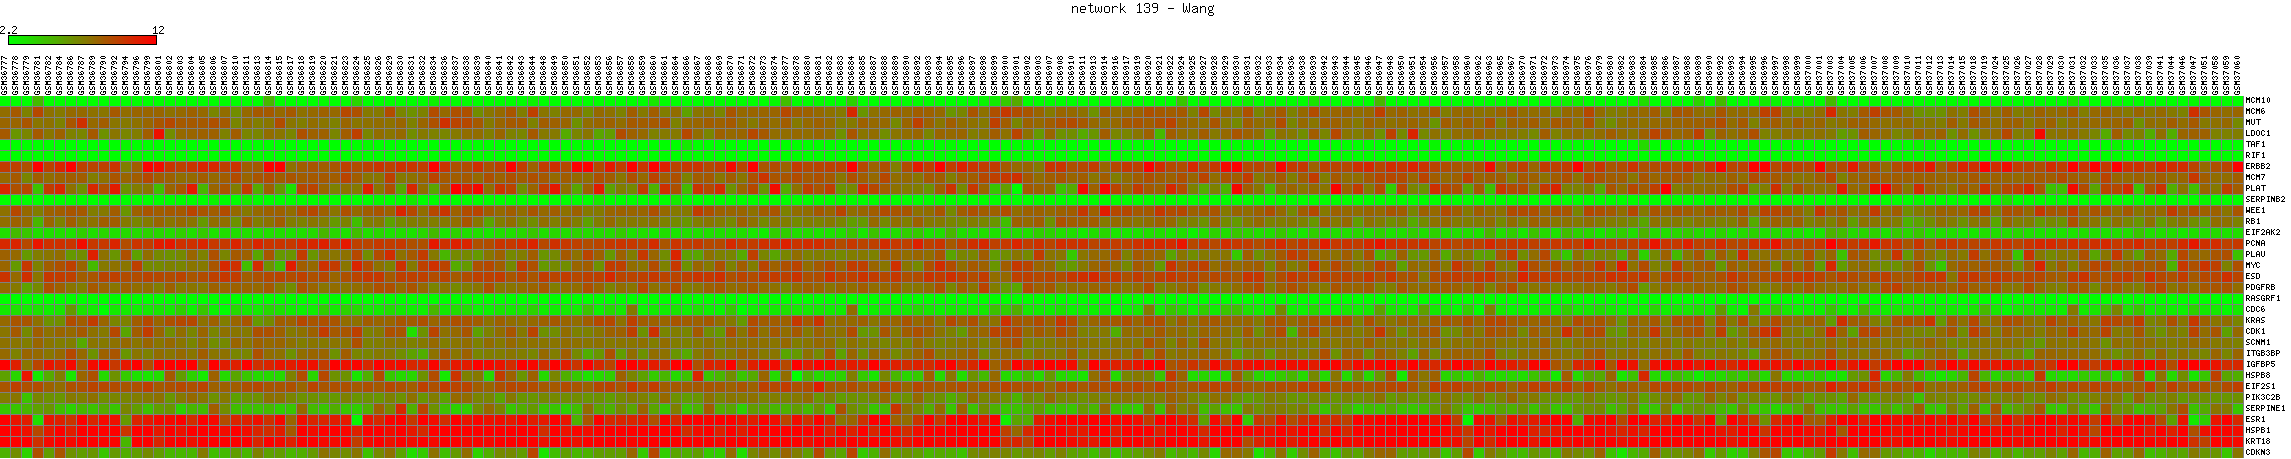
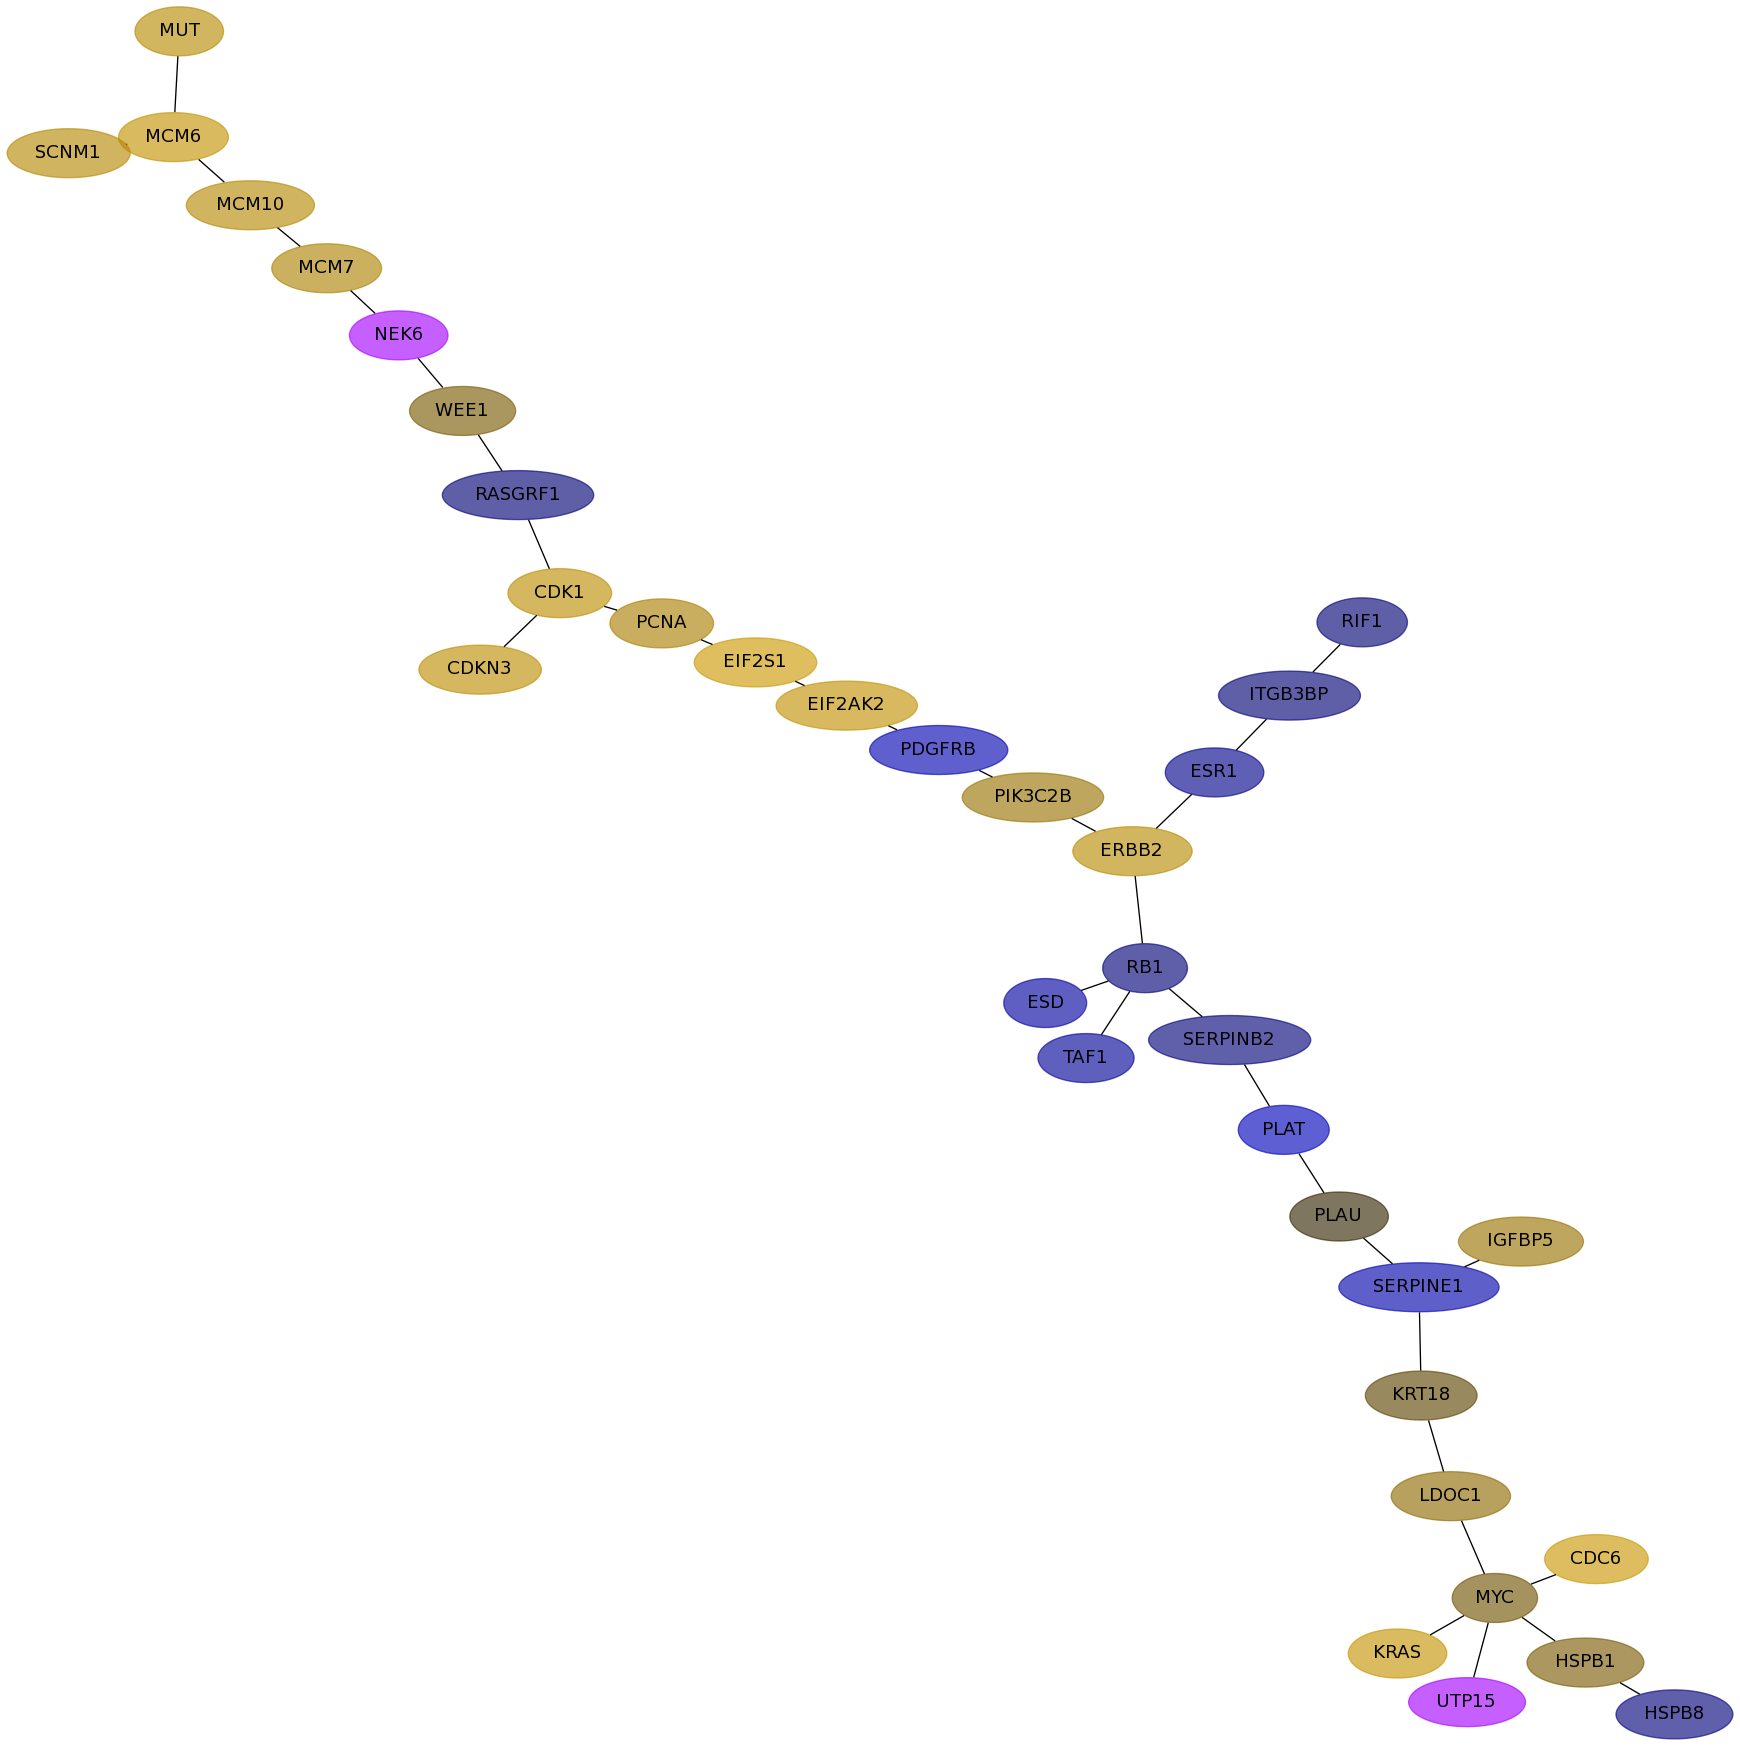
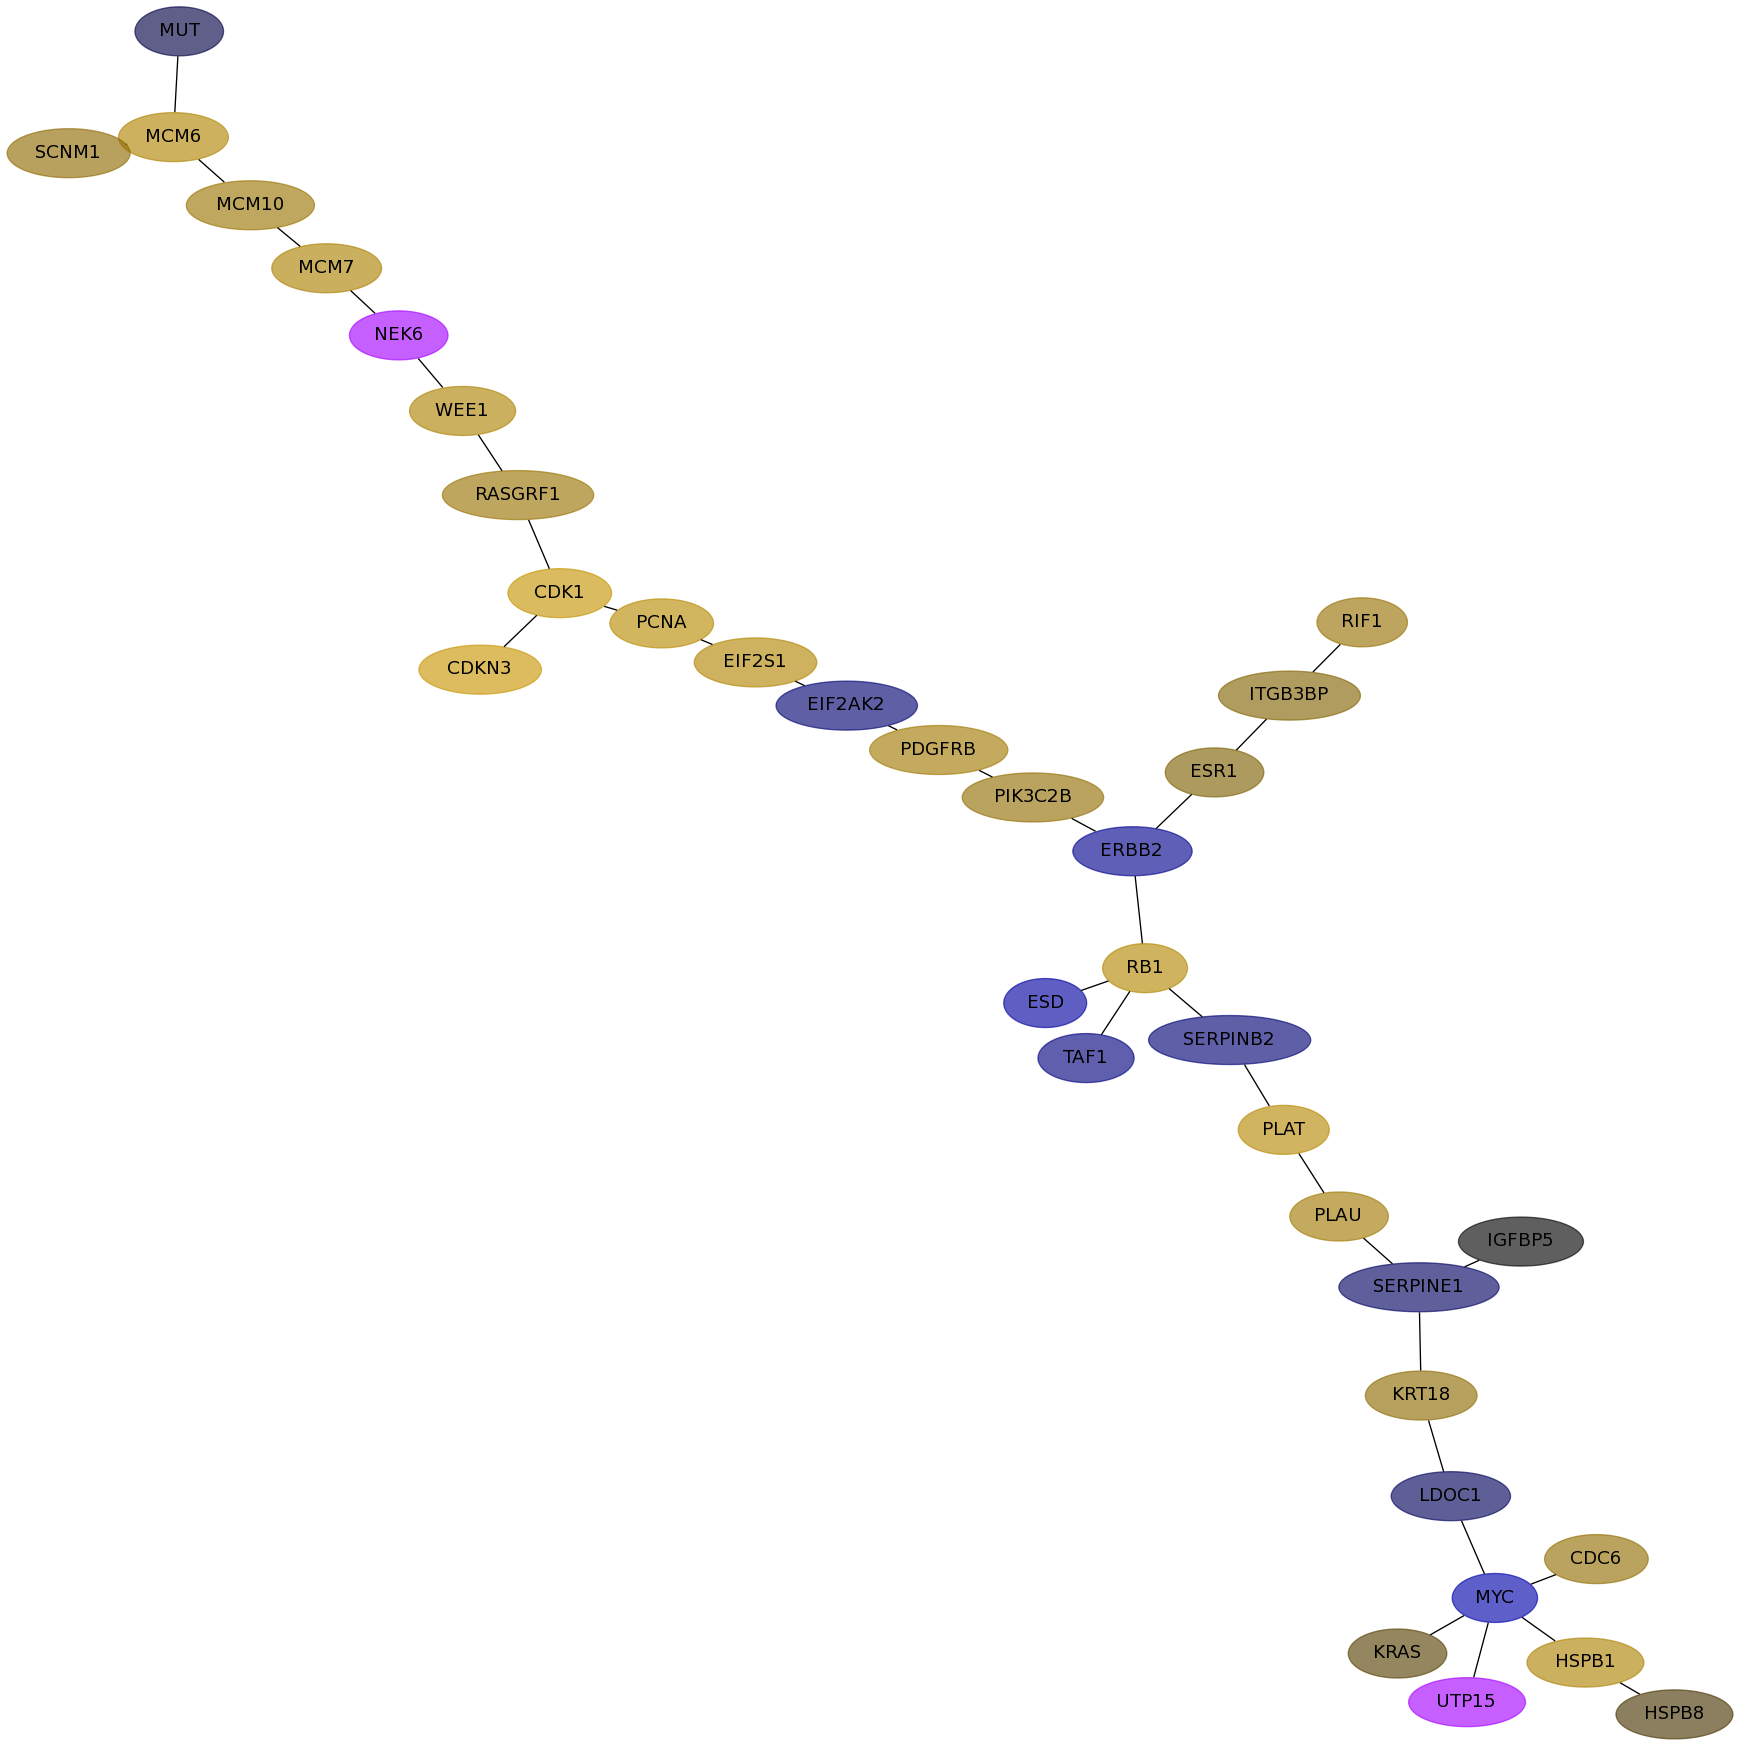
Expression data for subnetwork 139 in each dataset
Desmedt |
IPC |
Loi |
Schmidt |
Wang |
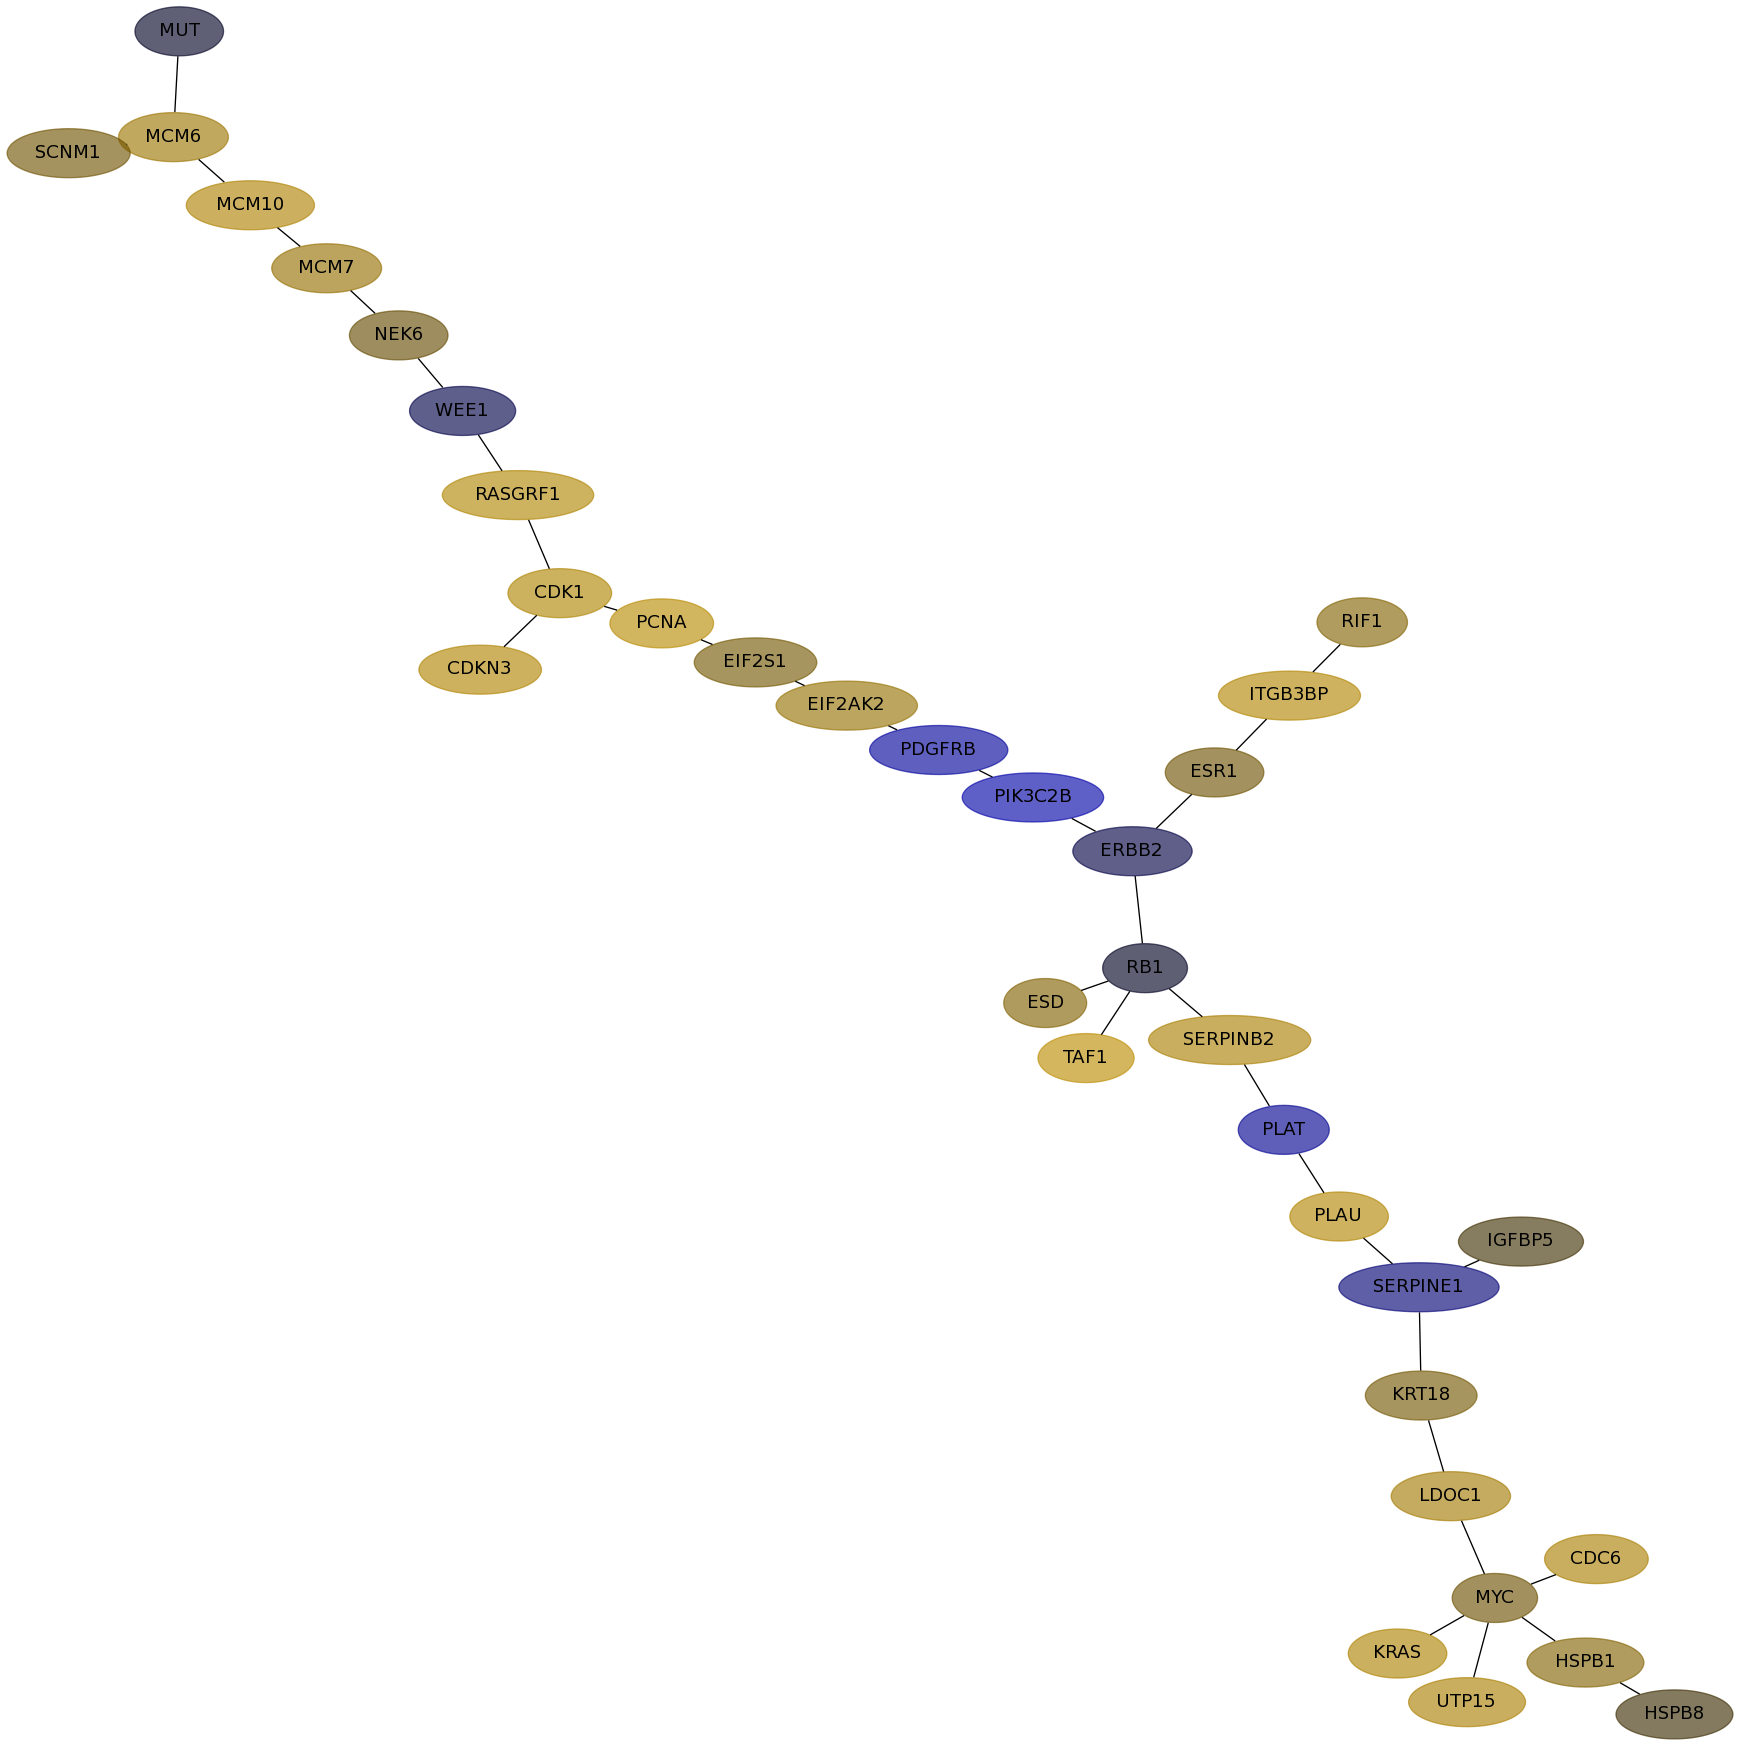
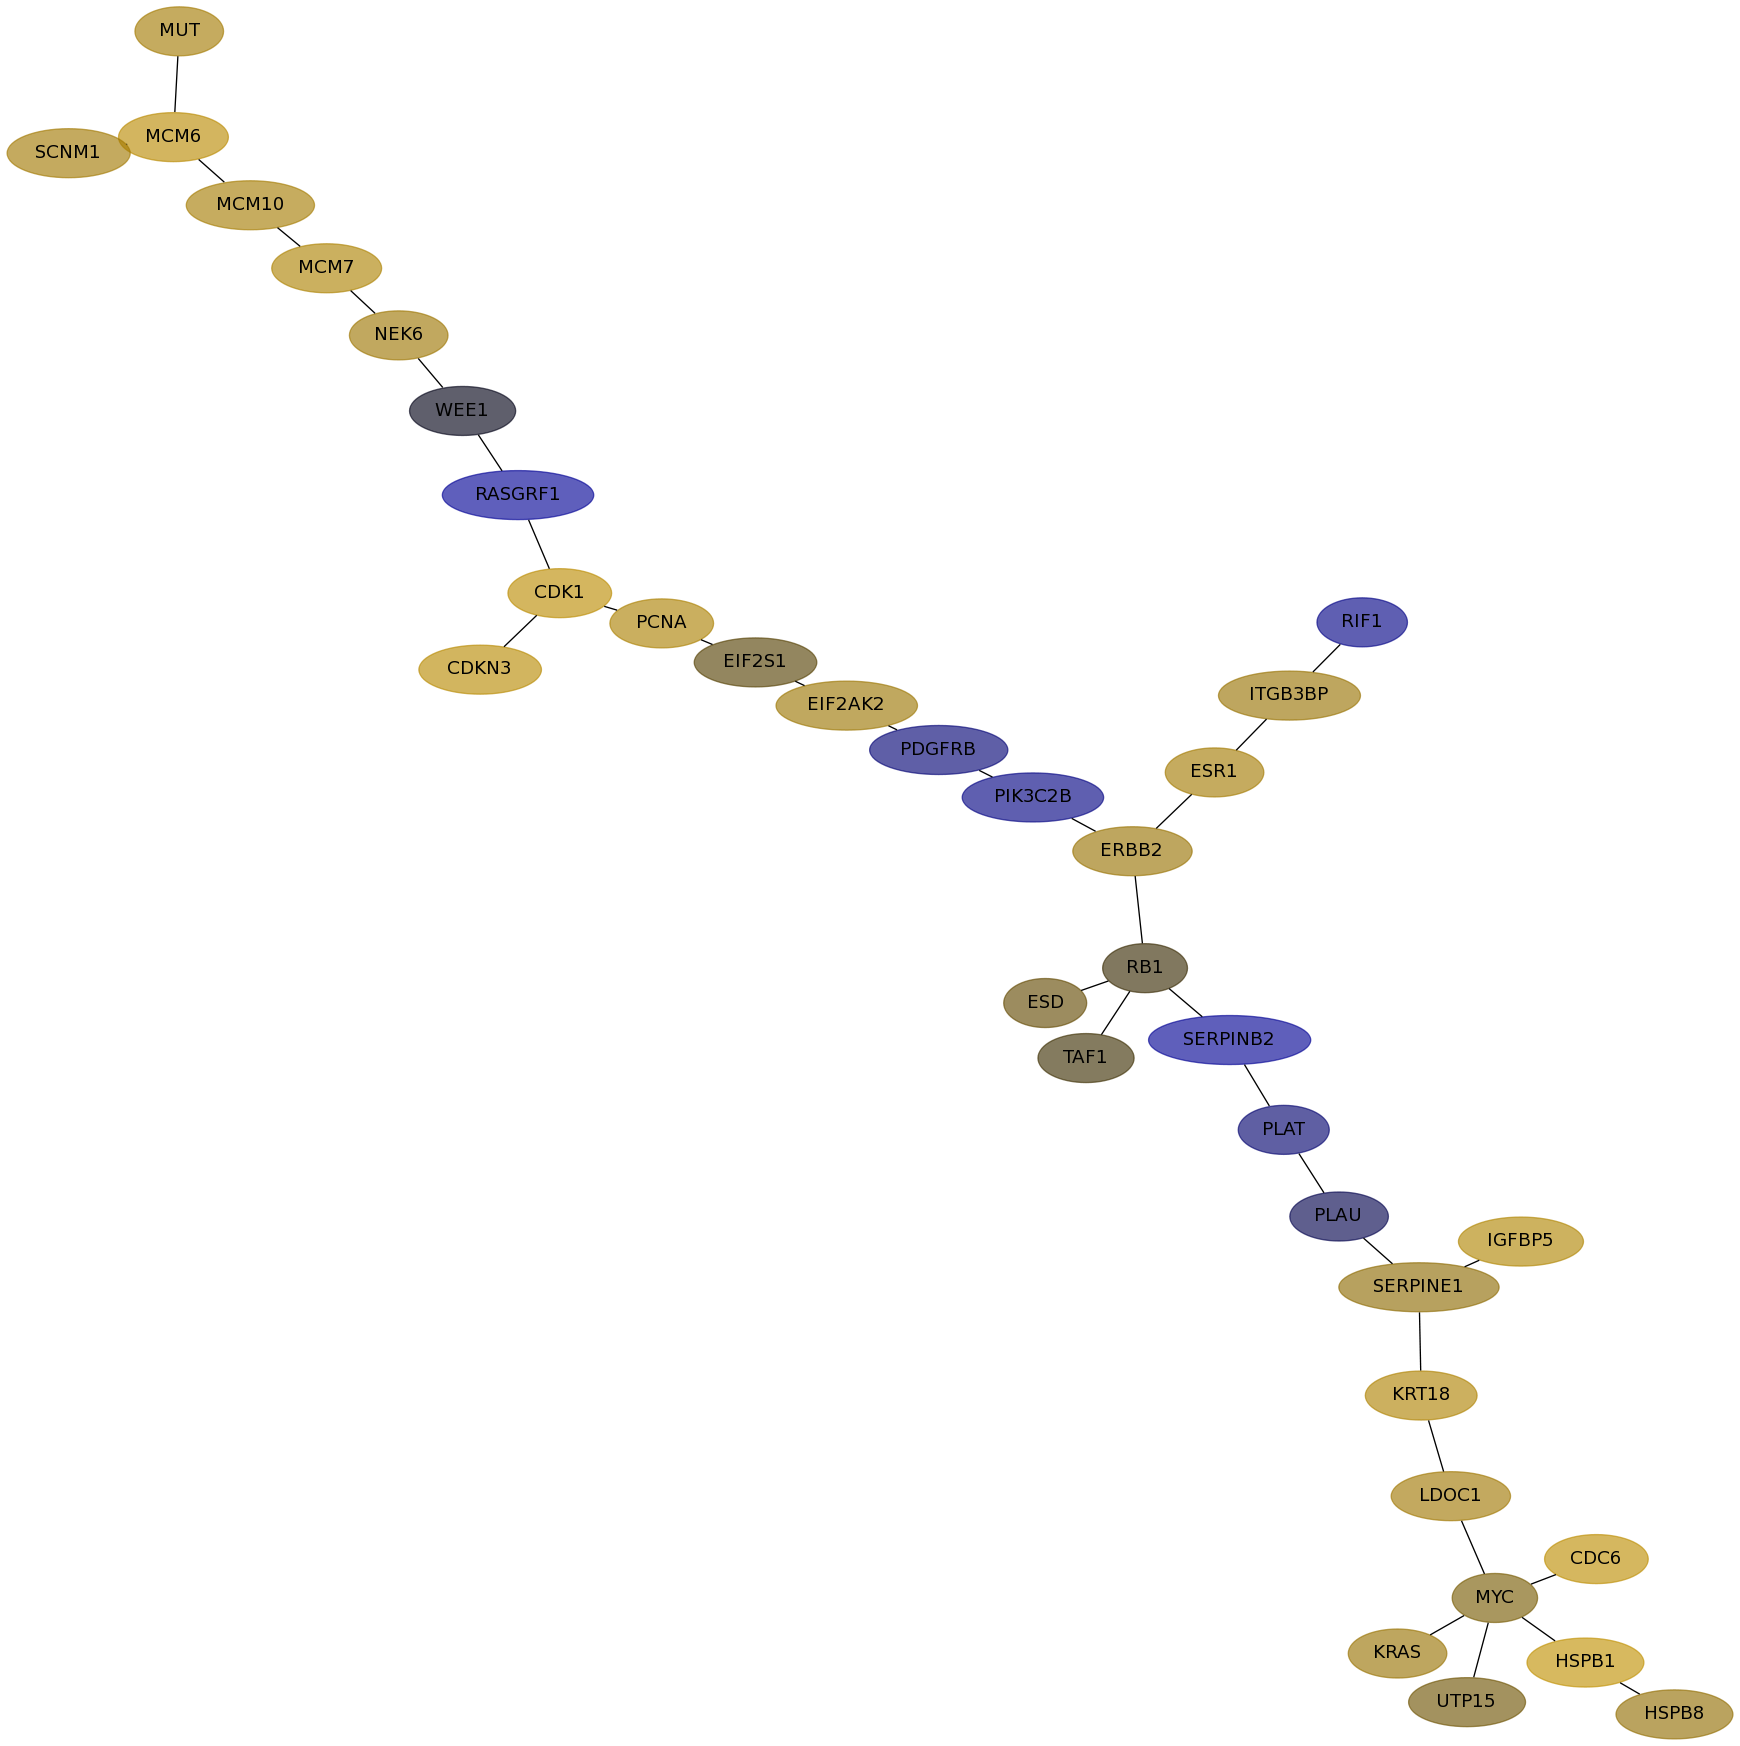
Subnetwork structure for each dataset
- Desmedt
Score for each gene in subnetwork 139 in each dataset
| Gene Symbol | Links | Frequency | Frequency Rank | Subnetwork score rank | Global rank |
Desmedt | IPC | Loi | Schmidt | Wang |
|---|
| MCM10 |   | 1 | 59 | 1 | 15 | 0.025 | 0.151 | 0.120 | 0.173 | 0.095 |
|---|
| MCM6 | | 1 | 59 | 1 | 15 | 0.021 | 0.100 | 0.195 | 0.243 | 0.153 |
|---|
| MUT | | 1 | 59 | 1 | 15 | -0.051 | -0.005 | 0.116 | 0.188 | -0.012 |
|---|
| LDOC1 | | 1 | 59 | 1 | 15 | 0.183 | 0.115 | 0.105 | 0.071 | -0.022 |
|---|
| TAF1 | | 1 | 59 | 1 | 15 | -0.066 | 0.201 | 0.010 | -0.089 | -0.050 |
|---|
| RIF1 | | 3 | 13 | 1 | 5 | -0.055 | 0.053 | -0.056 | -0.038 | 0.085 |
|---|
| ERBB2 | | 2 | 27 | 1 | 10 | 0.047 | -0.012 | 0.088 | 0.191 | -0.068 |
|---|
| MCM7 | | 1 | 59 | 1 | 15 | 0.103 | 0.083 | 0.146 | 0.144 | 0.142 |
|---|
| PLAT | | 1 | 59 | 1 | 15 | 0.121 | -0.076 | -0.033 | -0.205 | 0.181 |
|---|
| SERPINB2 | | 1 | 59 | 1 | 15 | -0.093 | 0.133 | -0.080 | -0.042 | -0.038 |
|---|
| WEE1 | | 2 | 27 | 1 | 10 | 0.186 | -0.013 | -0.003 | 0.043 | 0.146 |
|---|
| RB1 | | 1 | 59 | 1 | 15 | -0.072 | -0.005 | 0.009 | -0.041 | 0.170 |
|---|
| EIF2AK2 | | 1 | 59 | 1 | 15 | 0.034 | 0.084 | 0.095 | 0.235 | -0.037 |
|---|
| PCNA | | 3 | 13 | 1 | 5 | 0.120 | 0.192 | 0.141 | 0.138 | 0.184 |
|---|
| NEK6 | | 1 | 59 | 1 | 15 | undef | 0.026 | 0.099 | undef | undef |
|---|
| PLAU | | 1 | 59 | 1 | 15 | 0.114 | 0.162 | -0.014 | 0.008 | 0.109 |
|---|
| MYC | | 4 | 6 | 1 | 3 | 0.142 | 0.031 | 0.041 | 0.035 | -0.138 |
|---|
| ESD | | 1 | 59 | 1 | 15 | -0.120 | 0.052 | 0.025 | -0.107 | -0.107 |
|---|
| PDGFRB | | 3 | 13 | 1 | 5 | 0.116 | -0.093 | -0.038 | -0.159 | 0.110 |
|---|
| RASGRF1 | | 1 | 59 | 1 | 15 | -0.002 | 0.158 | -0.083 | -0.038 | 0.087 |
|---|
| UTP15 | | 1 | 59 | 1 | 15 | undef | 0.137 | 0.032 | undef | undef |
|---|
| CDC6 | | 2 | 27 | 1 | 10 | 0.102 | 0.134 | 0.211 | 0.284 | 0.078 |
|---|
| KRAS | | 2 | 27 | 1 | 10 | -0.041 | 0.147 | 0.088 | 0.259 | 0.018 |
|---|
| CDK1 | | 3 | 13 | 1 | 5 | 0.047 | 0.152 | 0.200 | 0.204 | 0.254 |
|---|
| SCNM1 | | 1 | 59 | 1 | 15 | 0.050 | 0.033 | 0.110 | 0.176 | 0.070 |
|---|
| ITGB3BP | | 2 | 27 | 1 | 10 | -0.116 | 0.163 | 0.090 | -0.039 | 0.054 |
|---|
| IGFBP5 | | 4 | 6 | 1 | 3 | 0.142 | 0.011 | 0.158 | 0.087 | -0.000 |
|---|
| HSPB8 | | 3 | 13 | 1 | 5 | 0.231 | 0.010 | 0.076 | -0.044 | 0.013 |
|---|
| EIF2S1 | | 1 | 59 | 1 | 15 | -0.133 | 0.037 | 0.017 | 0.293 | 0.161 |
|---|
| PIK3C2B | | 1 | 59 | 1 | 15 | -0.033 | -0.129 | -0.054 | 0.089 | 0.076 |
|---|
| SERPINE1 | | 1 | 59 | 1 | 15 | 0.179 | -0.038 | 0.069 | -0.136 | -0.025 |
|---|
| ESR1 | | 6 | 2 | 1 | 1 | 0.125 | 0.032 | 0.114 | -0.064 | 0.048 |
|---|
| HSPB1 | | 6 | 2 | 1 | 1 | 0.262 | 0.053 | 0.231 | 0.043 | 0.144 |
|---|
| KRT18 | | 1 | 59 | 1 | 15 | 0.157 | 0.038 | 0.150 | 0.021 | 0.070 |
|---|
| CDKN3 | | 1 | 59 | 1 | 15 | 0.108 | 0.156 | 0.191 | 0.208 | 0.269 |
|---|
GO Enrichment output for subnetwork 139 in each dataset
| Name | Accession Number | Link | P-val | Corrected P-val |
|---|
| G1 phase | GO:0051318 |  | 1.795E-07 | 4.128E-04 |
|---|
| regulation of retinoic acid receptor signaling pathway | GO:0048385 | | 3.271E-07 | 3.762E-04 |
|---|
| protein amino acid autophosphorylation | GO:0046777 | | 3.406E-07 | 2.611E-04 |
|---|
| regulation of Rac protein signal transduction | GO:0035020 | | 6.527E-07 | 3.753E-04 |
|---|
| fibrinolysis | GO:0042730 | | 1.14E-06 | 5.242E-04 |
|---|
| platelet-derived growth factor receptor signaling pathway | GO:0048008 | | 3.88E-06 | 1.487E-03 |
|---|
| interphase of mitotic cell cycle | GO:0051329 | | 8.771E-06 | 2.882E-03 |
|---|
| interphase | GO:0051325 | | 9.818E-06 | 2.823E-03 |
|---|
| G1 phase of mitotic cell cycle | GO:0000080 | | 1.166E-05 | 2.98E-03 |
|---|
| negative regulation of blood coagulation | GO:0030195 | | 1.166E-05 | 2.682E-03 |
|---|
| DNA replication initiation | GO:0006270 | | 1.786E-05 | 3.734E-03 |
|---|
| Name | Accession Number | Link | P-val | Corrected P-val |
|---|
| G1 phase | GO:0051318 | | 1.304E-11 | 3.187E-08 |
|---|
| protein amino acid autophosphorylation | GO:0046777 | | 2.283E-10 | 2.788E-07 |
|---|
| G1 phase of mitotic cell cycle | GO:0000080 | | 8.849E-10 | 7.206E-07 |
|---|
| interphase of mitotic cell cycle | GO:0051329 | | 4.754E-09 | 2.903E-06 |
|---|
| muscle cell migration | GO:0014812 | | 1.411E-07 | 6.896E-05 |
|---|
| regulation of retinoic acid receptor signaling pathway | GO:0048385 | | 1.411E-07 | 5.747E-05 |
|---|
| fibrinolysis | GO:0042730 | | 4.922E-07 | 1.718E-04 |
|---|
| regulation of Rac protein signal transduction | GO:0035020 | | 7.862E-07 | 2.401E-04 |
|---|
| transcription initiation | GO:0006352 | | 4.222E-06 | 1.146E-03 |
|---|
| stem cell development | GO:0048864 | | 7.751E-06 | 1.894E-03 |
|---|
| DNA replication initiation | GO:0006270 | | 7.751E-06 | 1.721E-03 |
|---|
| Name | Accession Number | Link | P-val | Corrected P-val |
|---|
| G1 phase | GO:0051318 | | 8.267E-12 | 1.989E-08 |
|---|
| protein amino acid autophosphorylation | GO:0046777 | | 2.689E-10 | 3.235E-07 |
|---|
| G1 phase of mitotic cell cycle | GO:0000080 | | 5.298E-10 | 4.249E-07 |
|---|
| interphase of mitotic cell cycle | GO:0051329 | | 7.135E-09 | 4.292E-06 |
|---|
| interphase | GO:0051325 | | 8.875E-09 | 4.271E-06 |
|---|
| muscle cell migration | GO:0014812 | | 1.867E-07 | 7.486E-05 |
|---|
| regulation of retinoic acid receptor signaling pathway | GO:0048385 | | 1.867E-07 | 6.417E-05 |
|---|
| fibrinolysis | GO:0042730 | | 6.509E-07 | 1.958E-04 |
|---|
| regulation of Rac protein signal transduction | GO:0035020 | | 1.039E-06 | 2.779E-04 |
|---|
| transcription initiation | GO:0006352 | | 5.651E-06 | 1.36E-03 |
|---|
| stem cell development | GO:0048864 | | 6.678E-06 | 1.461E-03 |
|---|
| Name | Accession Number | Link | P-val | Corrected P-val |
|---|
| G1 phase | GO:0051318 | | 1.795E-07 | 4.128E-04 |
|---|
| regulation of retinoic acid receptor signaling pathway | GO:0048385 | | 3.271E-07 | 3.762E-04 |
|---|
| protein amino acid autophosphorylation | GO:0046777 | | 3.406E-07 | 2.611E-04 |
|---|
| regulation of Rac protein signal transduction | GO:0035020 | | 6.527E-07 | 3.753E-04 |
|---|
| fibrinolysis | GO:0042730 | | 1.14E-06 | 5.242E-04 |
|---|
| platelet-derived growth factor receptor signaling pathway | GO:0048008 | | 3.88E-06 | 1.487E-03 |
|---|
| interphase of mitotic cell cycle | GO:0051329 | | 8.771E-06 | 2.882E-03 |
|---|
| interphase | GO:0051325 | | 9.818E-06 | 2.823E-03 |
|---|
| G1 phase of mitotic cell cycle | GO:0000080 | | 1.166E-05 | 2.98E-03 |
|---|
| negative regulation of blood coagulation | GO:0030195 | | 1.166E-05 | 2.682E-03 |
|---|
| DNA replication initiation | GO:0006270 | | 1.786E-05 | 3.734E-03 |
|---|
| Name | Accession Number | Link | P-val | Corrected P-val |
|---|
| G1 phase | GO:0051318 | | 1.795E-07 | 4.128E-04 |
|---|
| regulation of retinoic acid receptor signaling pathway | GO:0048385 | | 3.271E-07 | 3.762E-04 |
|---|
| protein amino acid autophosphorylation | GO:0046777 | | 3.406E-07 | 2.611E-04 |
|---|
| regulation of Rac protein signal transduction | GO:0035020 | | 6.527E-07 | 3.753E-04 |
|---|
| fibrinolysis | GO:0042730 | | 1.14E-06 | 5.242E-04 |
|---|
| platelet-derived growth factor receptor signaling pathway | GO:0048008 | | 3.88E-06 | 1.487E-03 |
|---|
| interphase of mitotic cell cycle | GO:0051329 | | 8.771E-06 | 2.882E-03 |
|---|
| interphase | GO:0051325 | | 9.818E-06 | 2.823E-03 |
|---|
| G1 phase of mitotic cell cycle | GO:0000080 | | 1.166E-05 | 2.98E-03 |
|---|
| negative regulation of blood coagulation | GO:0030195 | | 1.166E-05 | 2.682E-03 |
|---|
| DNA replication initiation | GO:0006270 | | 1.786E-05 | 3.734E-03 |
|---|

