Study VanDeVijver-ER-neg
Study informations
122 subnetworks in total page | file
1481 genes associated page | file
Enriched GO terms page
General informations
General Index page
Study Index page
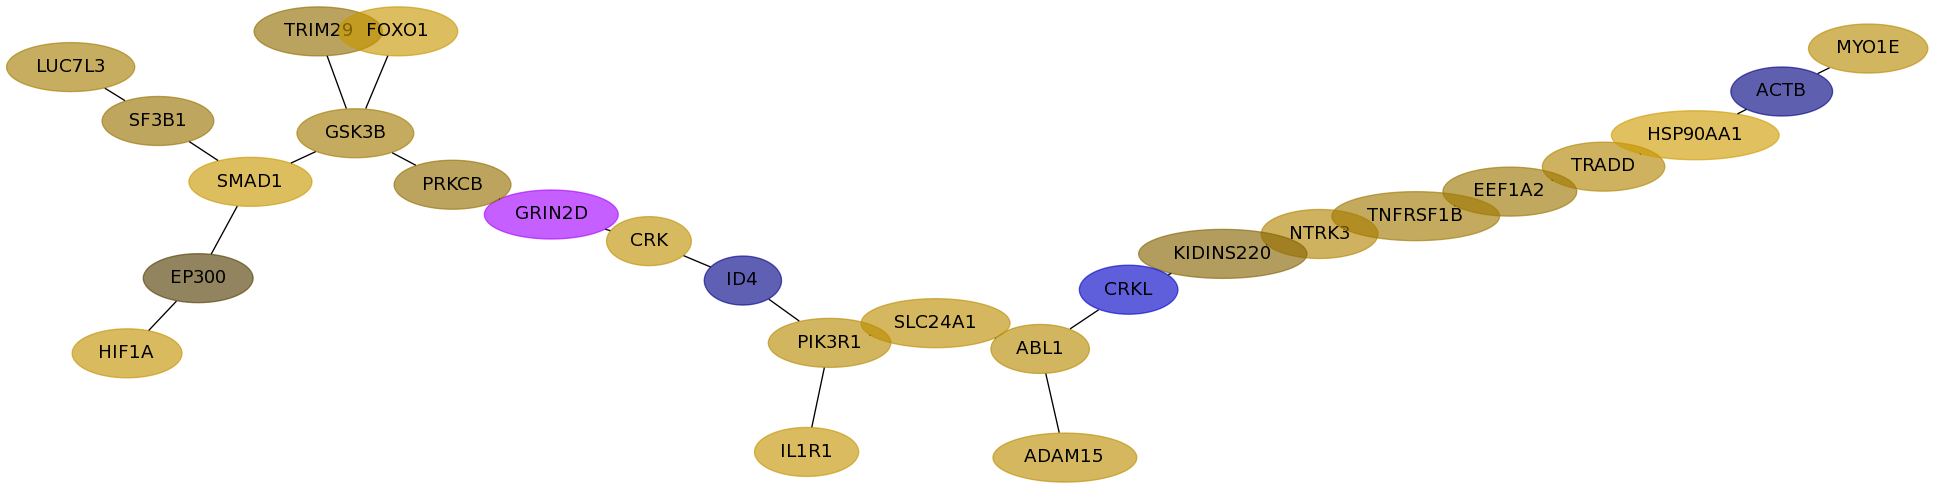
Subnetwork 1235
score
| Dataset | Score | P-val 1 | P-val 2 | P-val 3 | Fisher Score |
|---|
| Desmedt | 0.3338 | 1.474e-03 | 2.500e-05 | 1.608e-01 | 5.925e-09 |
|---|
| IPC | 0.3324 | 3.627e-01 | 1.908e-01 | 9.385e-01 | 6.494e-02 |
|---|
| Loi | 0.4858 | 3.500e-05 | 0.000e+00 | 4.881e-02 | 0.000e+00 |
|---|
| Schmidt | 0.5998 | 1.000e-06 | 0.000e+00 | 1.131e-01 | 0.000e+00 |
|---|
| Wang | 0.2561 | 8.013e-03 | 6.830e-02 | 2.350e-01 | 1.286e-04 |
|---|
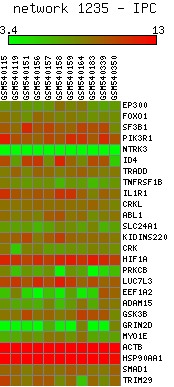
Expression data for subnetwork 1235 in each dataset
Desmedt |
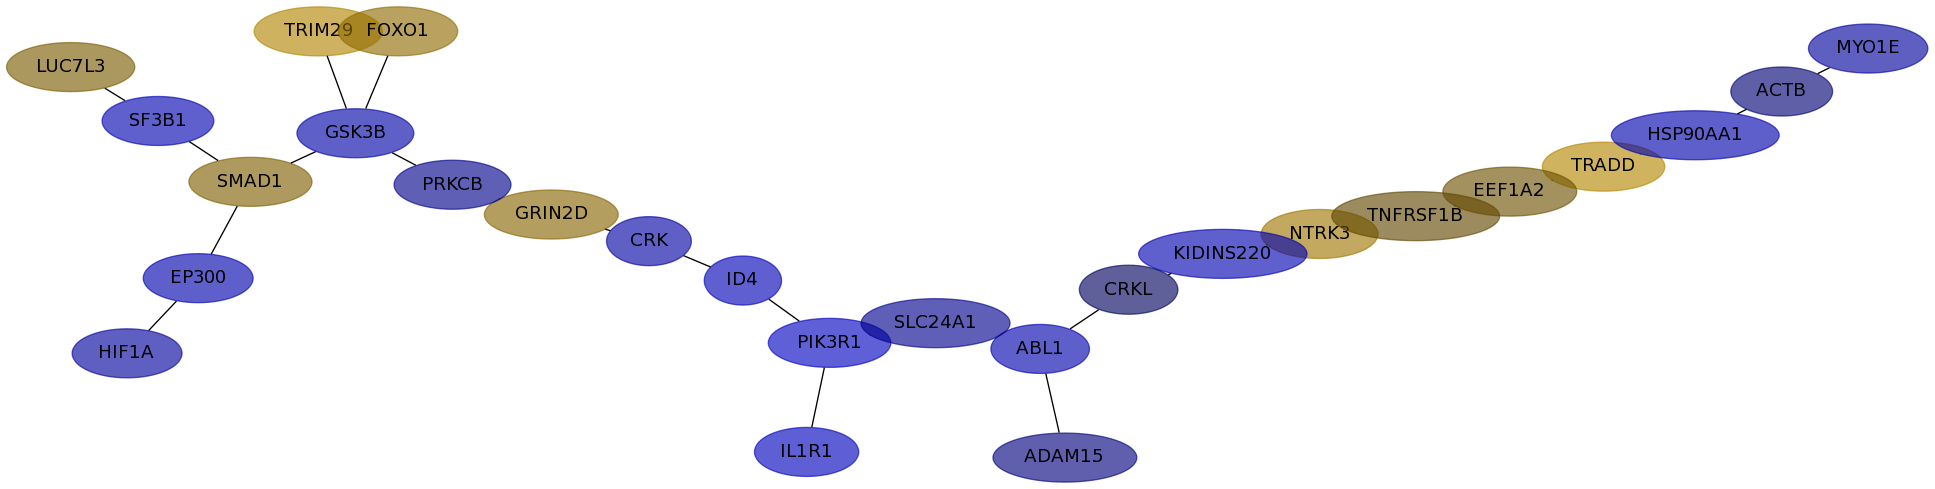
IPC |
Loi |
Schmidt |
Wang |
Subnetwork structure for each dataset
- Desmedt
Score for each gene in subnetwork 1235 in each dataset
| Gene Symbol | Links | Frequency | Frequency Rank | Subnetwork score rank | Global rank |
Desmedt | IPC | Loi | Schmidt | Wang |
|---|
| EP300 |   | 71 | 3 | 1 | 2 | 0.016 | -0.149 | 0.087 | 0.102 | 0.025 |
|---|
| FOXO1 | | 4 | 198 | 148 | 162 | 0.278 | 0.072 | 0.094 | -0.021 | 0.221 |
|---|
| SF3B1 | | 15 | 40 | 148 | 144 | 0.091 | -0.154 | 0.126 | -0.073 | -0.204 |
|---|
| PIK3R1 | | 91 | 1 | 1 | 1 | 0.189 | -0.237 | 0.381 | 0.065 | -0.002 |
|---|
| NTRK3 | | 1 | 652 | 740 | 763 | 0.167 | 0.104 | 0.192 | 0.087 | -0.173 |
|---|
| ID4 | | 13 | 47 | 444 | 430 | -0.060 | -0.179 | 0.137 | 0.241 | 0.036 |
|---|
| TRADD | | 2 | 391 | 740 | 745 | 0.162 | 0.167 | 0.082 | -0.167 | 0.134 |
|---|
| TNFRSF1B | | 12 | 55 | 563 | 544 | 0.109 | 0.024 | -0.187 | -0.096 | -0.106 |
|---|
| IL1R1 | | 8 | 84 | 536 | 515 | 0.257 | -0.211 | 0.178 | -0.071 | 0.003 |
|---|
| CRKL | | 7 | 100 | 326 | 317 | -0.271 | -0.023 | 0.056 | 0.271 | -0.008 |
|---|
| ABL1 | | 8 | 84 | 326 | 316 | 0.193 | -0.152 | 0.200 | 0.108 | -0.059 |
|---|
| SLC24A1 | | 2 | 391 | 740 | 745 | 0.209 | -0.068 | 0.109 | 0.178 | 0.056 |
|---|
| KIDINS220 | | 1 | 652 | 740 | 763 | 0.056 | -0.157 | 0.081 | 0.079 | 0.033 |
|---|
| CRK | | 27 | 17 | 206 | 193 | 0.232 | -0.116 | 0.106 | 0.090 | 0.017 |
|---|
| HIF1A | | 21 | 23 | 33 | 31 | 0.246 | -0.098 | 0.224 | -0.118 | 0.356 |
|---|
| PRKCB | | 8 | 84 | 33 | 35 | 0.081 | -0.065 | 0.001 | -0.148 | -0.035 |
|---|
| LUC7L3 | | 13 | 47 | 148 | 148 | 0.123 | 0.043 | 0.237 | 0.175 | 0.074 |
|---|
| EEF1A2 | | 9 | 77 | 182 | 179 | 0.098 | 0.032 | 0.220 | -0.119 | 0.102 |
|---|
| ADAM15 | | 13 | 47 | 492 | 474 | 0.205 | -0.048 | -0.078 | -0.208 | -0.048 |
|---|
| GSK3B | | 47 | 7 | 33 | 28 | 0.117 | -0.130 | 0.292 | -0.129 | 0.057 |
|---|
| GRIN2D | | 18 | 26 | 33 | 32 | undef | 0.058 | 0.155 | 0.000 | undef |
|---|
| MYO1E | | 1 | 652 | 740 | 763 | 0.186 | -0.099 | 0.210 | -0.009 | 0.189 |
|---|
| ACTB | | 7 | 100 | 398 | 385 | -0.052 | -0.039 | 0.283 | -0.061 | 0.003 |
|---|
| HSP90AA1 | | 10 | 67 | 1 | 16 | 0.321 | -0.143 | 0.104 | 0.123 | -0.054 |
|---|
| SMAD1 | | 24 | 21 | 33 | 30 | 0.287 | 0.049 | 0.159 | -0.062 | 0.048 |
|---|
| TRIM29 | | 2 | 391 | 740 | 745 | 0.077 | 0.161 | 0.240 | -0.150 | 0.024 |
|---|
GO Enrichment output for subnetwork 1235 in each dataset
| Name | Accession Number | Link | P-val | Corrected P-val |
|---|
| positive regulation of oxidoreductase activity | GO:0051353 |  | 9.195E-06 | 0.02114871 |
|---|
| insulin receptor signaling pathway | GO:0008286 | | 4.018E-05 | 0.04621055 |
|---|
| regulation of oxidoreductase activity | GO:0051341 | | 4.018E-05 | 0.03080703 |
|---|
| regulation of hormone biosynthetic process | GO:0046885 | | 7.655E-05 | 0.04401601 |
|---|
| embryonic hemopoiesis | GO:0035162 | | 7.655E-05 | 0.03521281 |
|---|
| positive regulation of glycolysis | GO:0045821 | | 7.655E-05 | 0.02934401 |
|---|
| parathyroid gland development | GO:0060017 | | 7.655E-05 | 0.025152 |
|---|
| negative regulation of gliogenesis | GO:0014014 | | 7.655E-05 | 0.022008 |
|---|
| positive regulation of chemokine production | GO:0032722 | | 7.655E-05 | 0.01956267 |
|---|
| regulation of hair follicle development | GO:0051797 | | 7.655E-05 | 0.0176064 |
|---|
| regulation of sensory perception | GO:0051931 | | 7.655E-05 | 0.01600582 |
|---|
| Name | Accession Number | Link | P-val | Corrected P-val |
|---|
| positive regulation of oxidoreductase activity | GO:0051353 | | 2.997E-06 | 7.322E-03 |
|---|
| regulation of oxidoreductase activity | GO:0051341 | | 1.317E-05 | 0.01608643 |
|---|
| insulin receptor signaling pathway | GO:0008286 | | 1.895E-05 | 0.0154347 |
|---|
| hemoglobin biosynthetic process | GO:0042541 | | 3.593E-05 | 0.02194386 |
|---|
| positive regulation of glycolysis | GO:0045821 | | 3.593E-05 | 0.01755509 |
|---|
| parathyroid gland development | GO:0060017 | | 3.593E-05 | 0.01462924 |
|---|
| mRNA transcription | GO:0009299 | | 3.593E-05 | 0.01253935 |
|---|
| positive regulation of chemokine production | GO:0032722 | | 3.593E-05 | 0.01097193 |
|---|
| regulation of hair follicle development | GO:0051797 | | 3.593E-05 | 9.753E-03 |
|---|
| regulation of sensory perception | GO:0051931 | | 3.593E-05 | 8.778E-03 |
|---|
| tissue remodeling | GO:0048771 | | 4.966E-05 | 0.01102993 |
|---|
| Name | Accession Number | Link | P-val | Corrected P-val |
|---|
| positive regulation of oxidoreductase activity | GO:0051353 | | 4.286E-06 | 0.01031096 |
|---|
| regulation of oxidoreductase activity | GO:0051341 | | 1.88E-05 | 0.02261702 |
|---|
| insulin receptor signaling pathway | GO:0008286 | | 2.408E-05 | 0.01930932 |
|---|
| hemoglobin biosynthetic process | GO:0042541 | | 4.567E-05 | 0.02747274 |
|---|
| positive regulation of glycolysis | GO:0045821 | | 4.567E-05 | 0.02197819 |
|---|
| parathyroid gland development | GO:0060017 | | 4.567E-05 | 0.01831516 |
|---|
| mRNA transcription | GO:0009299 | | 4.567E-05 | 0.01569871 |
|---|
| positive regulation of chemokine production | GO:0032722 | | 4.567E-05 | 0.01373637 |
|---|
| regulation of hair follicle development | GO:0051797 | | 4.567E-05 | 0.0122101 |
|---|
| regulation of sensory perception | GO:0051931 | | 4.567E-05 | 0.01098909 |
|---|
| positive regulation of cAMP biosynthetic process | GO:0030819 | | 6.842E-05 | 0.01496424 |
|---|
| Name | Accession Number | Link | P-val | Corrected P-val |
|---|
| positive regulation of oxidoreductase activity | GO:0051353 | | 9.195E-06 | 0.02114871 |
|---|
| insulin receptor signaling pathway | GO:0008286 | | 4.018E-05 | 0.04621055 |
|---|
| regulation of oxidoreductase activity | GO:0051341 | | 4.018E-05 | 0.03080703 |
|---|
| regulation of hormone biosynthetic process | GO:0046885 | | 7.655E-05 | 0.04401601 |
|---|
| embryonic hemopoiesis | GO:0035162 | | 7.655E-05 | 0.03521281 |
|---|
| positive regulation of glycolysis | GO:0045821 | | 7.655E-05 | 0.02934401 |
|---|
| parathyroid gland development | GO:0060017 | | 7.655E-05 | 0.025152 |
|---|
| negative regulation of gliogenesis | GO:0014014 | | 7.655E-05 | 0.022008 |
|---|
| positive regulation of chemokine production | GO:0032722 | | 7.655E-05 | 0.01956267 |
|---|
| regulation of hair follicle development | GO:0051797 | | 7.655E-05 | 0.0176064 |
|---|
| regulation of sensory perception | GO:0051931 | | 7.655E-05 | 0.01600582 |
|---|
| Name | Accession Number | Link | P-val | Corrected P-val |
|---|
| positive regulation of oxidoreductase activity | GO:0051353 | | 9.195E-06 | 0.02114871 |
|---|
| insulin receptor signaling pathway | GO:0008286 | | 4.018E-05 | 0.04621055 |
|---|
| regulation of oxidoreductase activity | GO:0051341 | | 4.018E-05 | 0.03080703 |
|---|
| regulation of hormone biosynthetic process | GO:0046885 | | 7.655E-05 | 0.04401601 |
|---|
| embryonic hemopoiesis | GO:0035162 | | 7.655E-05 | 0.03521281 |
|---|
| positive regulation of glycolysis | GO:0045821 | | 7.655E-05 | 0.02934401 |
|---|
| parathyroid gland development | GO:0060017 | | 7.655E-05 | 0.025152 |
|---|
| negative regulation of gliogenesis | GO:0014014 | | 7.655E-05 | 0.022008 |
|---|
| positive regulation of chemokine production | GO:0032722 | | 7.655E-05 | 0.01956267 |
|---|
| regulation of hair follicle development | GO:0051797 | | 7.655E-05 | 0.0176064 |
|---|
| regulation of sensory perception | GO:0051931 | | 7.655E-05 | 0.01600582 |
|---|

